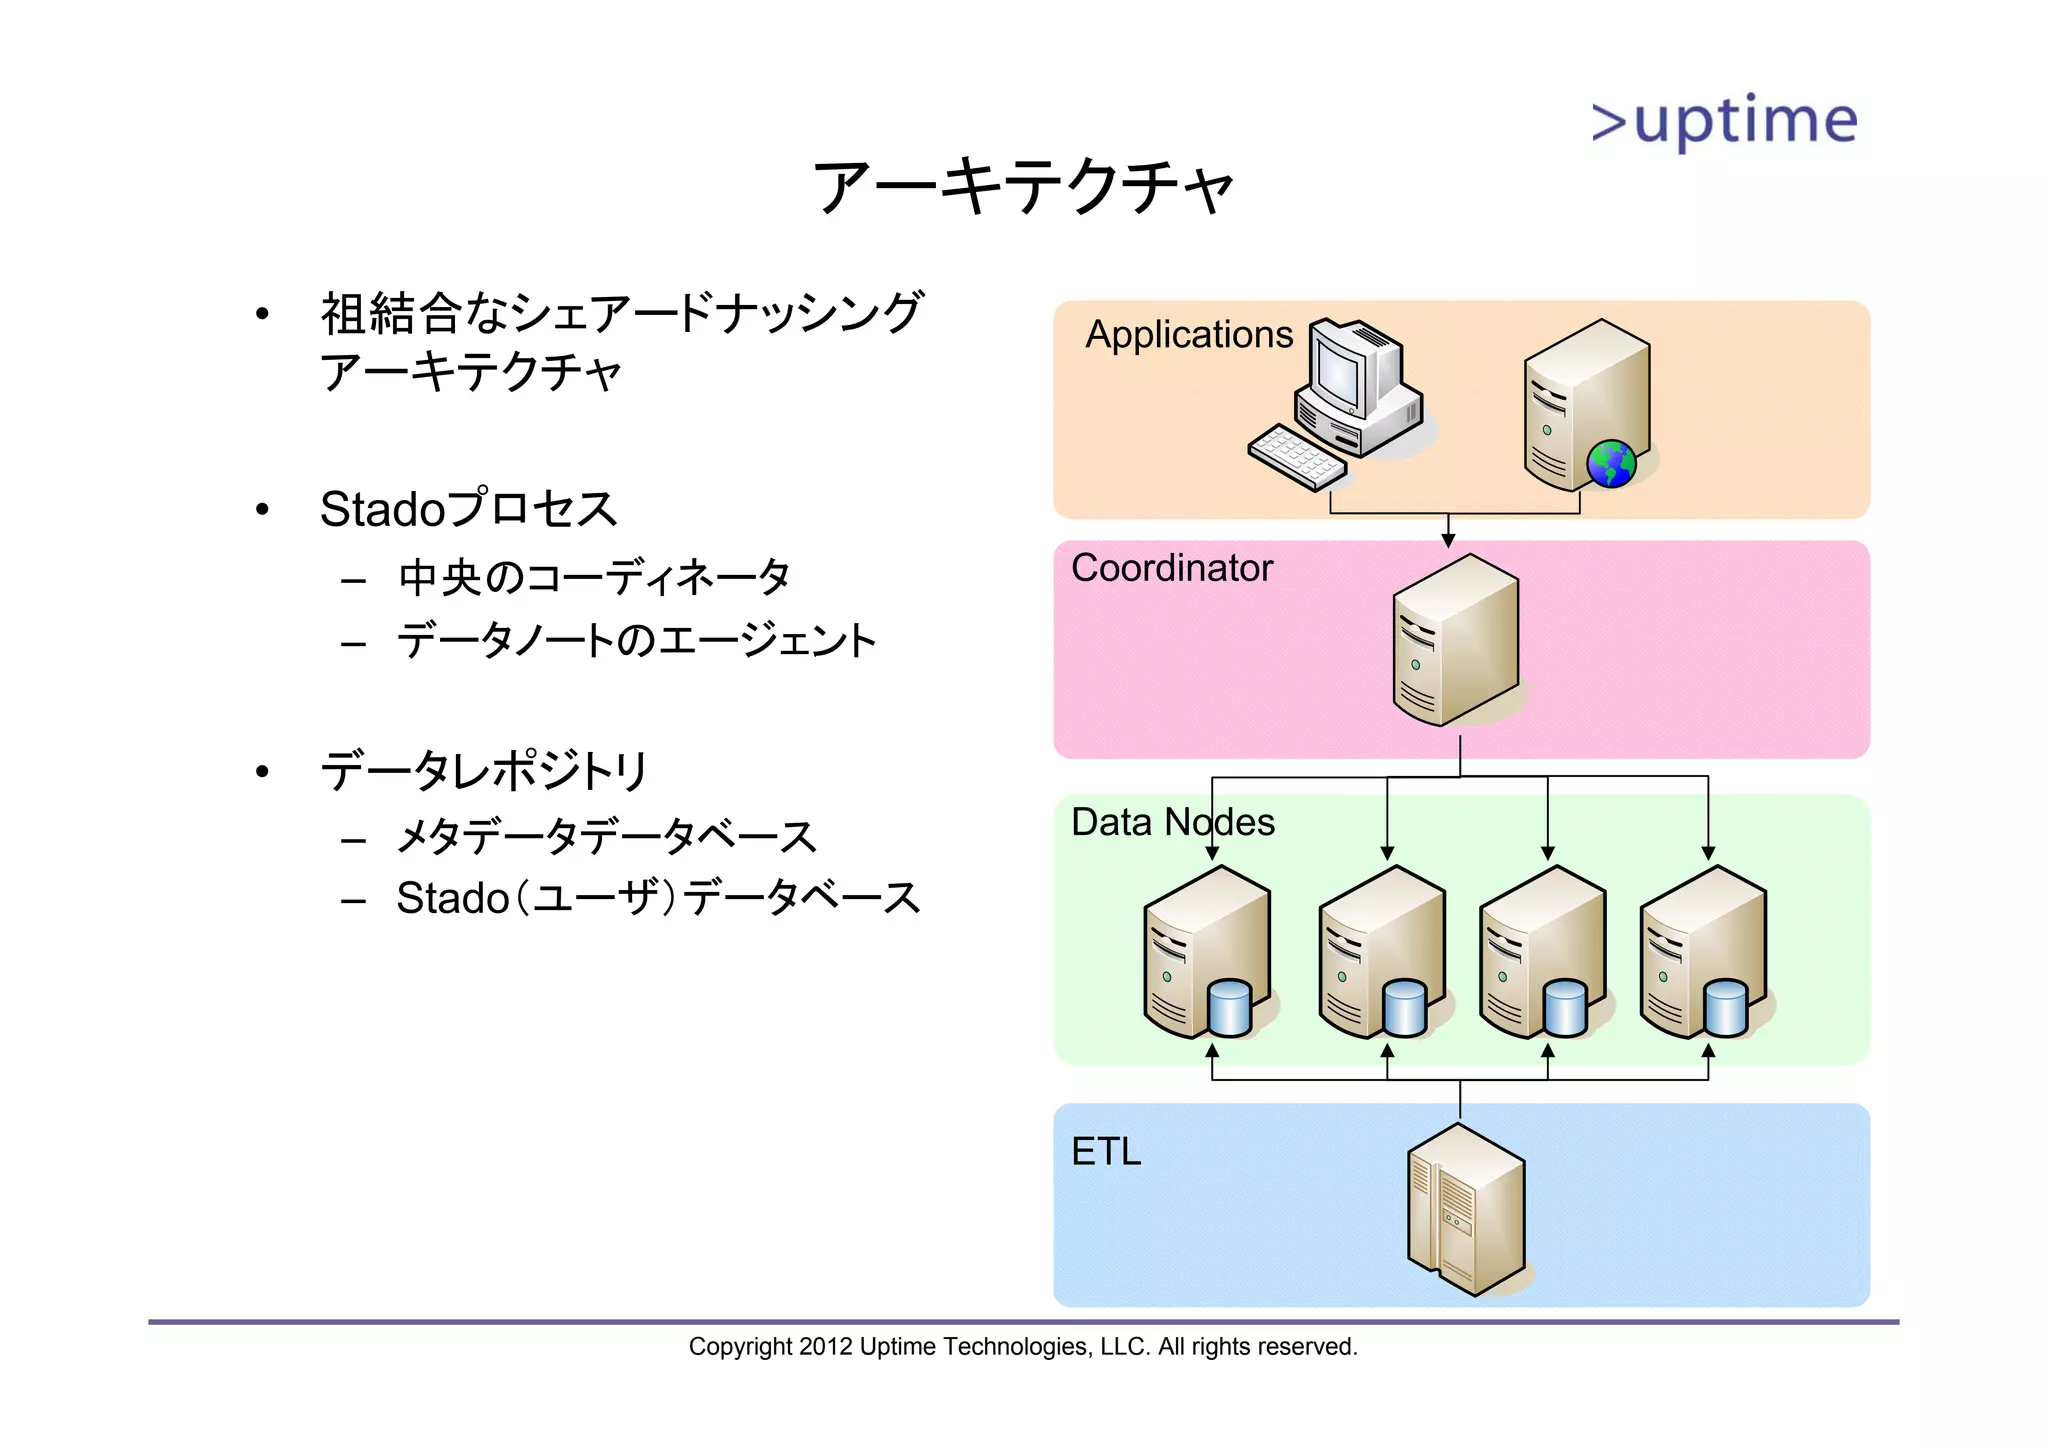
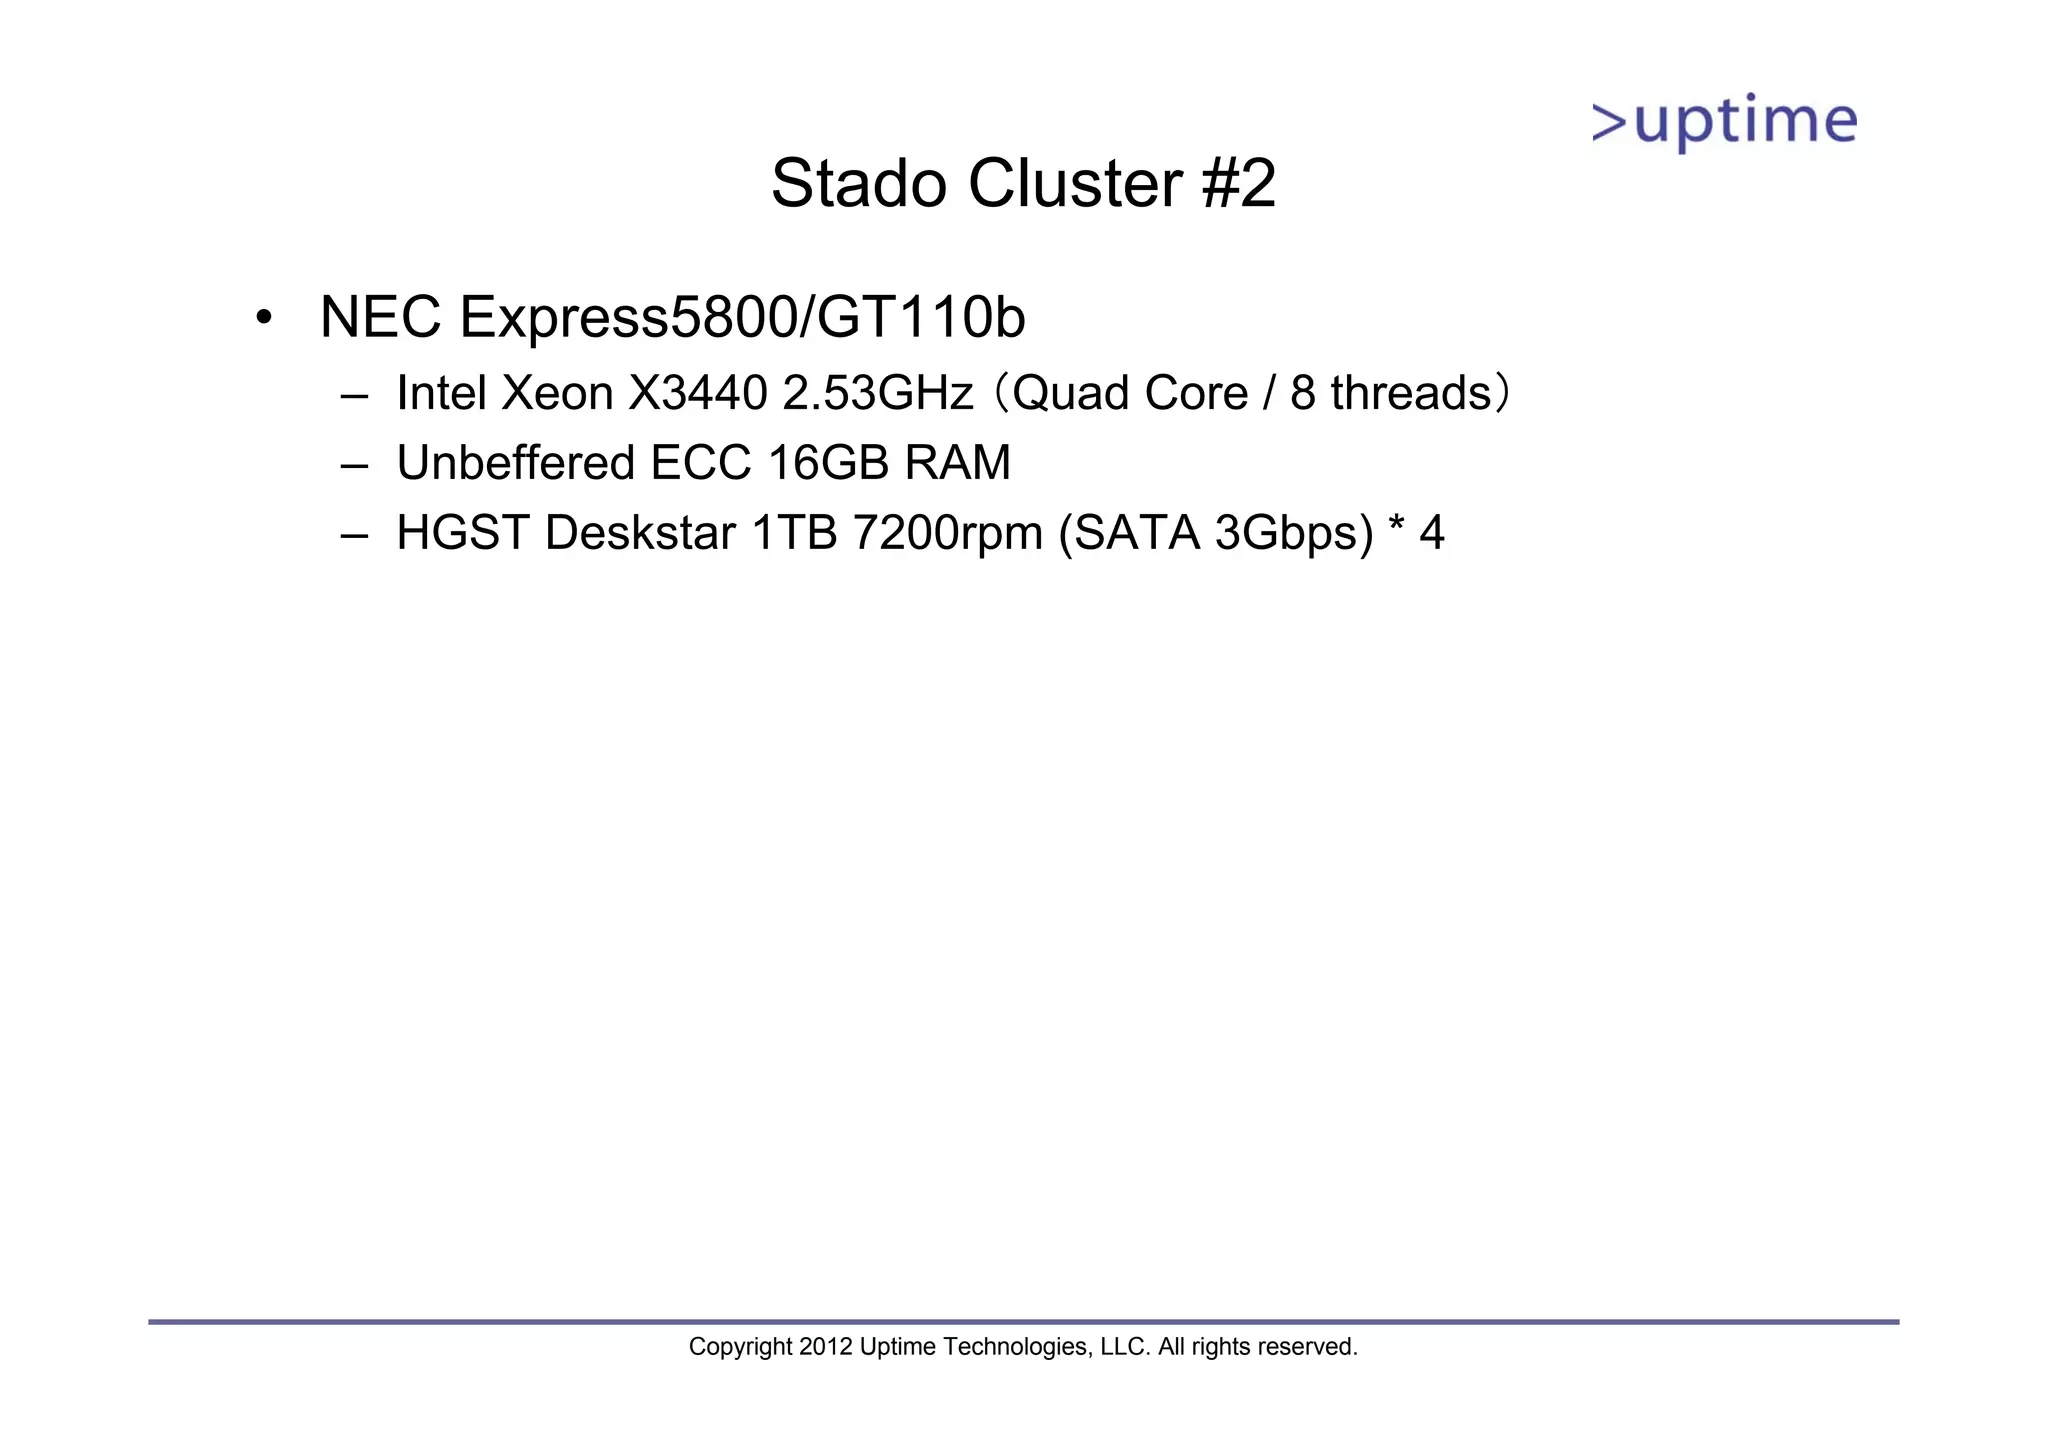
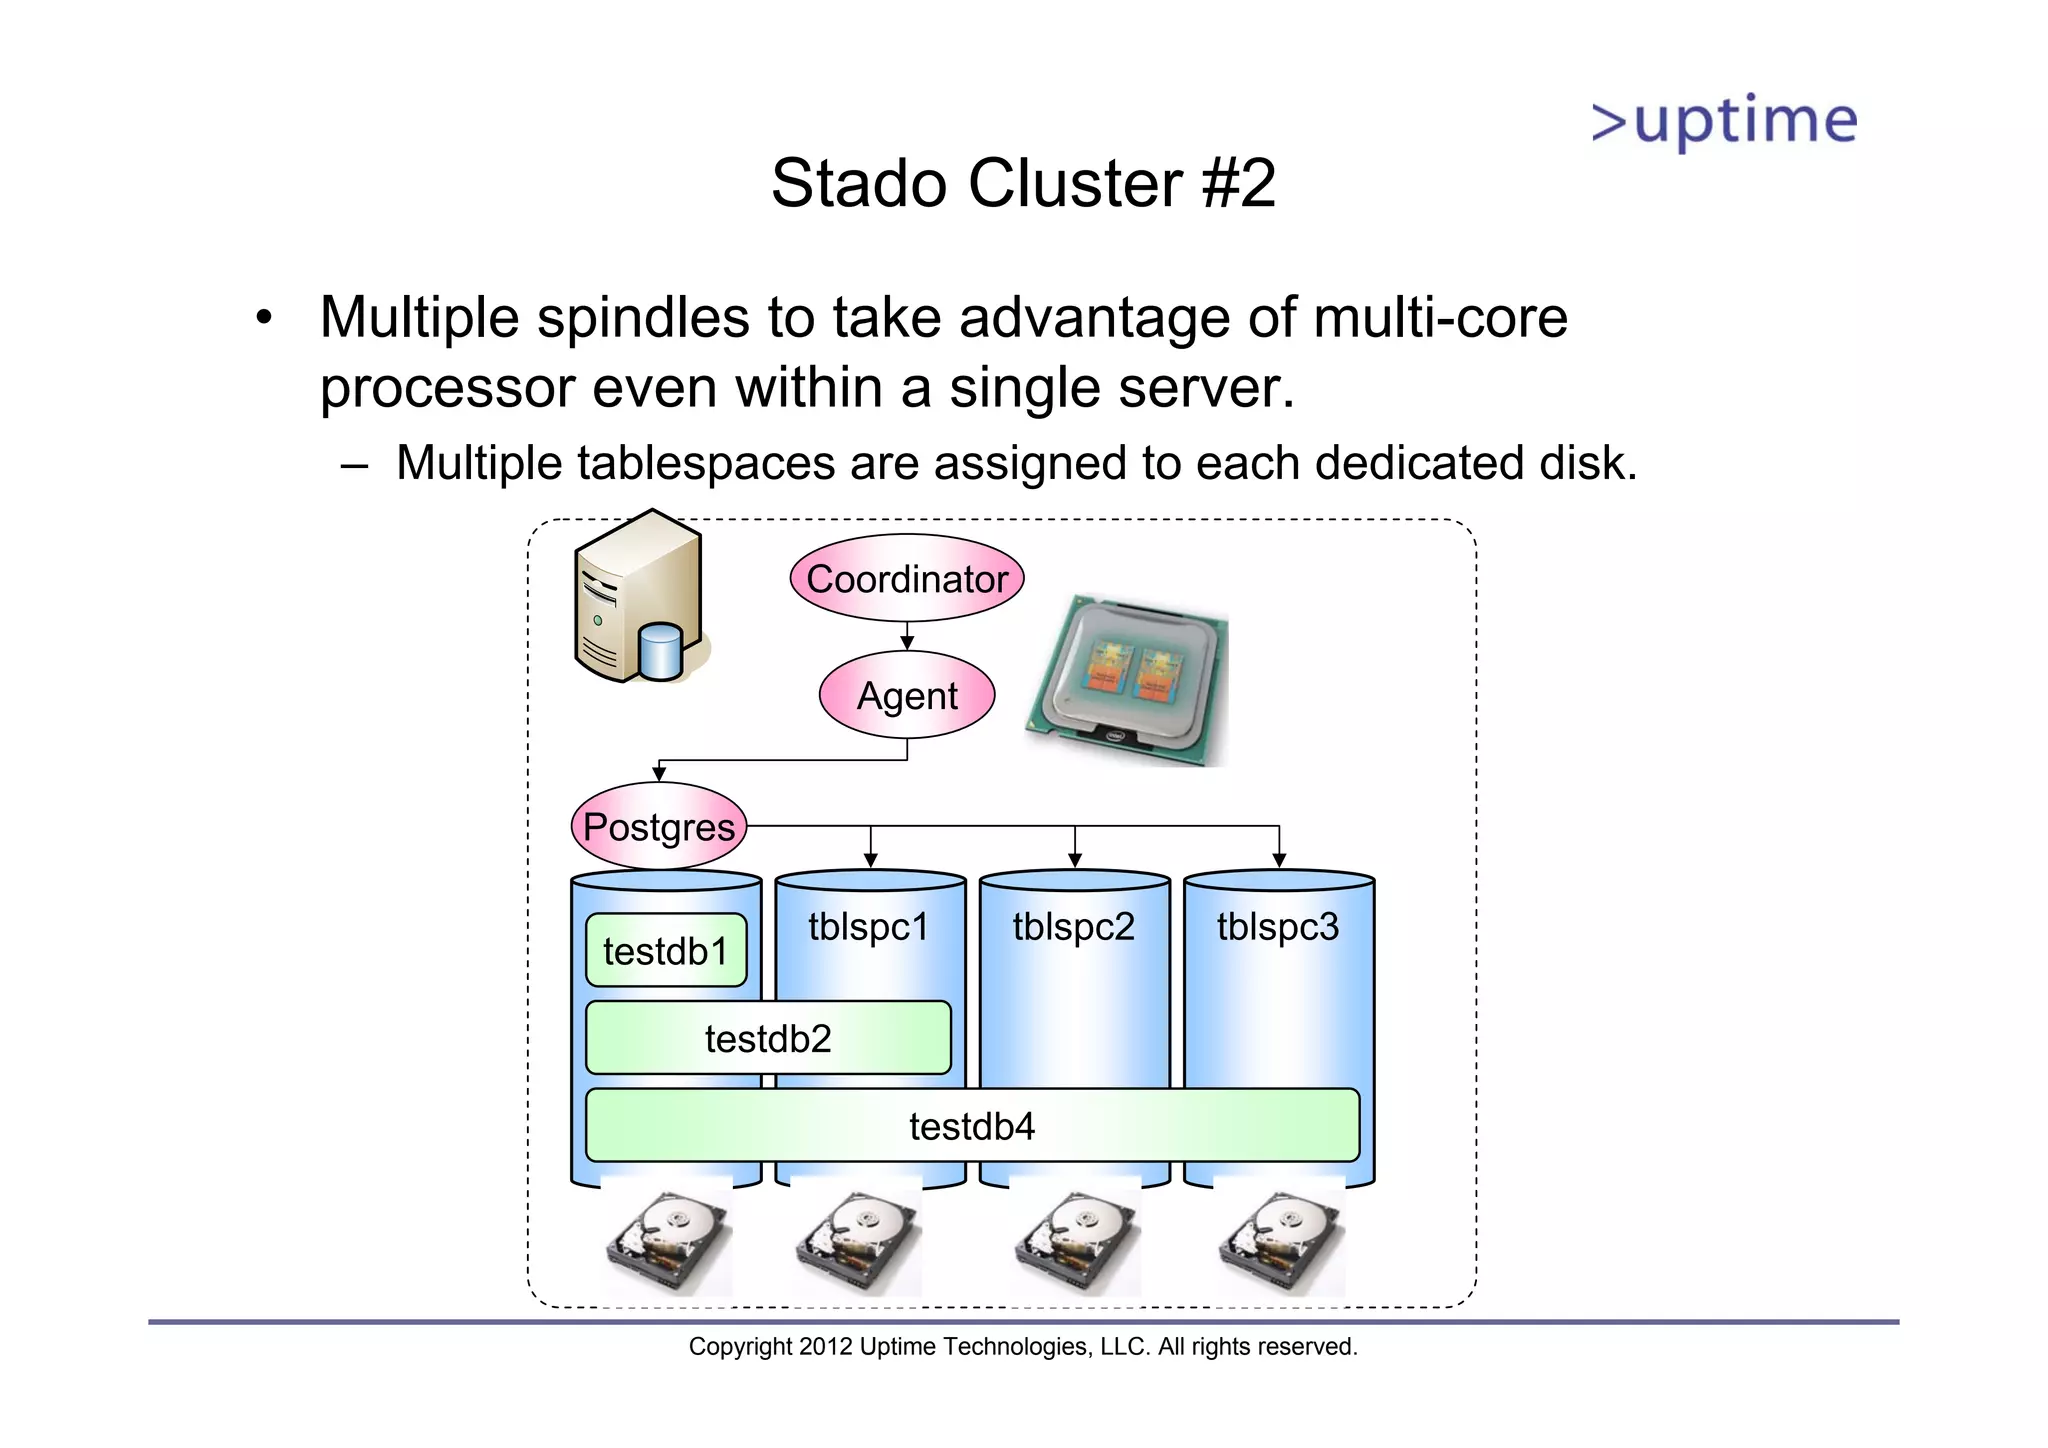
Stado Cluster #2 •Multiple spindles to take advantage of multi-core processor even within a single server. – Multiple tablespaces are assigned to each dedicated disk. Coordinator Agent Postgres tblspc1 tblspc2 tblspc3 testdb1 testdb2 testdb4 Copyright 2012 Uptime Technologies, LLC. All rights reserved.
42.
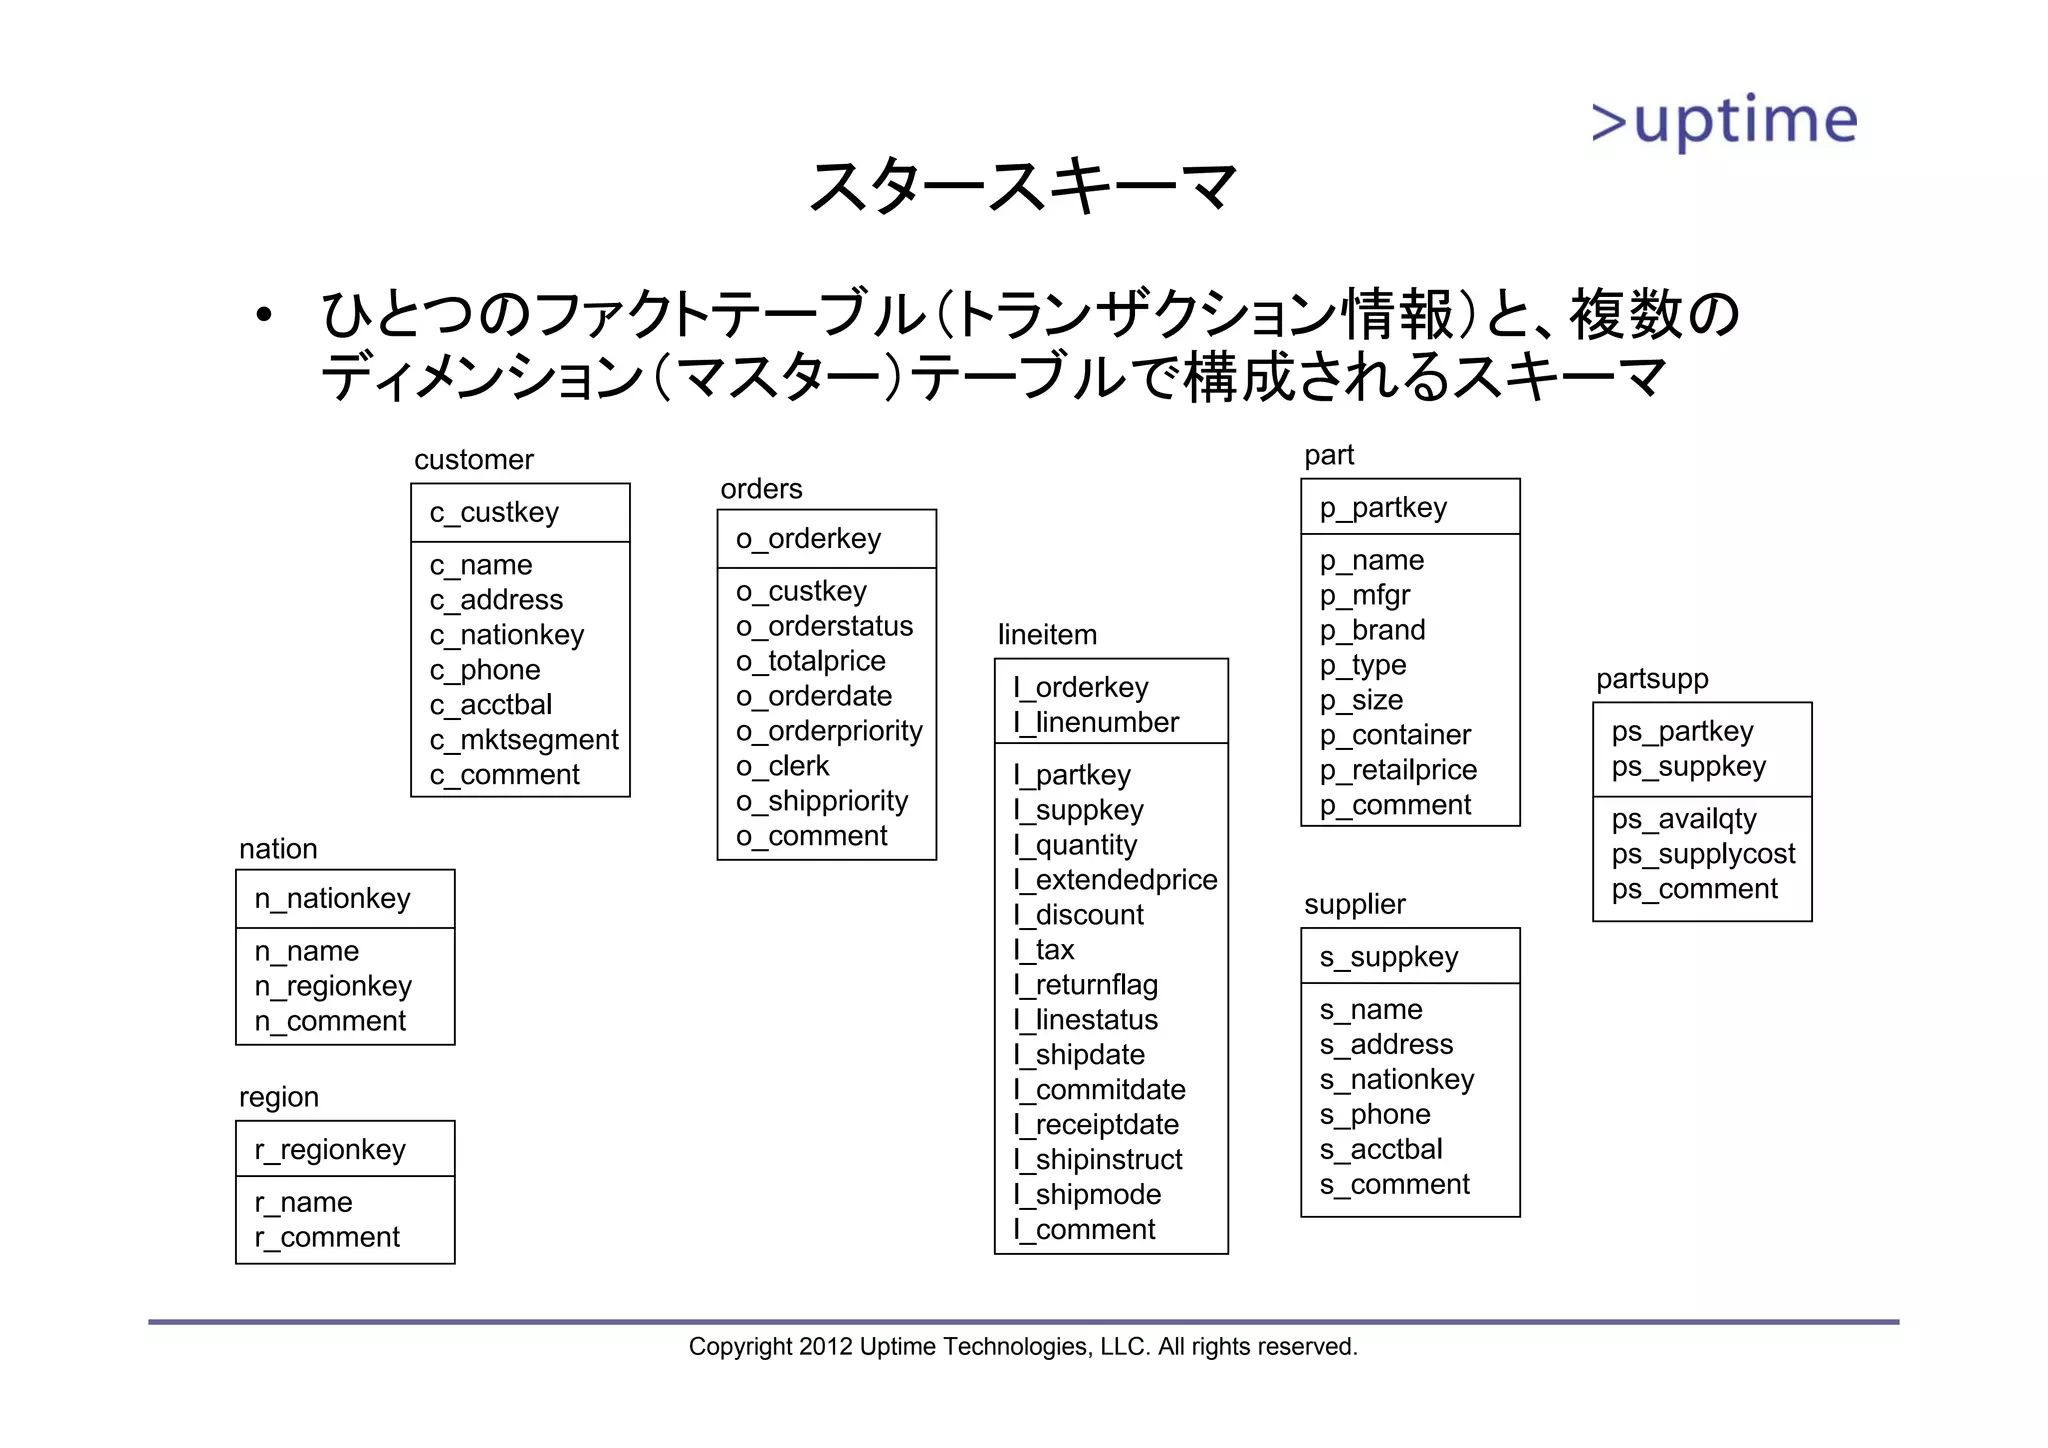
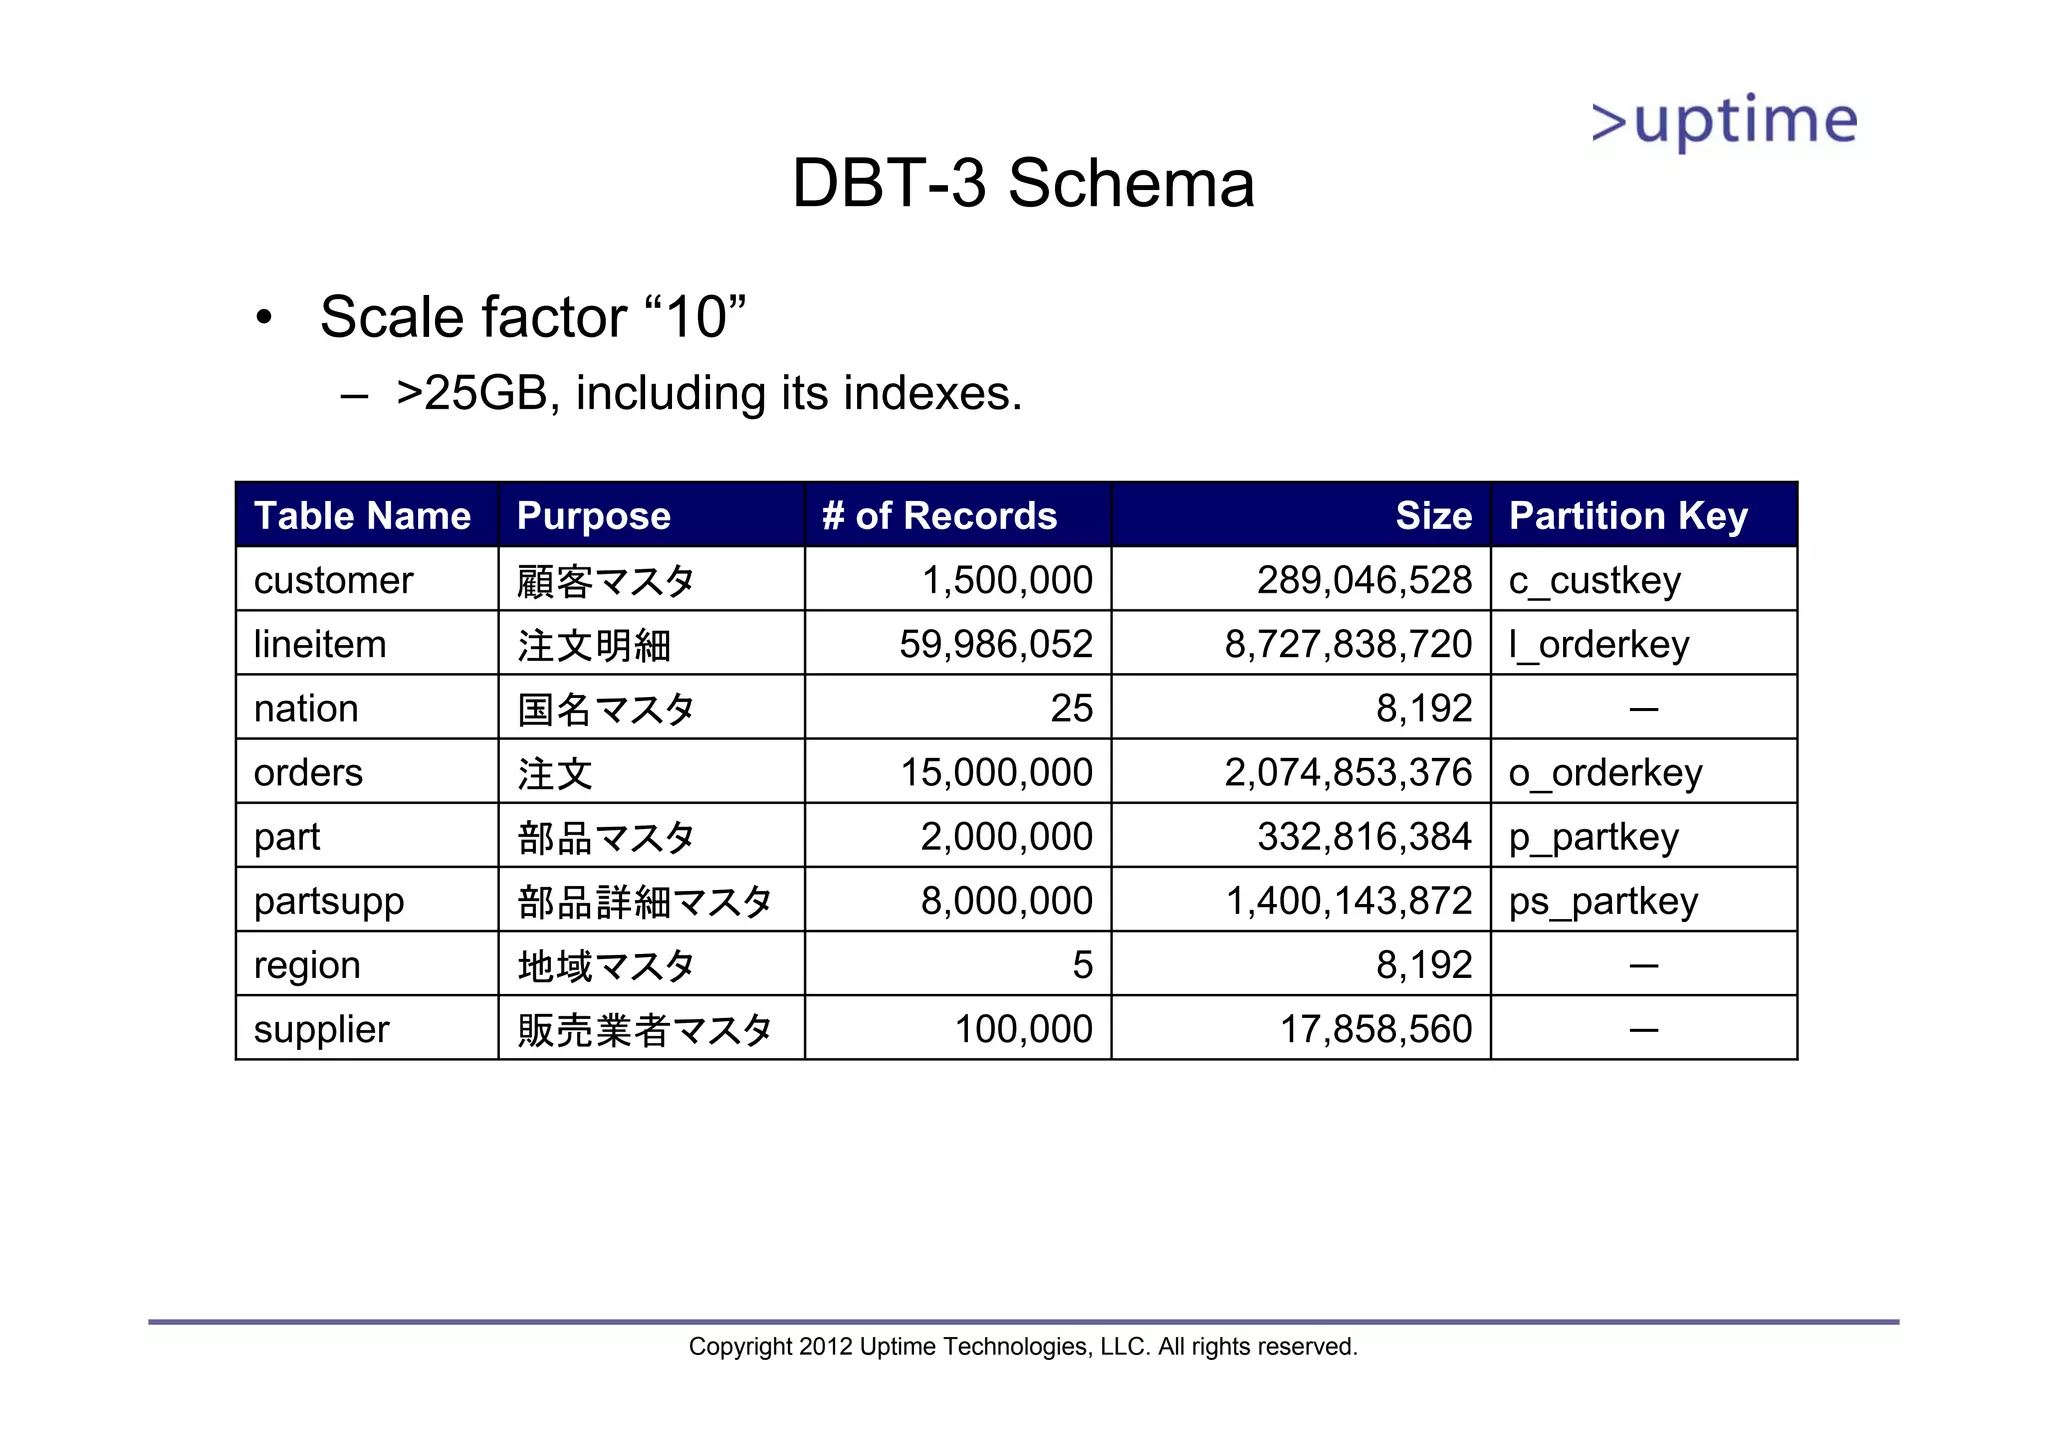
DBT-3 Schema • Scalefactor “10” – >25GB, including its indexes. Table Name Purpose # of Records Size Partition Key customer 顧客マスタ 1,500,000 289,046,528 c_custkey lineitem 注文明細 59,986,052 8,727,838,720 l_orderkey nation 国名マスタ 25 8,192 - orders 注文 15,000,000 2,074,853,376 o_orderkey part 部品マスタ 2,000,000 332,816,384 p_partkey partsupp 部品詳細マスタ 8,000,000 1,400,143,872 ps_partkey region 地域マスタ 5 8,192 - supplier 販売業者マスタ 100,000 17,858,560 - Copyright 2012 Uptime Technologies, LLC. All rights reserved.
43.
Stado Test #1 •Data Loading / データロード • Creating indexes / インデックス作成 • Aggregation (count, sum) / 集約(count, sum) • Aggregation + GROUP BY (daily basis, country basis) / 集約+GROUP BY (日別売上、国別売上) • JOIN (local) / 結合(ノード内) • JOIN (cross-node) / 結合(ノード間) Copyright 2012 Uptime Technologies, LLC. All rights reserved.
44.
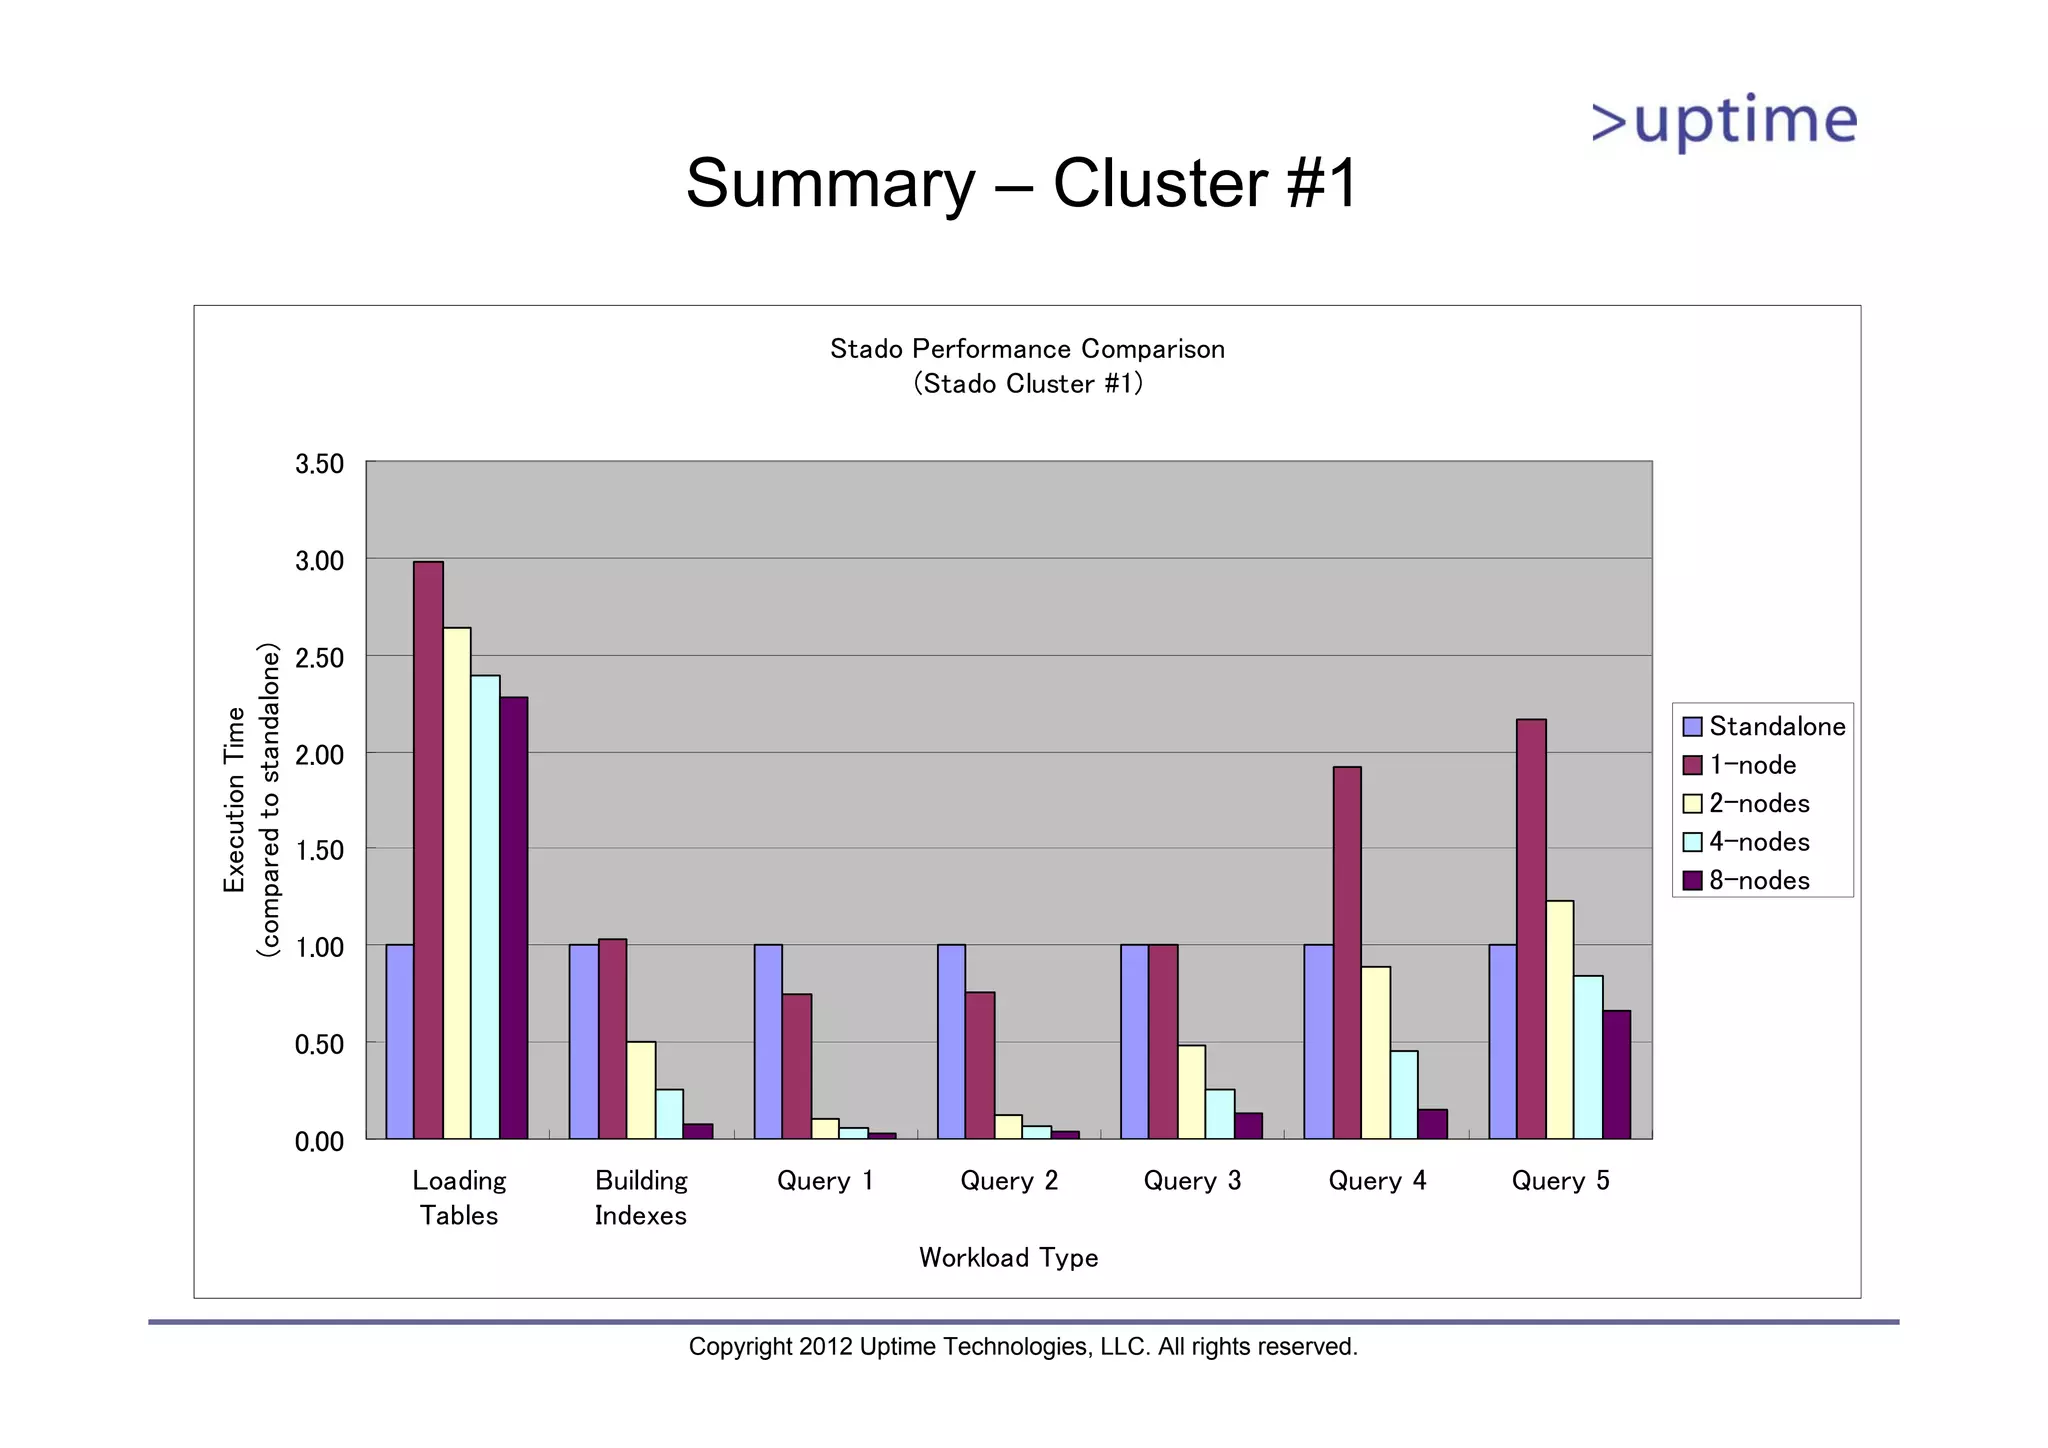
Summary – Cluster#1 Stado Performance Comparison (Stado Cluster #1) 3.50 3.00 (compared to standalone) 2.50 Execution Time Standalone 2.00 1-node 2-nodes 1.50 4-nodes 8-nodes 1.00 0.50 0.00 Loading Building Query 1 Query 2 Query 3 Query 4 Query 5 Tables Indexes Workload Type Copyright 2012 Uptime Technologies, LLC. All rights reserved.
45.
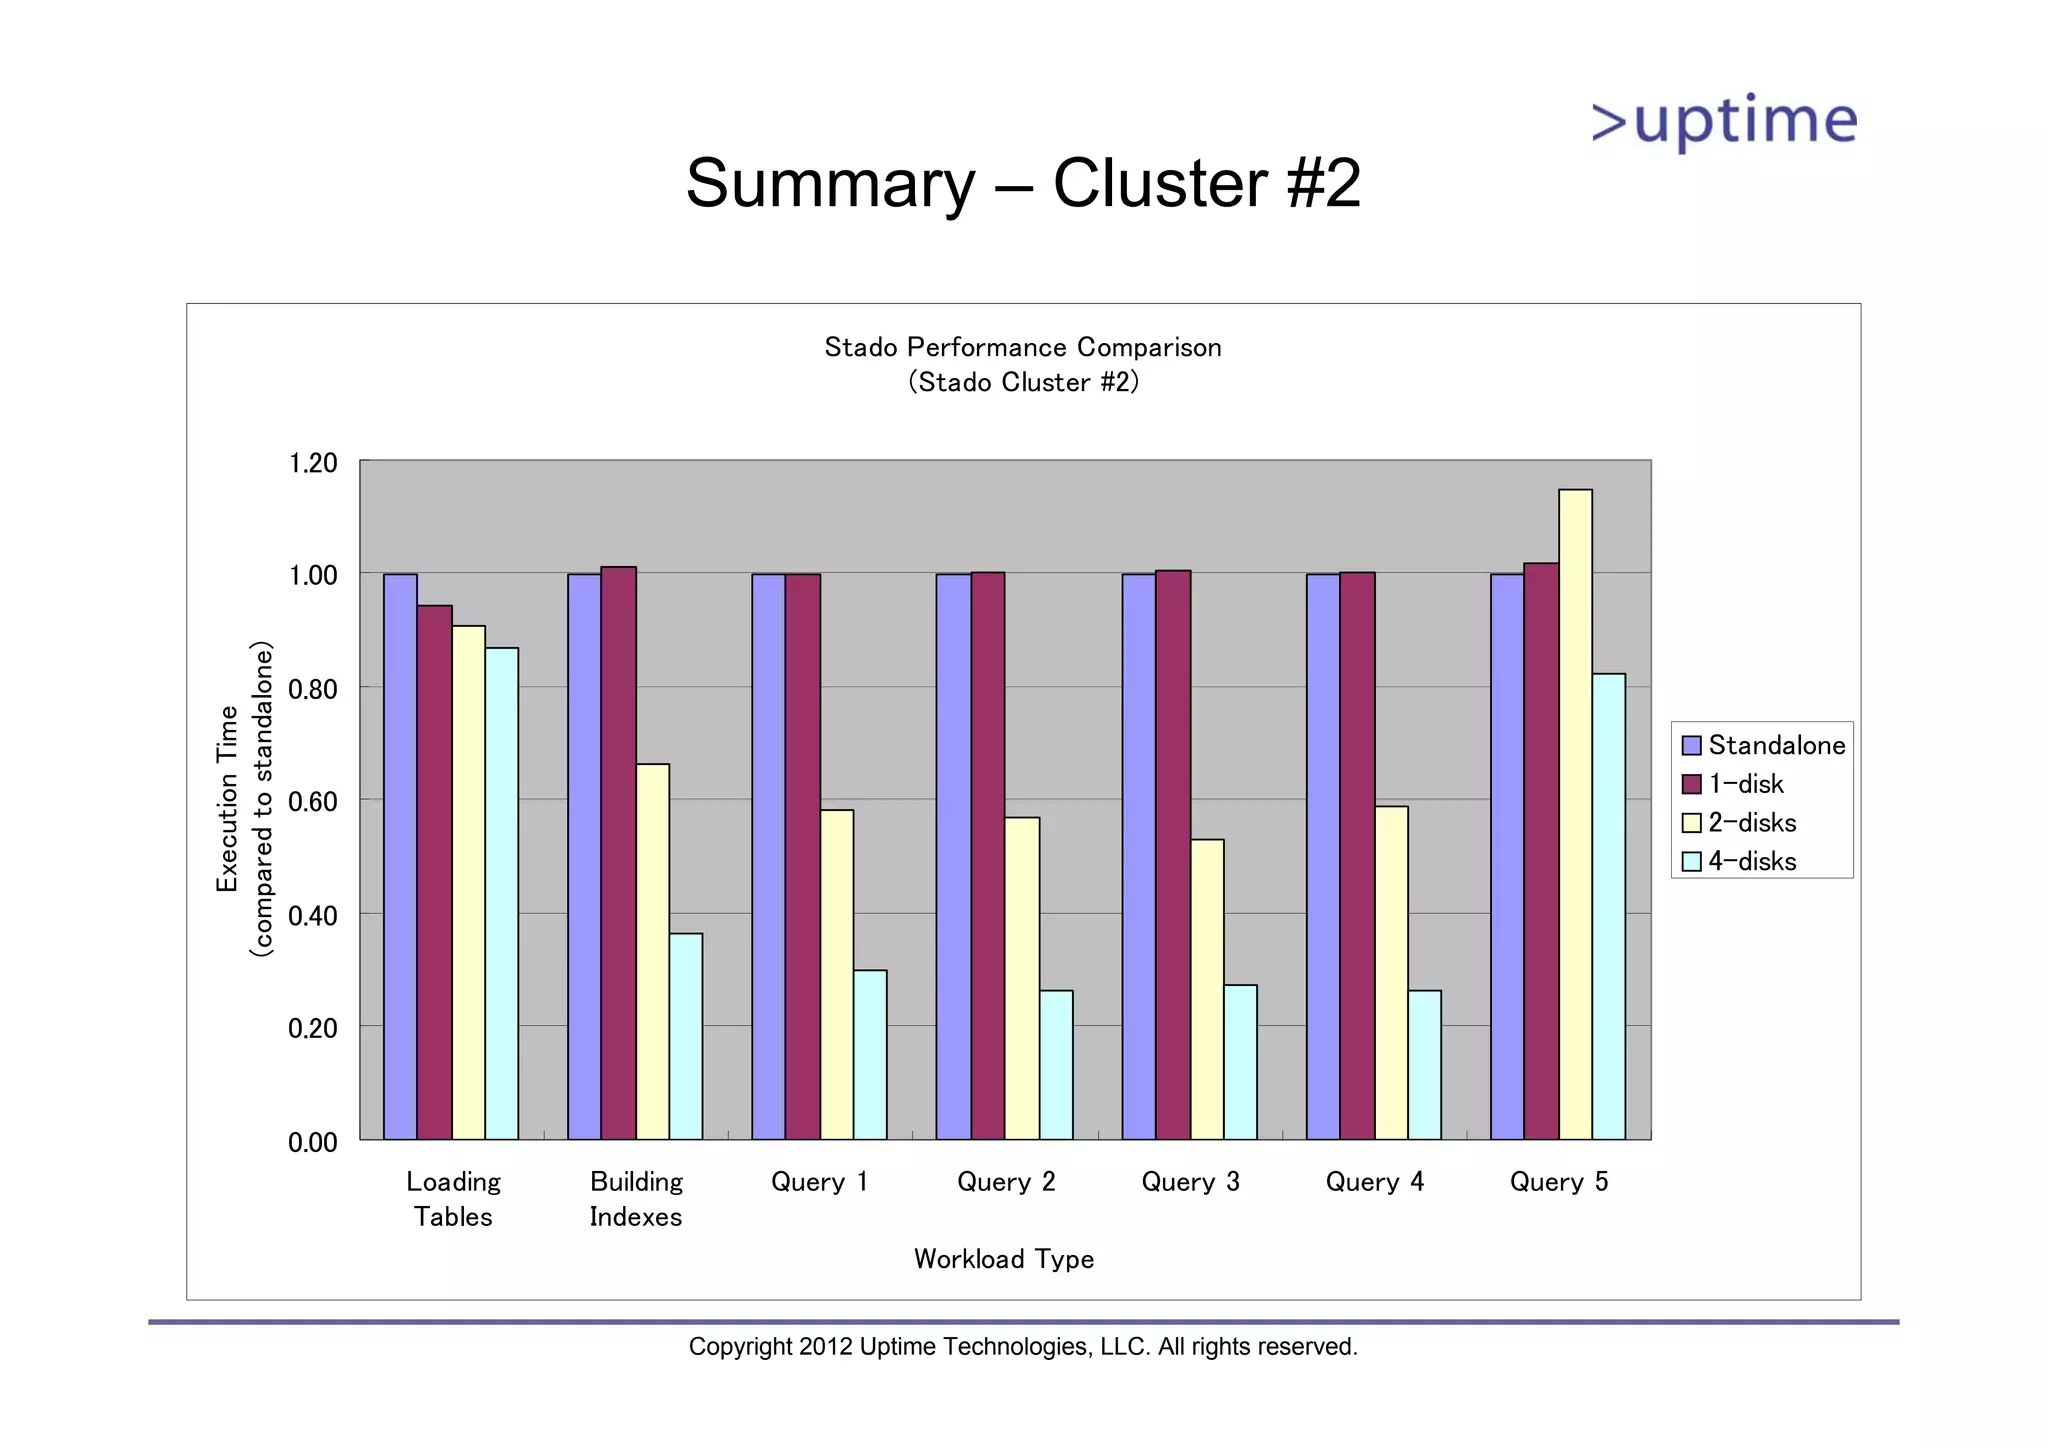
Summary – Cluster#2 Stado Performance Comparison (Stado Cluster #2) 1.20 1.00 (compared to standalone) 0.80 Execution Time Standalone 1-disk 0.60 2-disks 4-disks 0.40 0.20 0.00 Loading Building Query 1 Query 2 Query 3 Query 4 Query 5 Tables Indexes Workload Type Copyright 2012 Uptime Technologies, LLC. All rights reserved.
46.
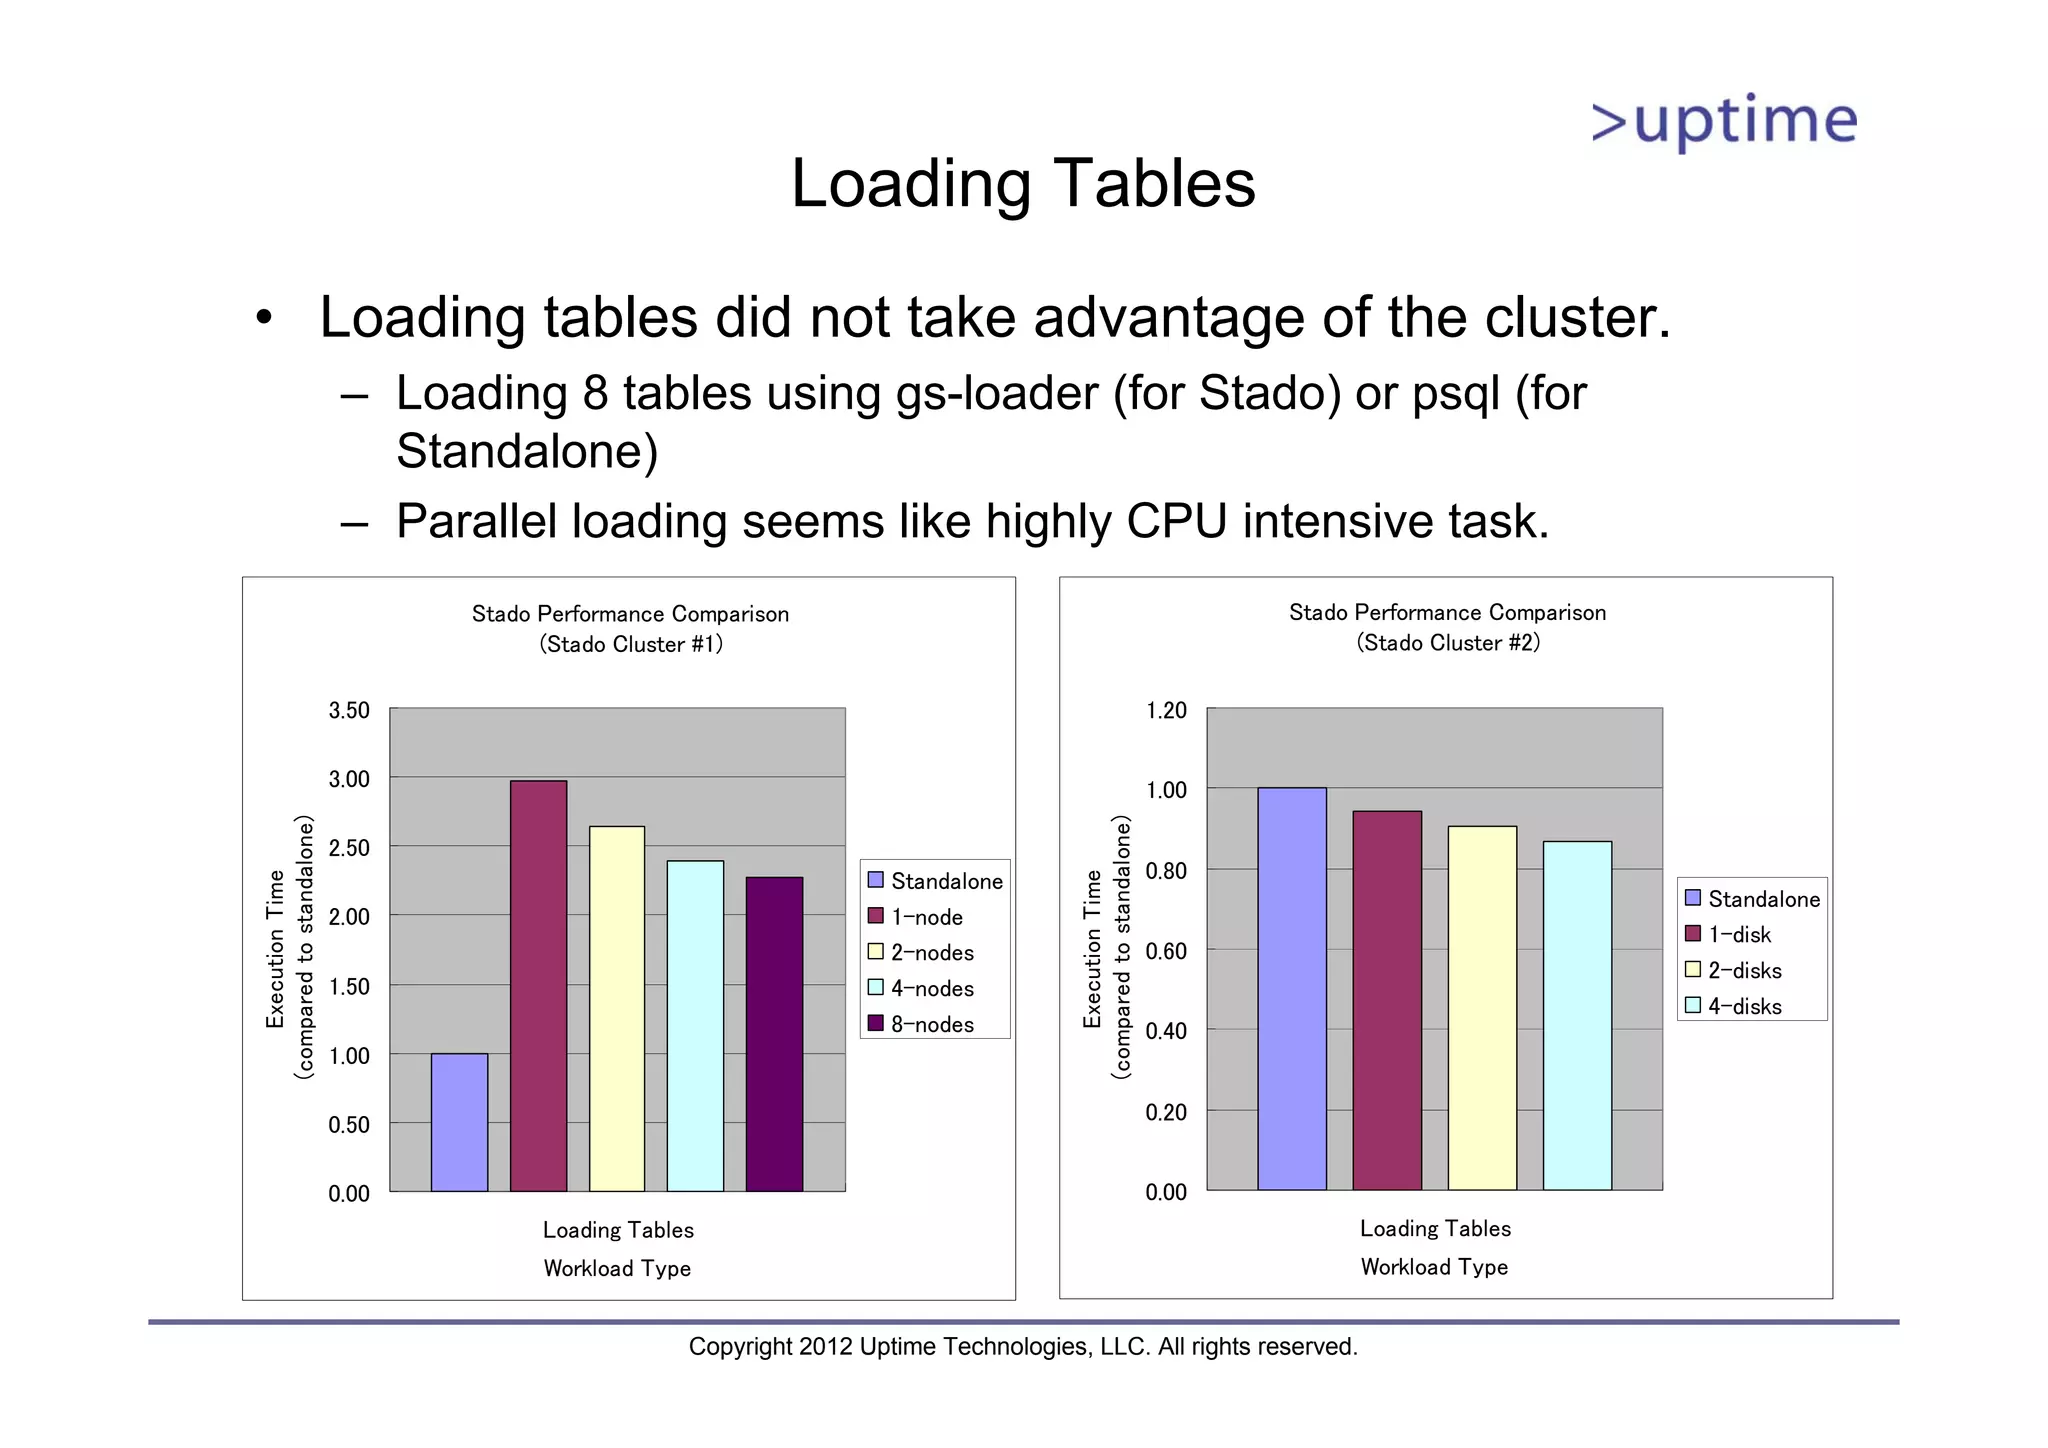
Loading Tables • Loadingtables did not take advantage of the cluster. – Loading 8 tables using gs-loader (for Stado) or psql (for Standalone) – Parallel loading seems like highly CPU intensive task. Stado Performance Comparison Stado Performance Comparison (Stado Cluster #1) (Stado Cluster #2) 3.50 1.20 3.00 1.00 (compared to standalone) (compared to standalone) 2.50 Standalone 0.80 Execution Time Execution Time Standalone 2.00 1-node 1-disk 2-nodes 0.60 2-disks 1.50 4-nodes 4-disks 8-nodes 0.40 1.00 0.20 0.50 0.00 0.00 Loading Tables Loading Tables Workload Type Workload Type Copyright 2012 Uptime Technologies, LLC. All rights reserved.
47.
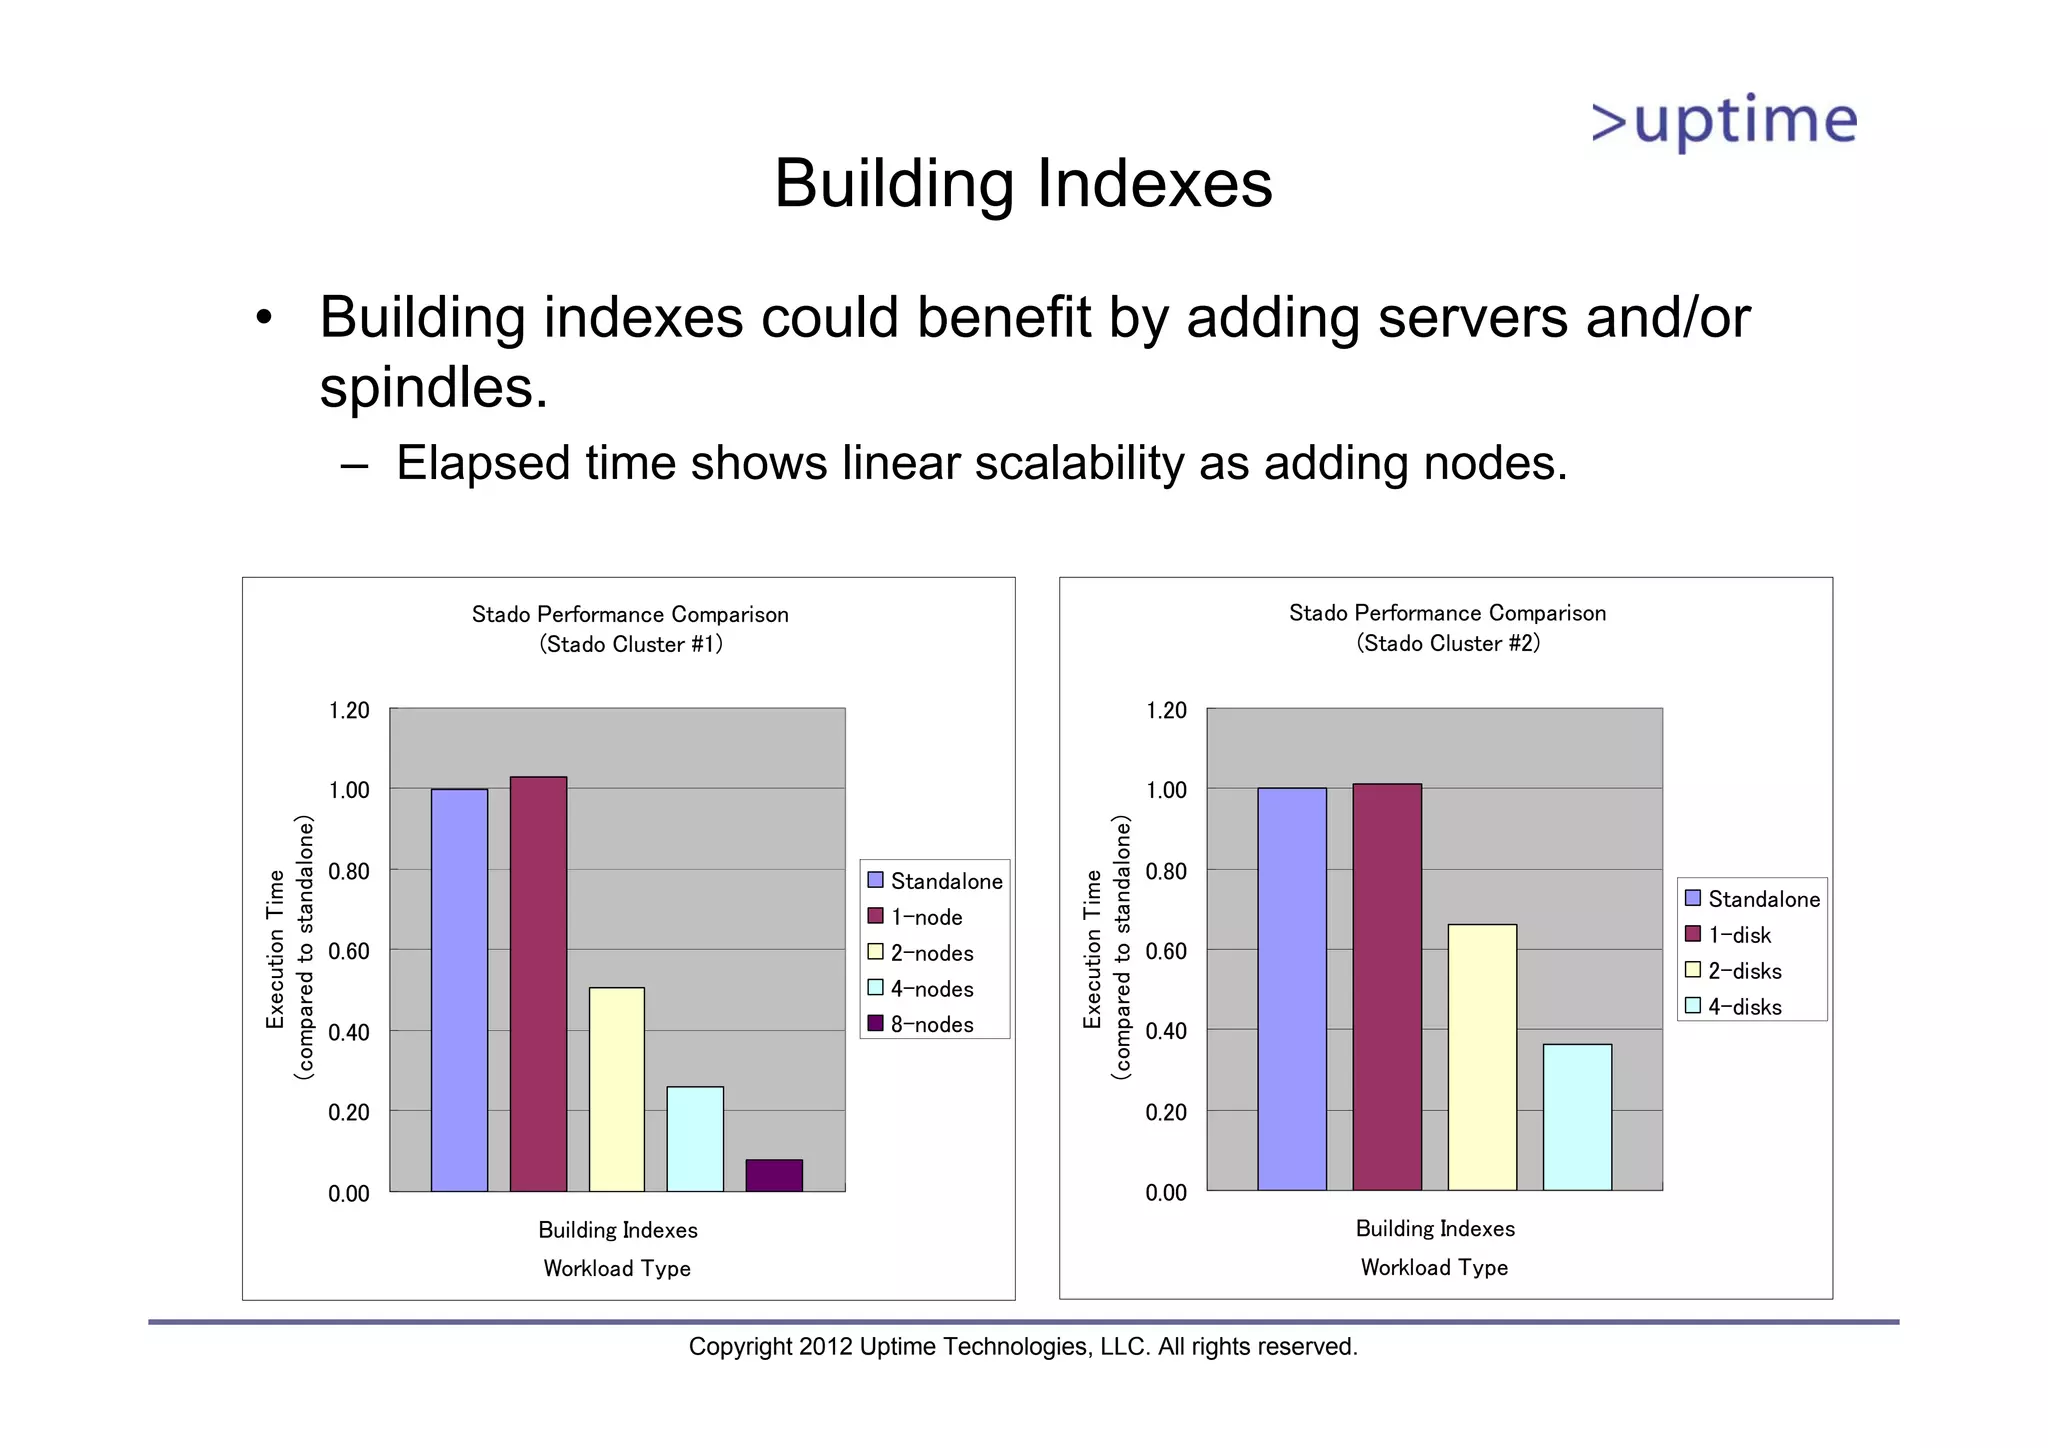
Building Indexes • Buildingindexes could benefit by adding servers and/or spindles. – Elapsed time shows linear scalability as adding nodes. Stado Performance Comparison Stado Performance Comparison (Stado Cluster #1) (Stado Cluster #2) 1.20 1.20 1.00 1.00 (compared to standalone) (compared to standalone) 0.80 Standalone 0.80 Execution Time Execution Time Standalone 1-node 1-disk 0.60 2-nodes 0.60 2-disks 4-nodes 4-disks 0.40 8-nodes 0.40 0.20 0.20 0.00 0.00 Building Indexes Building Indexes Workload Type Workload Type Copyright 2012 Uptime Technologies, LLC. All rights reserved.
48.
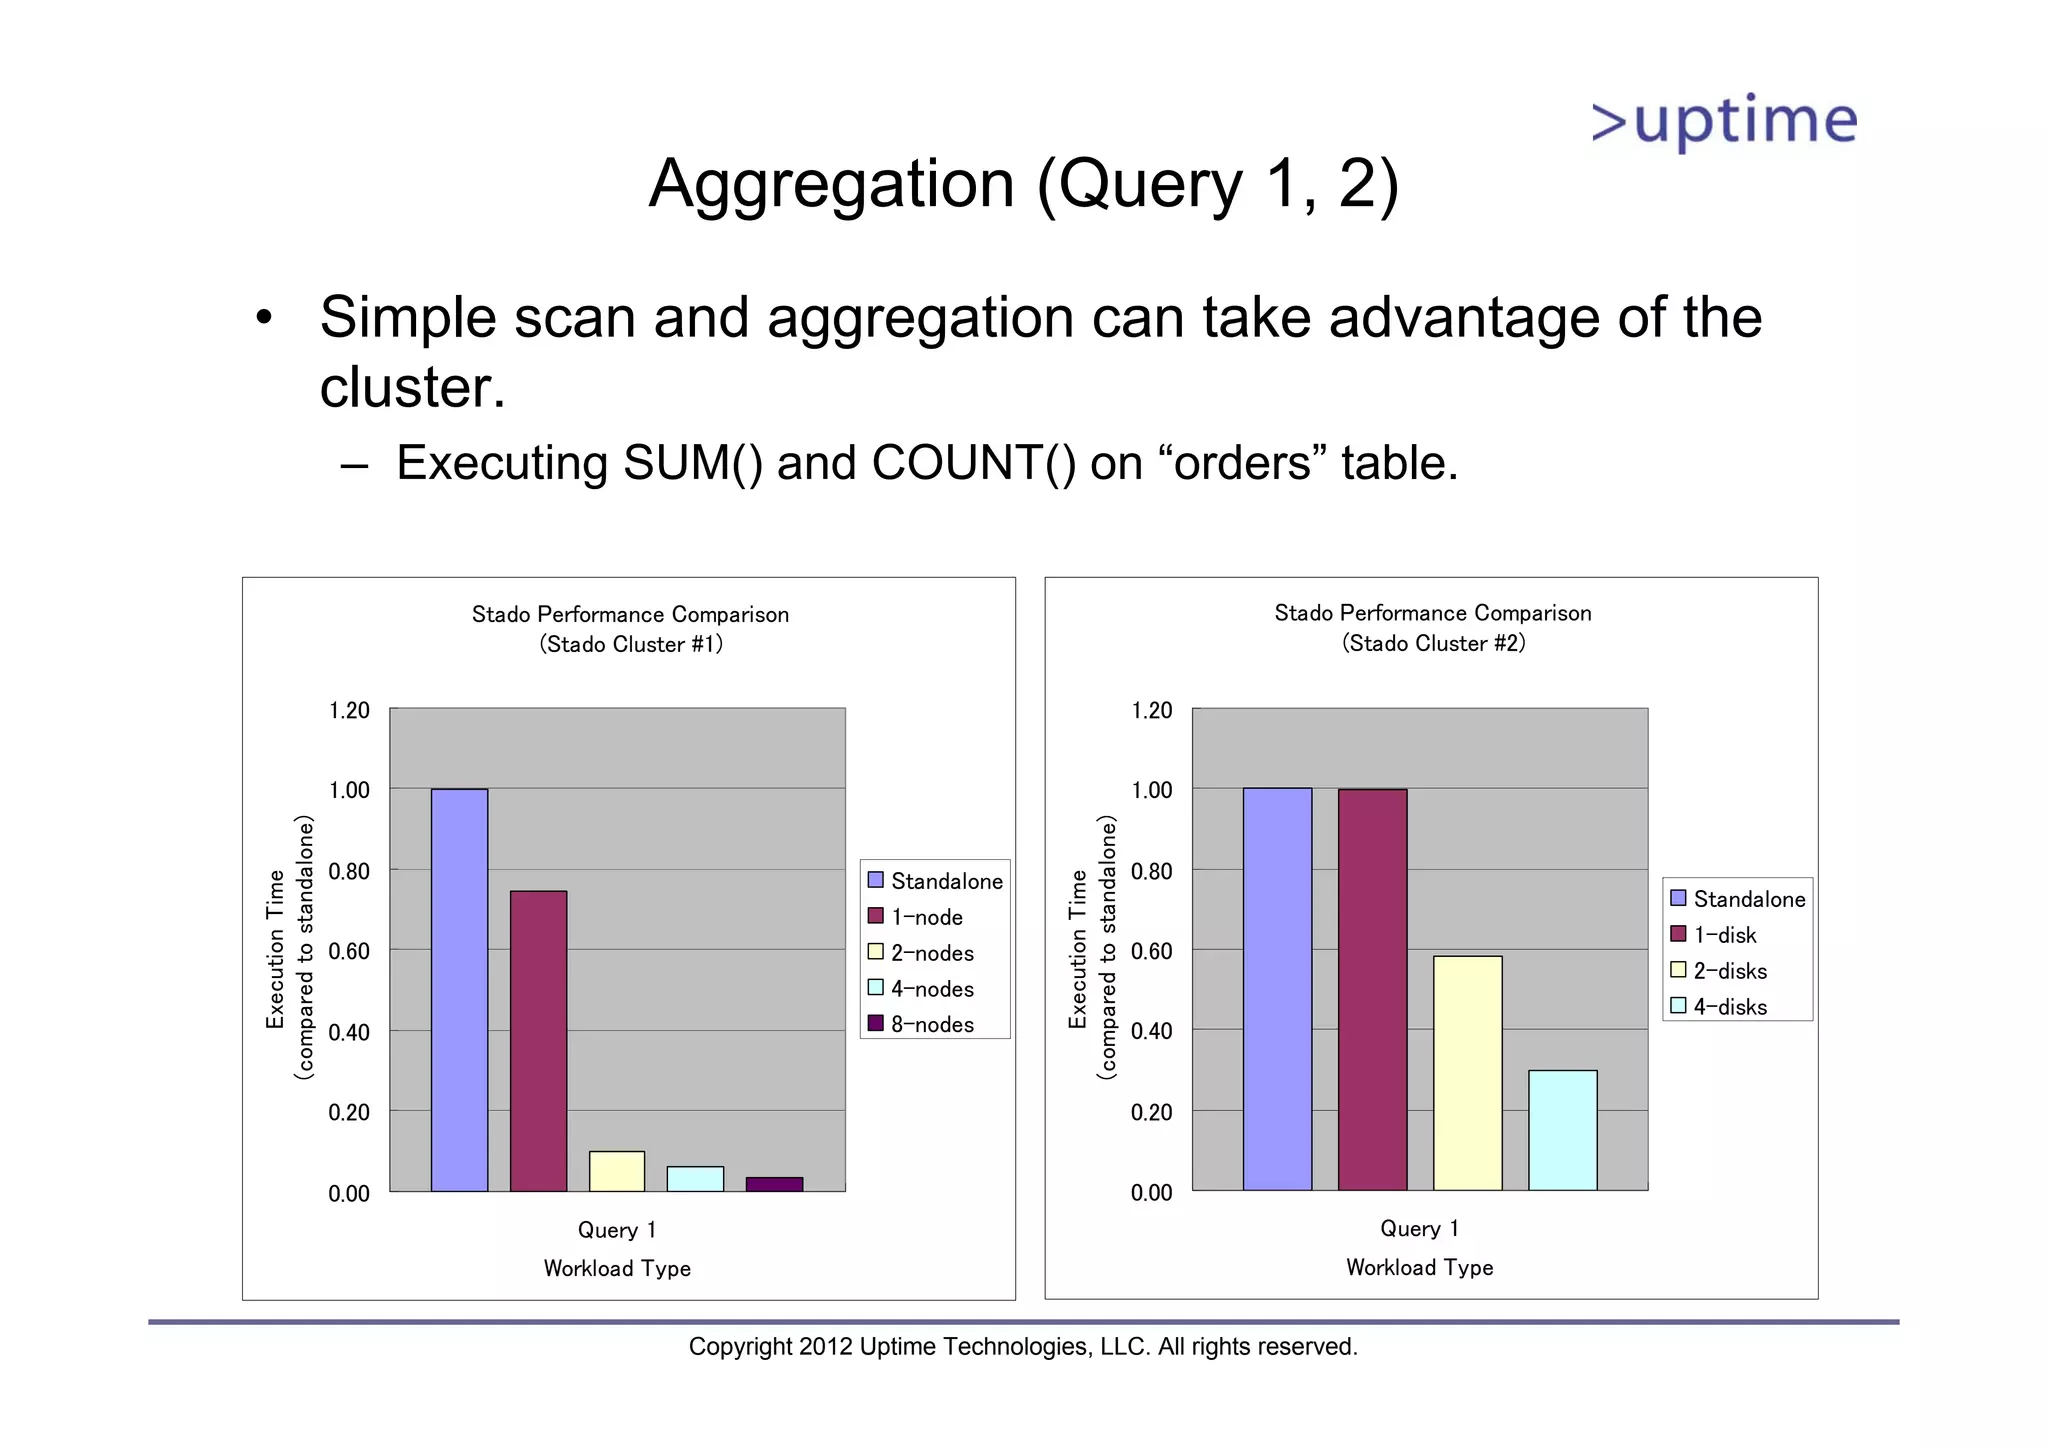
Aggregation (Query 1,2) • Simple scan and aggregation can take advantage of the cluster. – Executing SUM() and COUNT() on “orders” table. Stado Performance Comparison Stado Performance Comparison (Stado Cluster #1) (Stado Cluster #2) 1.20 1.20 1.00 1.00 (compared to standalone) (compared to standalone) 0.80 Standalone 0.80 Execution Time Execution Time Standalone 1-node 1-disk 0.60 2-nodes 0.60 2-disks 4-nodes 4-disks 0.40 8-nodes 0.40 0.20 0.20 0.00 0.00 Query 1 Query 1 Workload Type Workload Type Copyright 2012 Uptime Technologies, LLC. All rights reserved.
49.
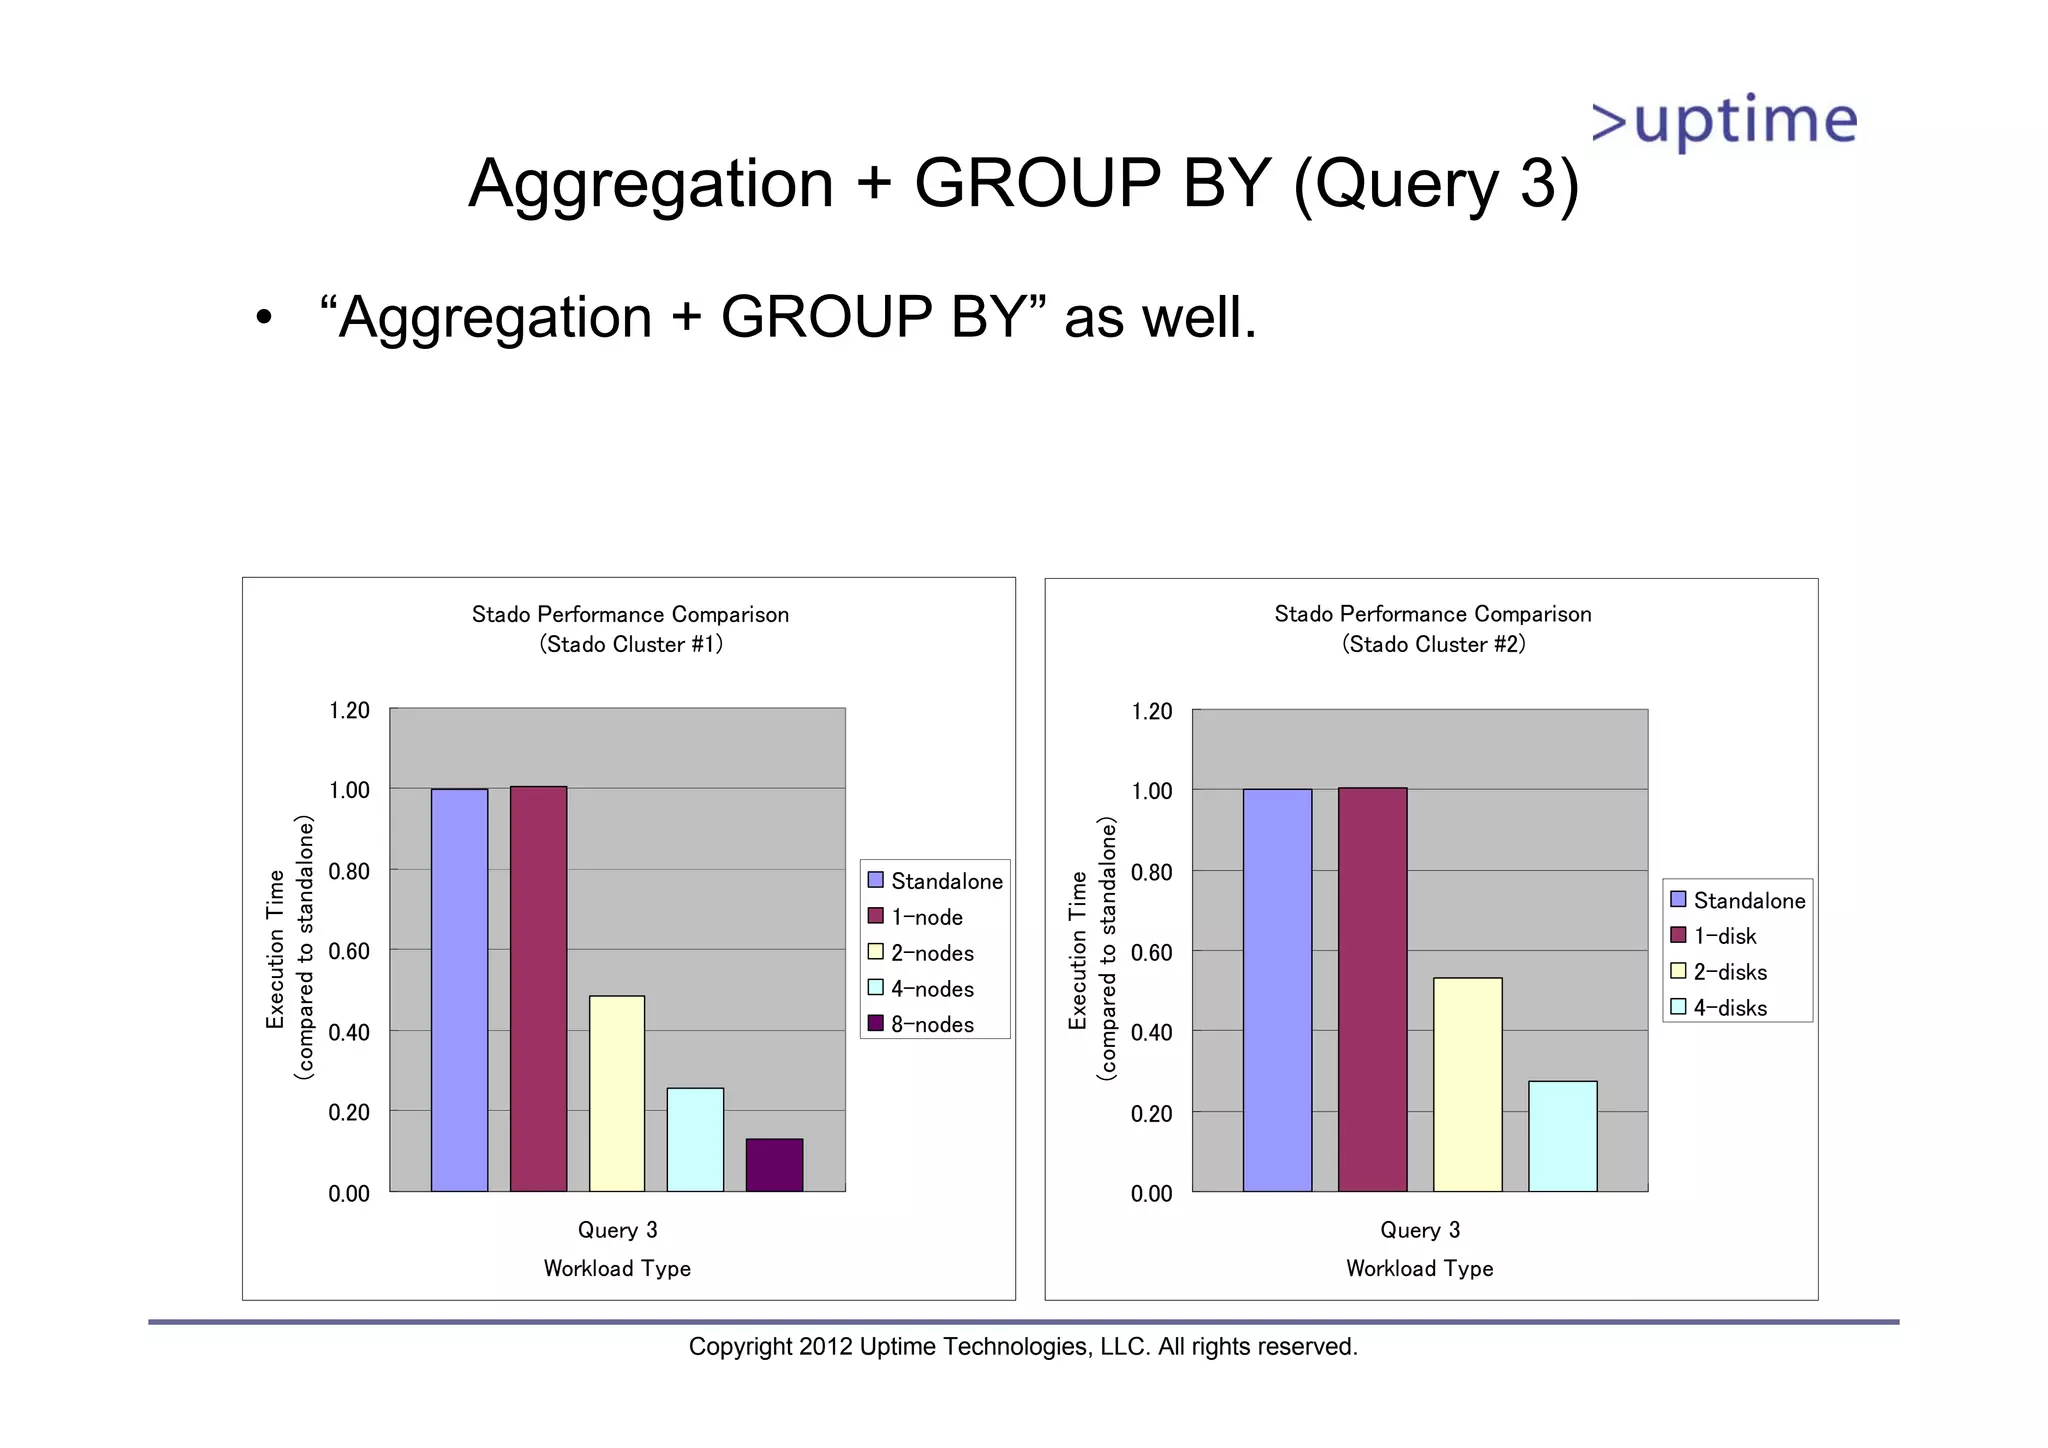
Aggregation + GROUPBY (Query 3) • “Aggregation + GROUP BY” as well. Stado Performance Comparison Stado Performance Comparison (Stado Cluster #1) (Stado Cluster #2) 1.20 1.20 1.00 1.00 (compared to standalone) (compared to standalone) 0.80 Standalone 0.80 Execution Time Execution Time Standalone 1-node 1-disk 0.60 2-nodes 0.60 2-disks 4-nodes 4-disks 0.40 8-nodes 0.40 0.20 0.20 0.00 0.00 Query 3 Query 3 Workload Type Workload Type Copyright 2012 Uptime Technologies, LLC. All rights reserved.
50.
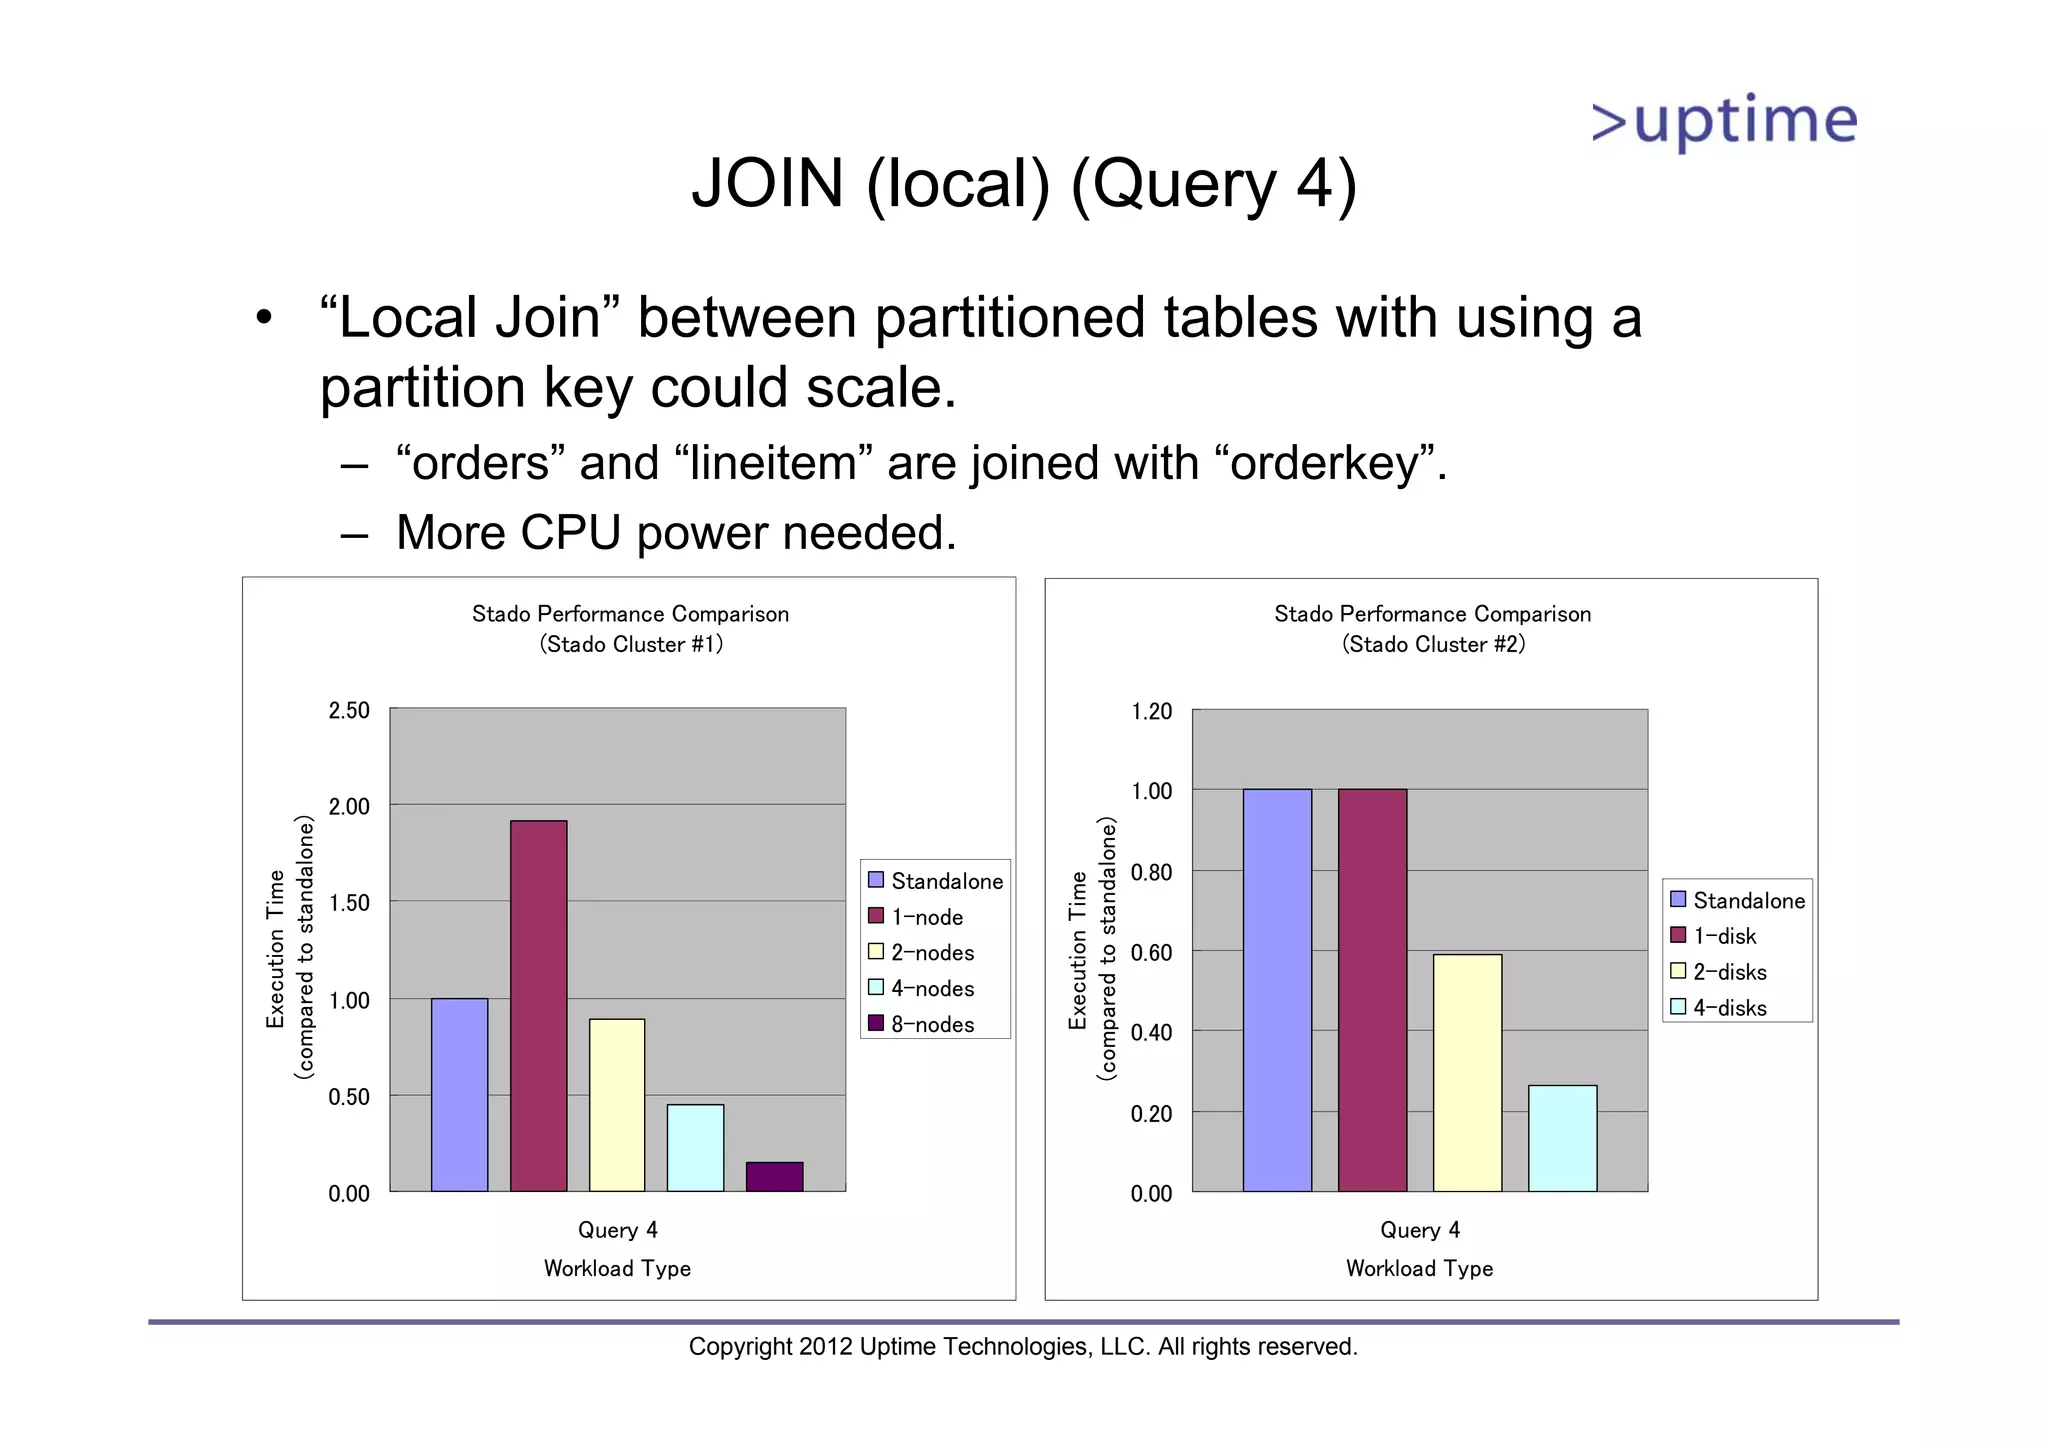
JOIN (local) (Query4) • “Local Join” between partitioned tables with using a partition key could scale. – “orders” and “lineitem” are joined with “orderkey”. – More CPU power needed. Stado Performance Comparison Stado Performance Comparison (Stado Cluster #1) (Stado Cluster #2) 2.50 1.20 1.00 2.00 (compared to standalone) (compared to standalone) Standalone 0.80 Execution Time Execution Time 1.50 Standalone 1-node 1-disk 2-nodes 0.60 2-disks 4-nodes 1.00 4-disks 8-nodes 0.40 0.50 0.20 0.00 0.00 Query 4 Query 4 Workload Type Workload Type Copyright 2012 Uptime Technologies, LLC. All rights reserved.
51.
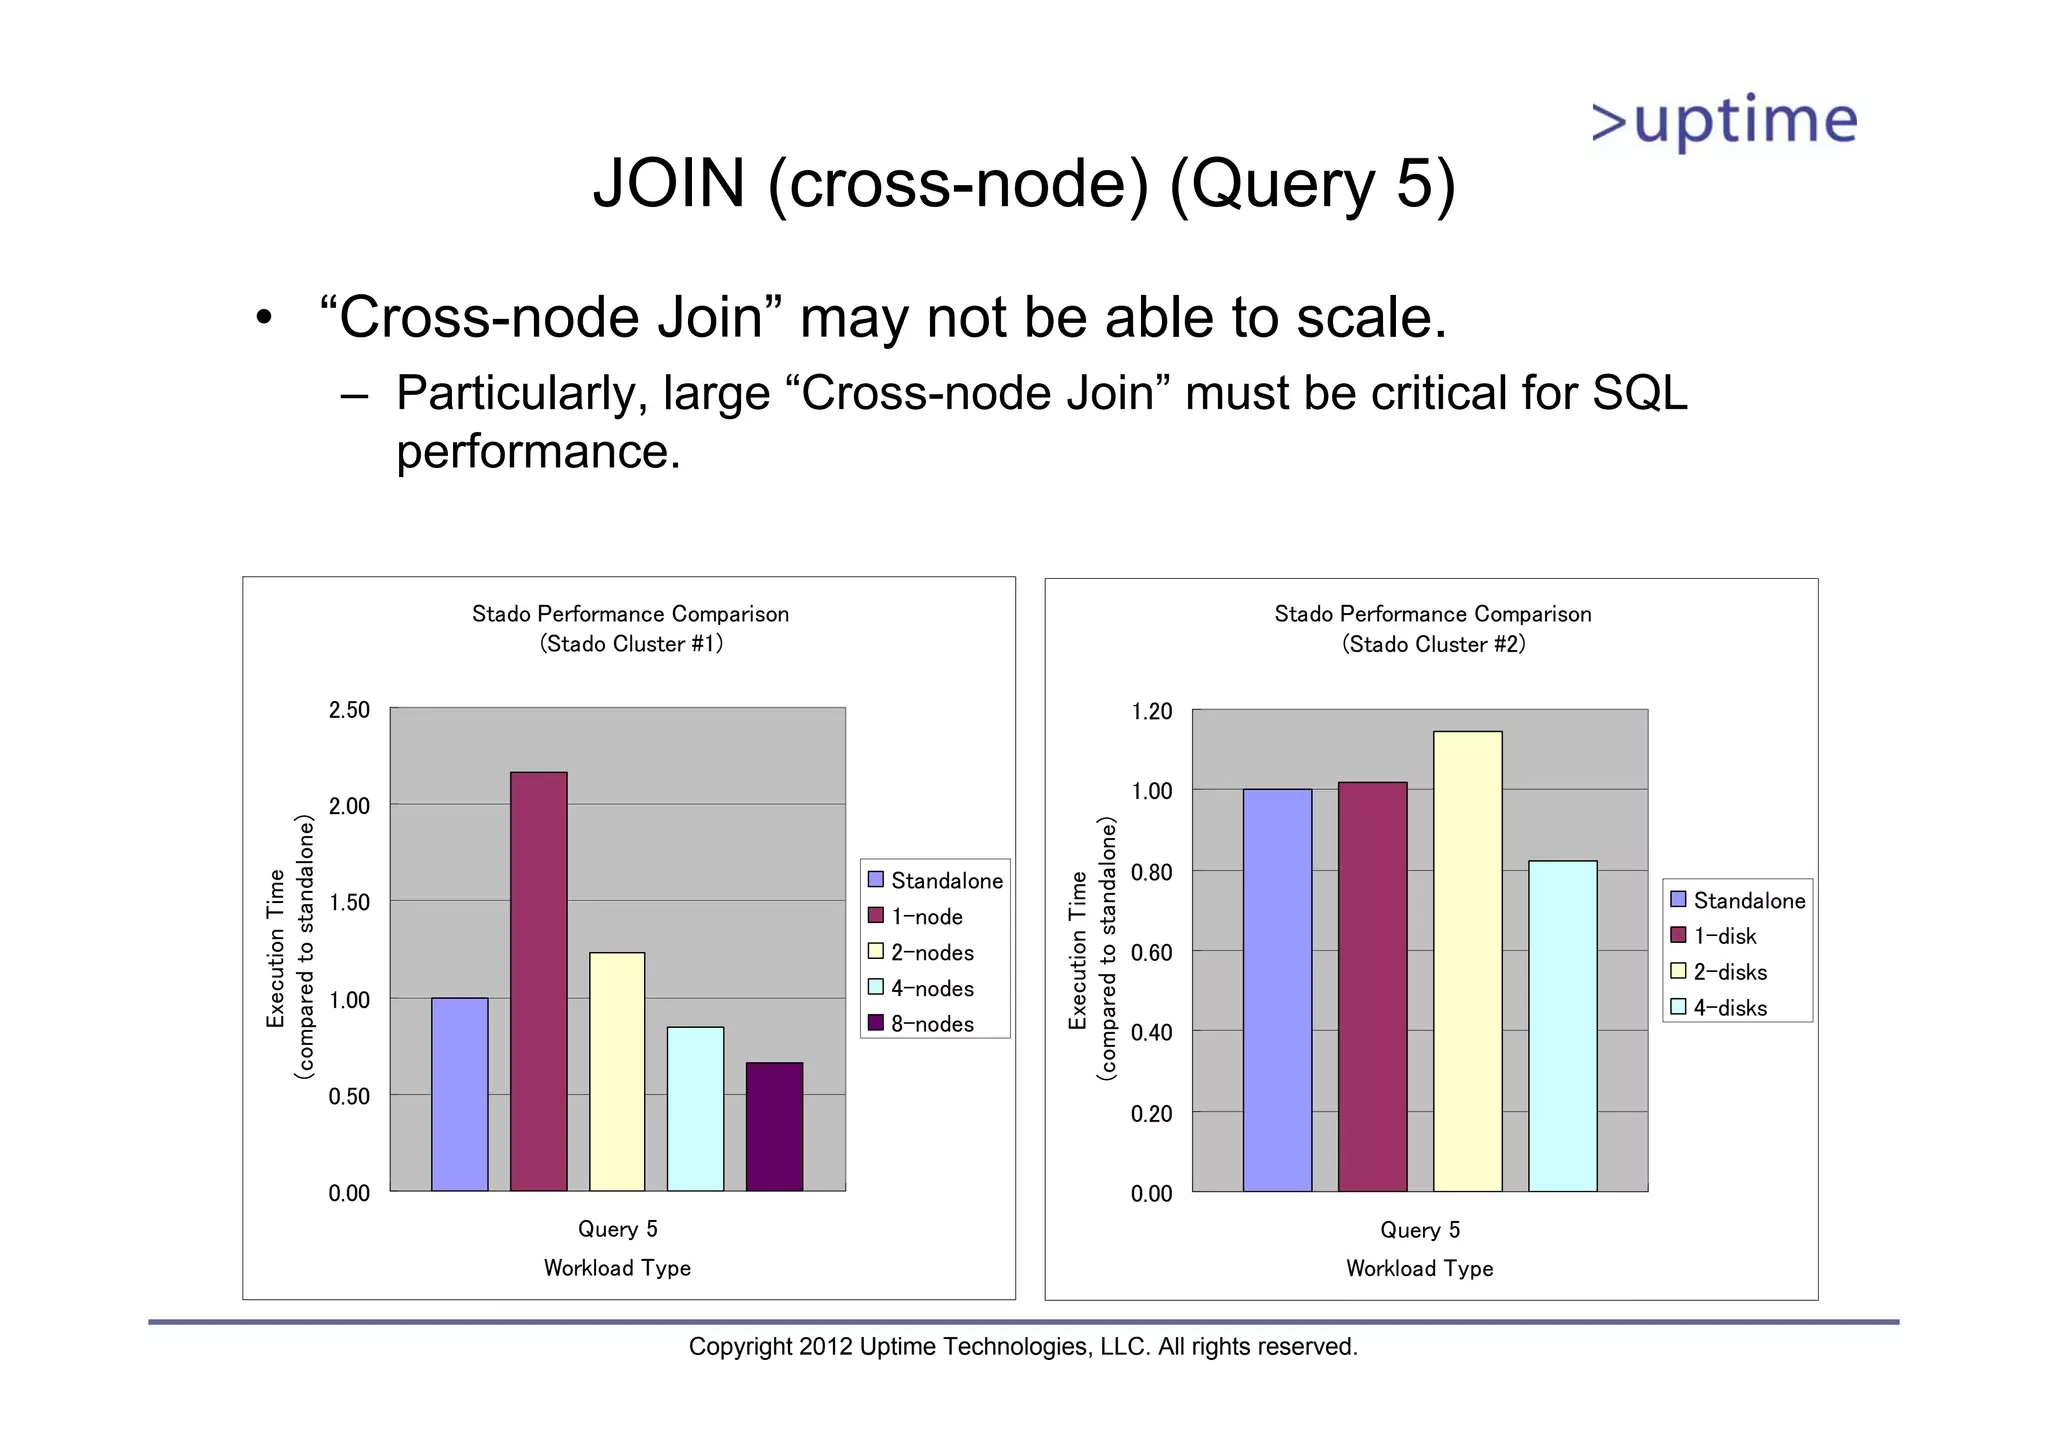
JOIN (cross-node) (Query5) • “Cross-node Join” may not be able to scale. – Particularly, large “Cross-node Join” must be critical for SQL performance. Stado Performance Comparison Stado Performance Comparison (Stado Cluster #1) (Stado Cluster #2) 2.50 1.20 1.00 2.00 (compared to standalone) (compared to standalone) Standalone 0.80 Execution Time Execution Time 1.50 Standalone 1-node 1-disk 2-nodes 0.60 2-disks 1.00 4-nodes 4-disks 8-nodes 0.40 0.50 0.20 0.00 0.00 Query 5 Query 5 Workload Type Workload Type Copyright 2012 Uptime Technologies, LLC. All rights reserved.
52.
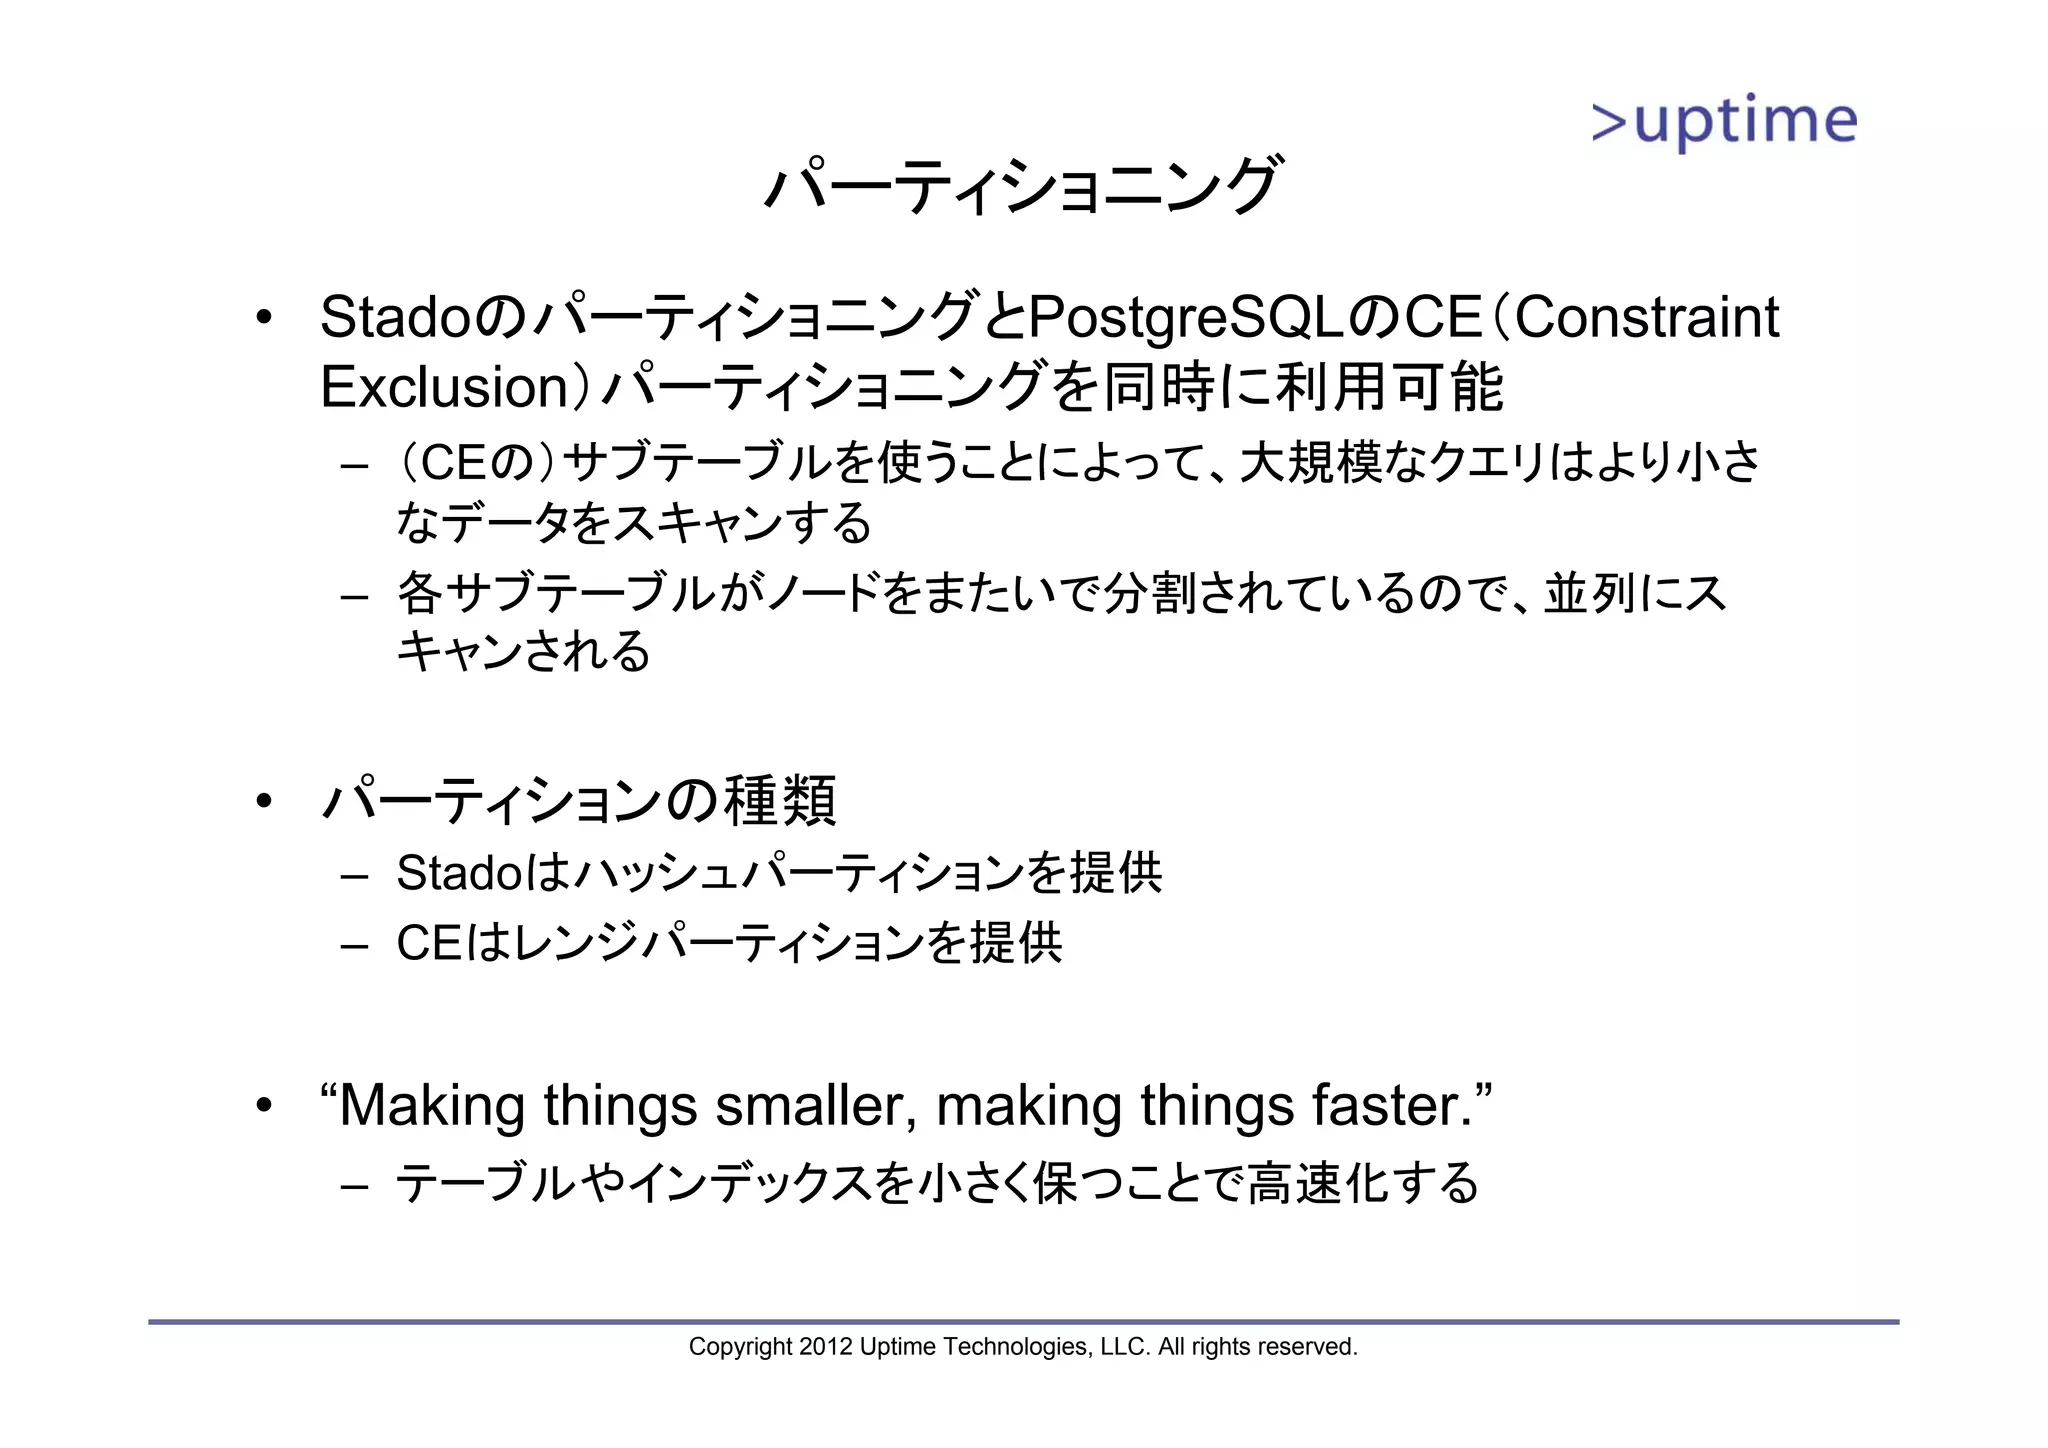
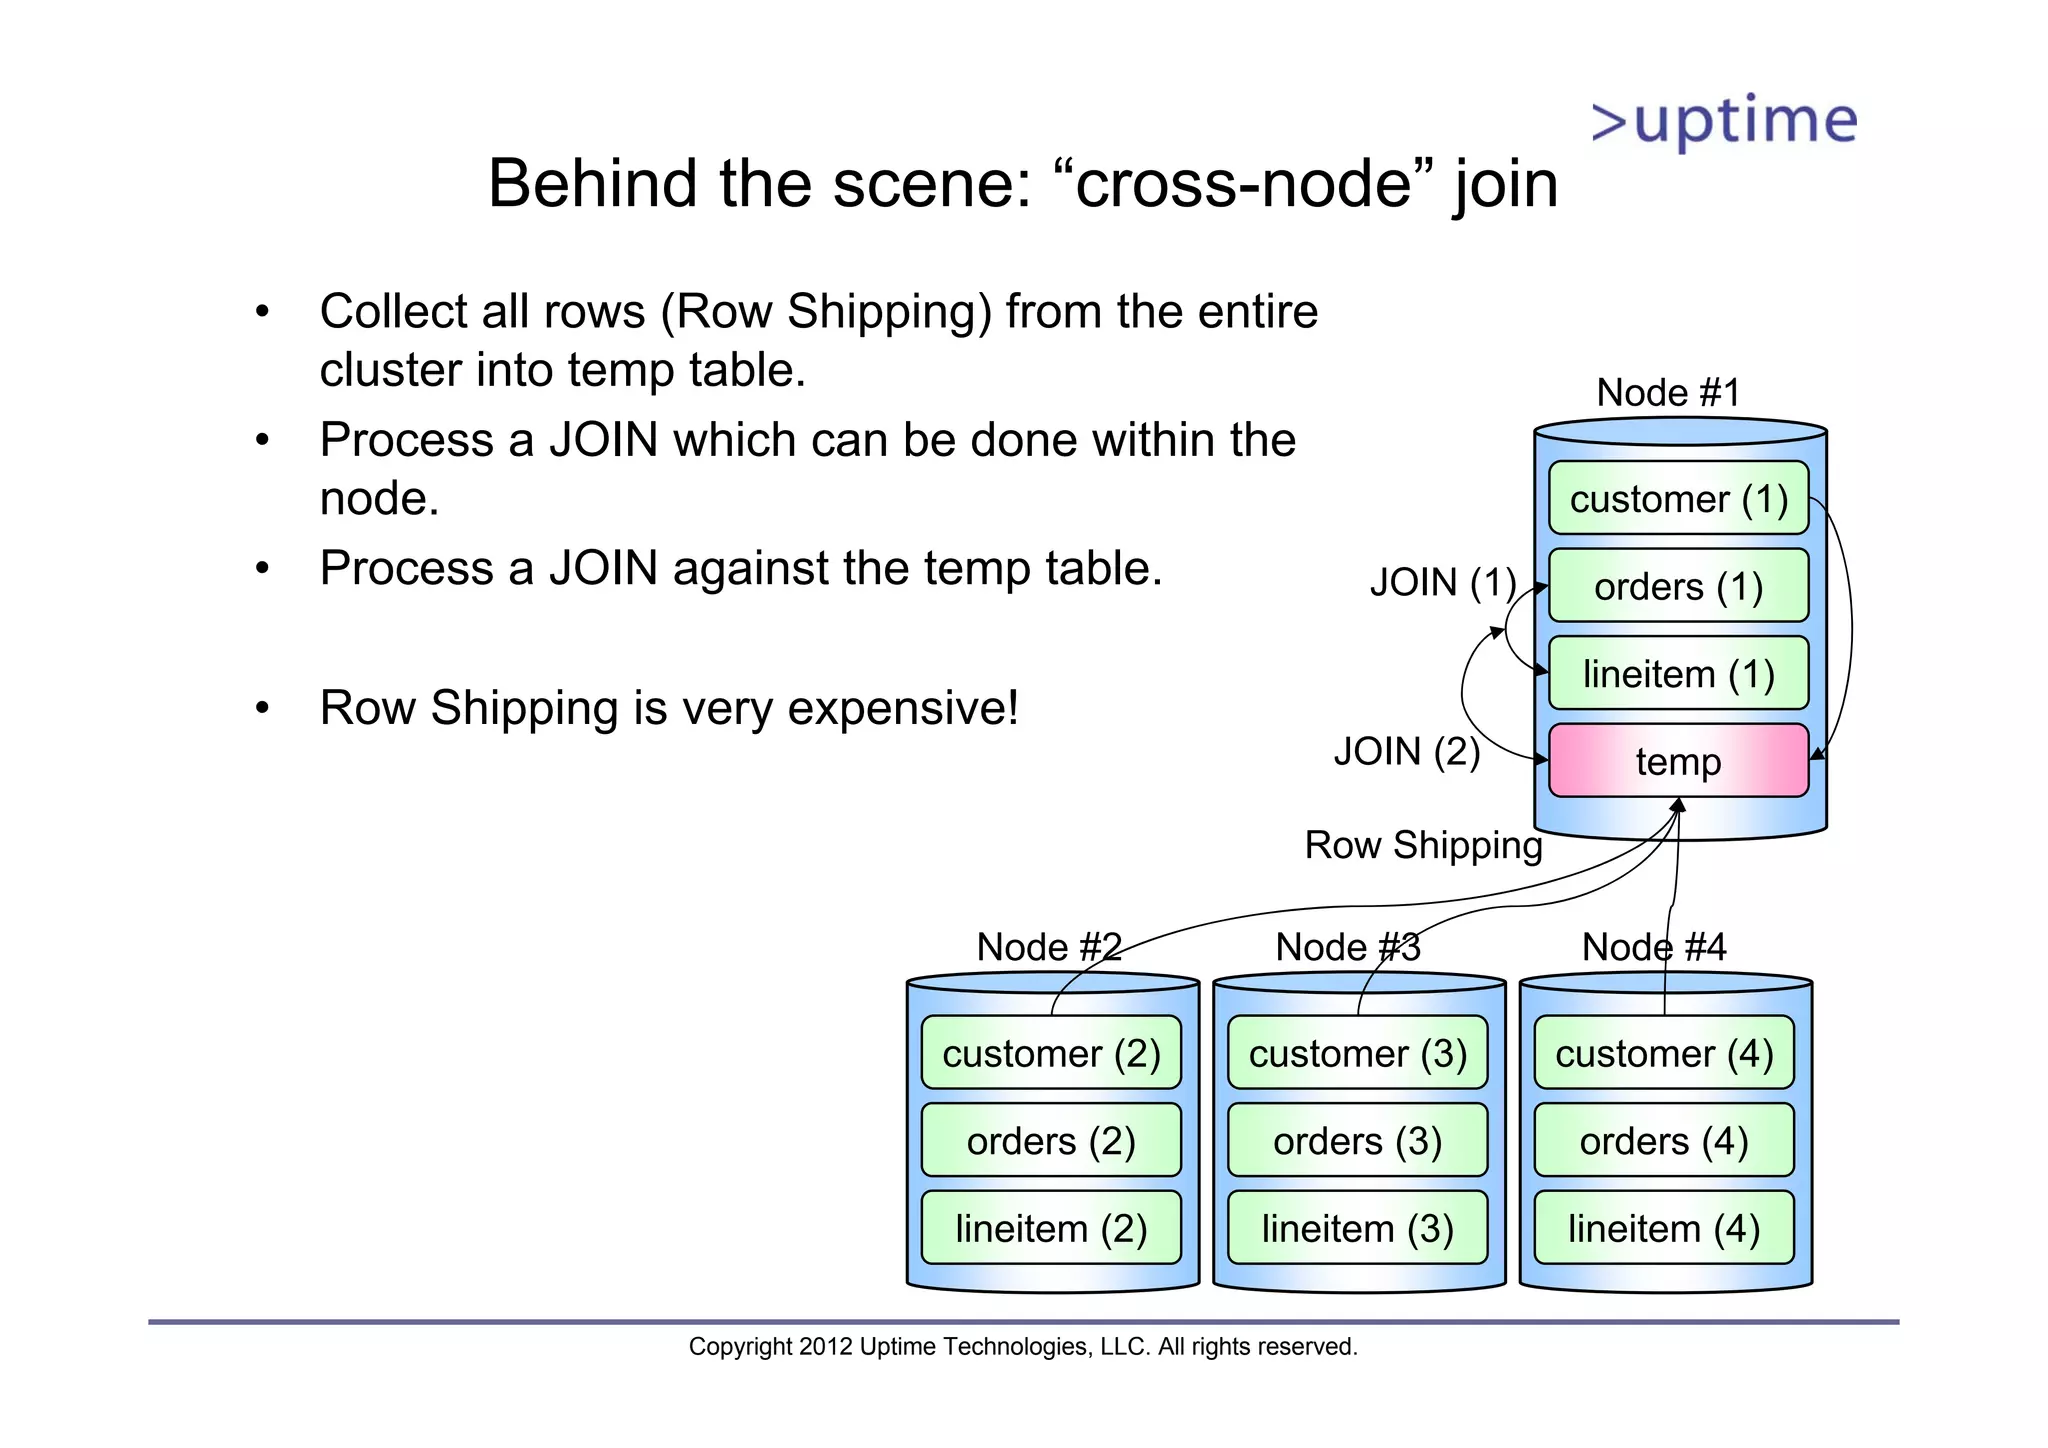
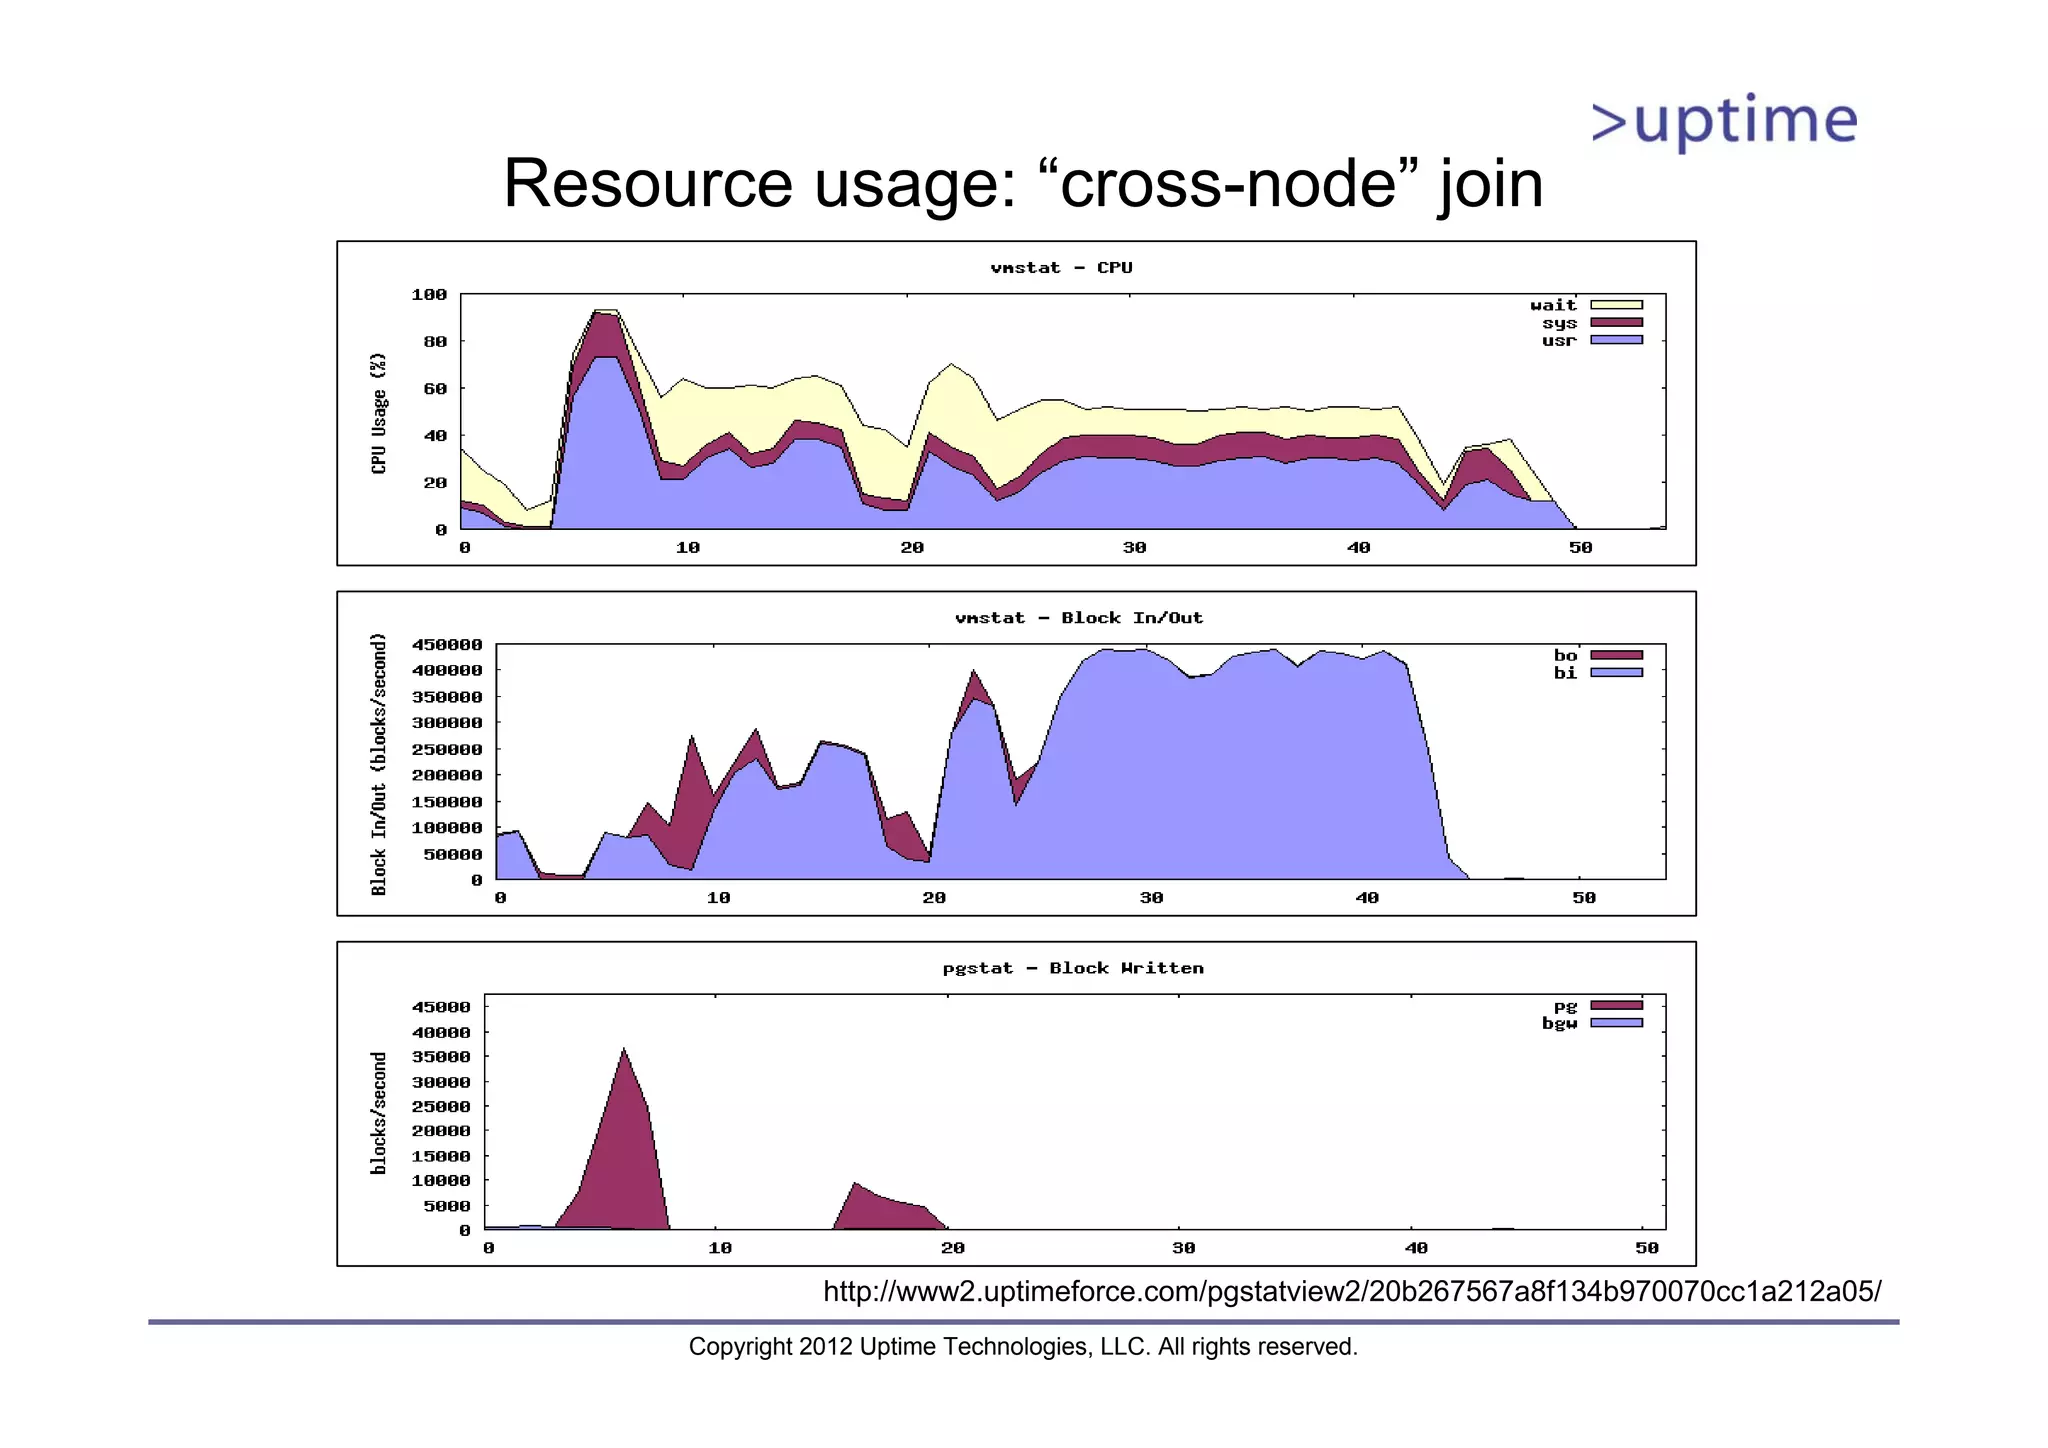
Behind the scene:“cross-node” join • Collect all rows (Row Shipping) from the entire cluster into temp table. Node #1 • Process a JOIN which can be done within the node. customer (1) • Process a JOIN against the temp table. JOIN (1) orders (1) lineitem (1) • Row Shipping is very expensive! JOIN (2) temp Row Shipping Node #2 Node #3 Node #4 customer (2) customer (3) customer (4) orders (2) orders (3) orders (4) lineitem (2) lineitem (3) lineitem (4) Copyright 2012 Uptime Technologies, LLC. All rights reserved.
53.
Resource usage: “cross-node”join http://www2.uptimeforce.com/pgstatview2/20b267567a8f134b970070cc1a212a05/ Copyright 2012 Uptime Technologies, LLC. All rights reserved.
54.
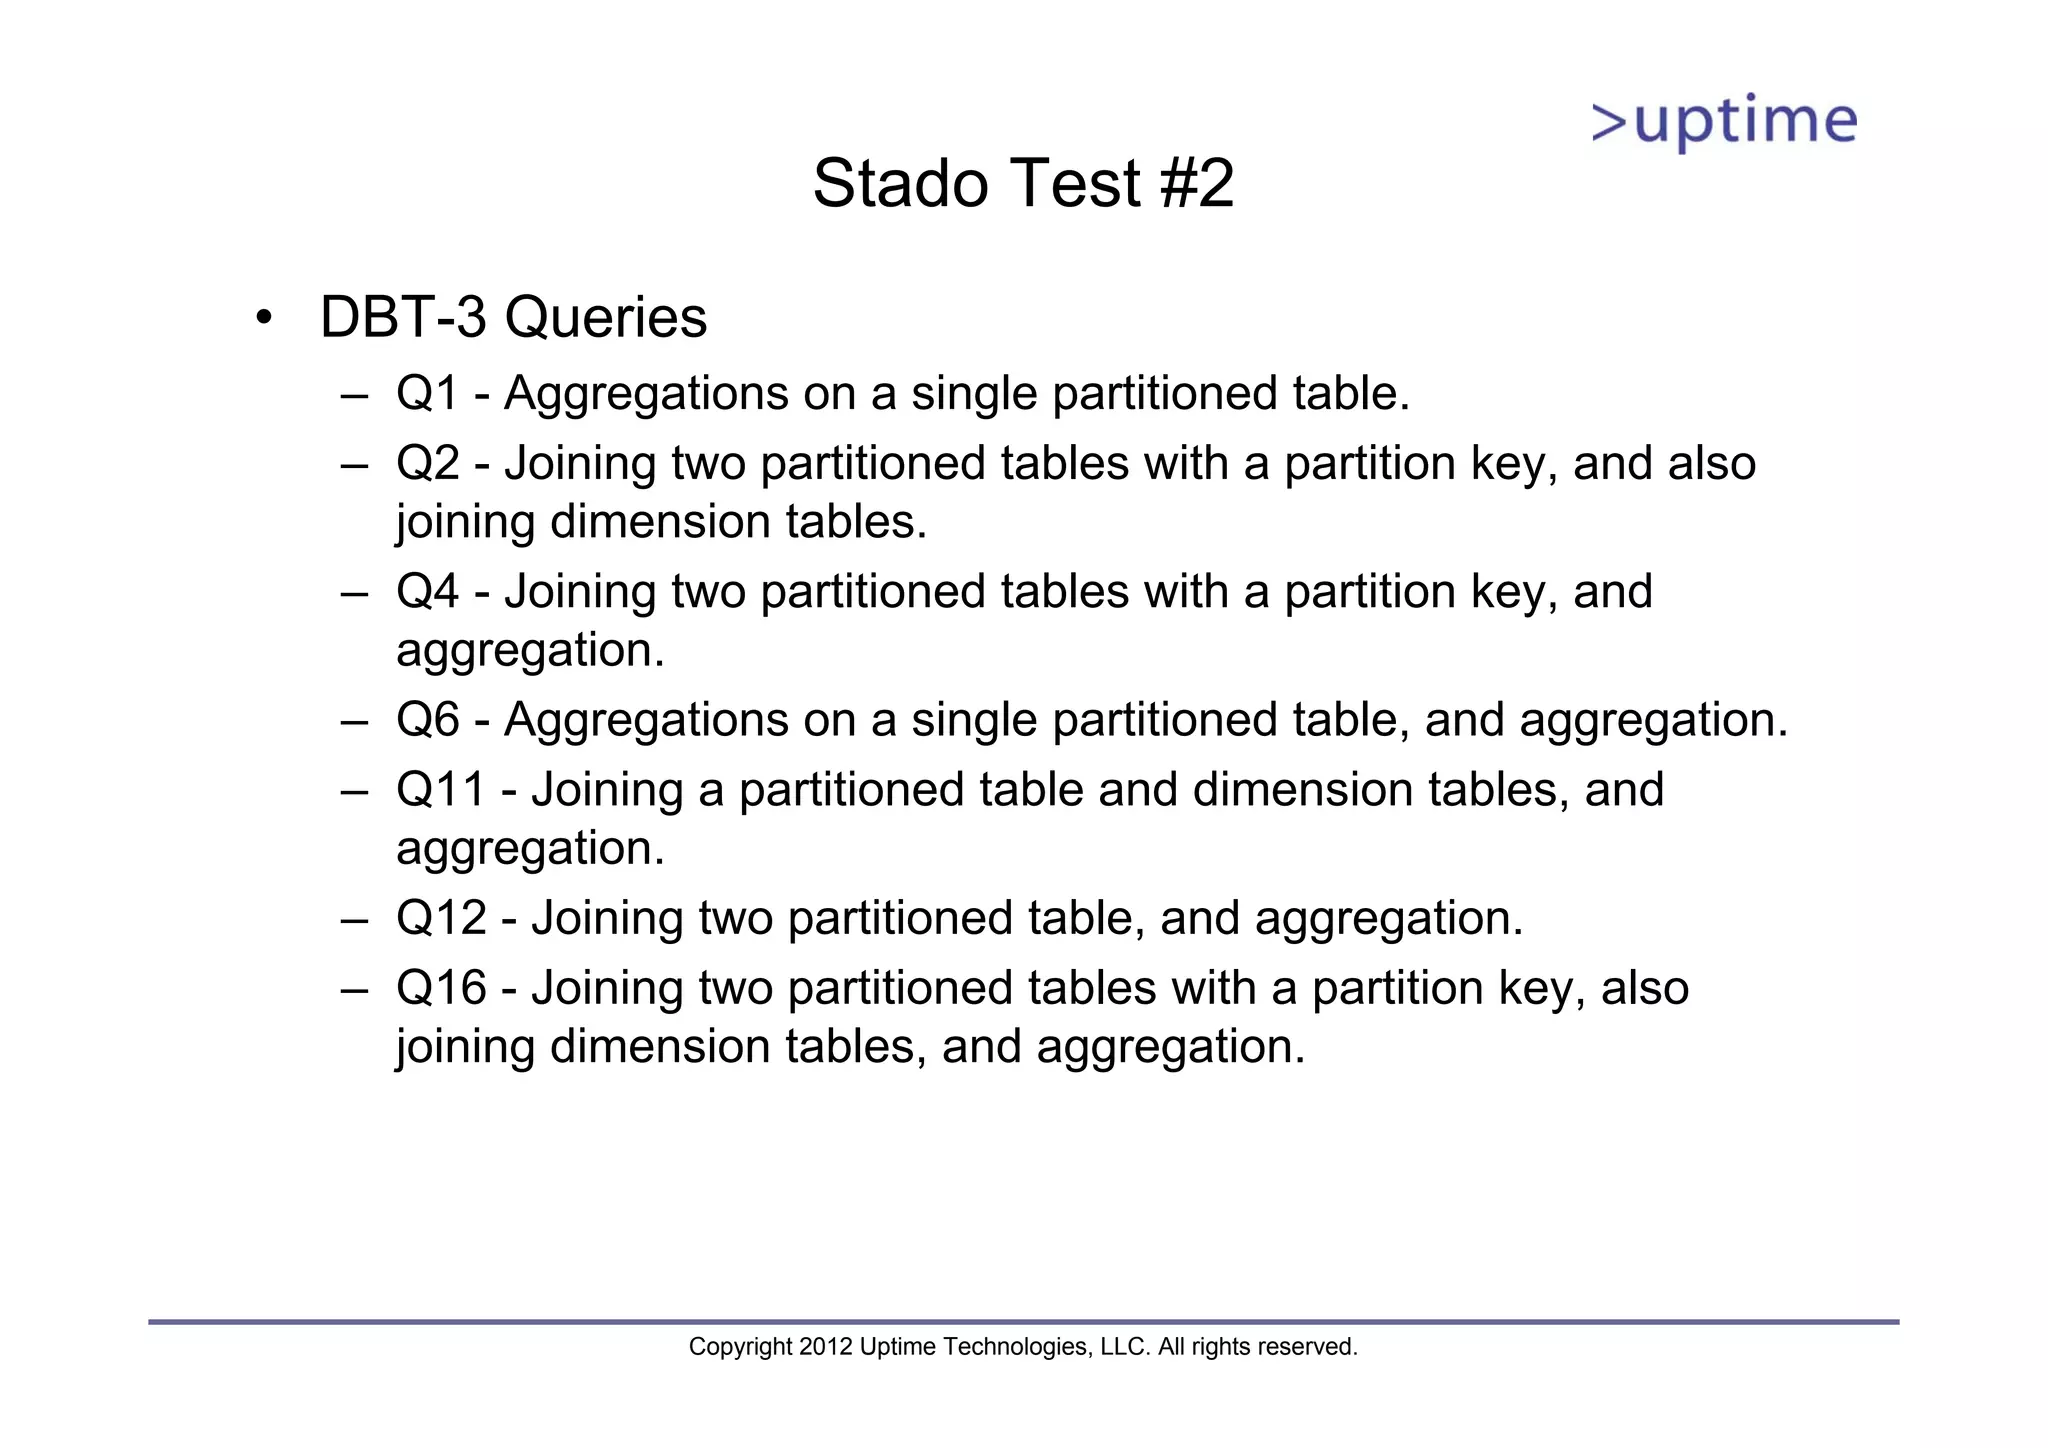
Stado Test #2 •DBT-3 Queries – Q1 - Aggregations on a single partitioned table. – Q2 - Joining two partitioned tables with a partition key, and also joining dimension tables. – Q4 - Joining two partitioned tables with a partition key, and aggregation. – Q6 - Aggregations on a single partitioned table, and aggregation. – Q11 - Joining a partitioned table and dimension tables, and aggregation. – Q12 - Joining two partitioned table, and aggregation. – Q16 - Joining two partitioned tables with a partition key, also joining dimension tables, and aggregation. Copyright 2012 Uptime Technologies, LLC. All rights reserved.
55.
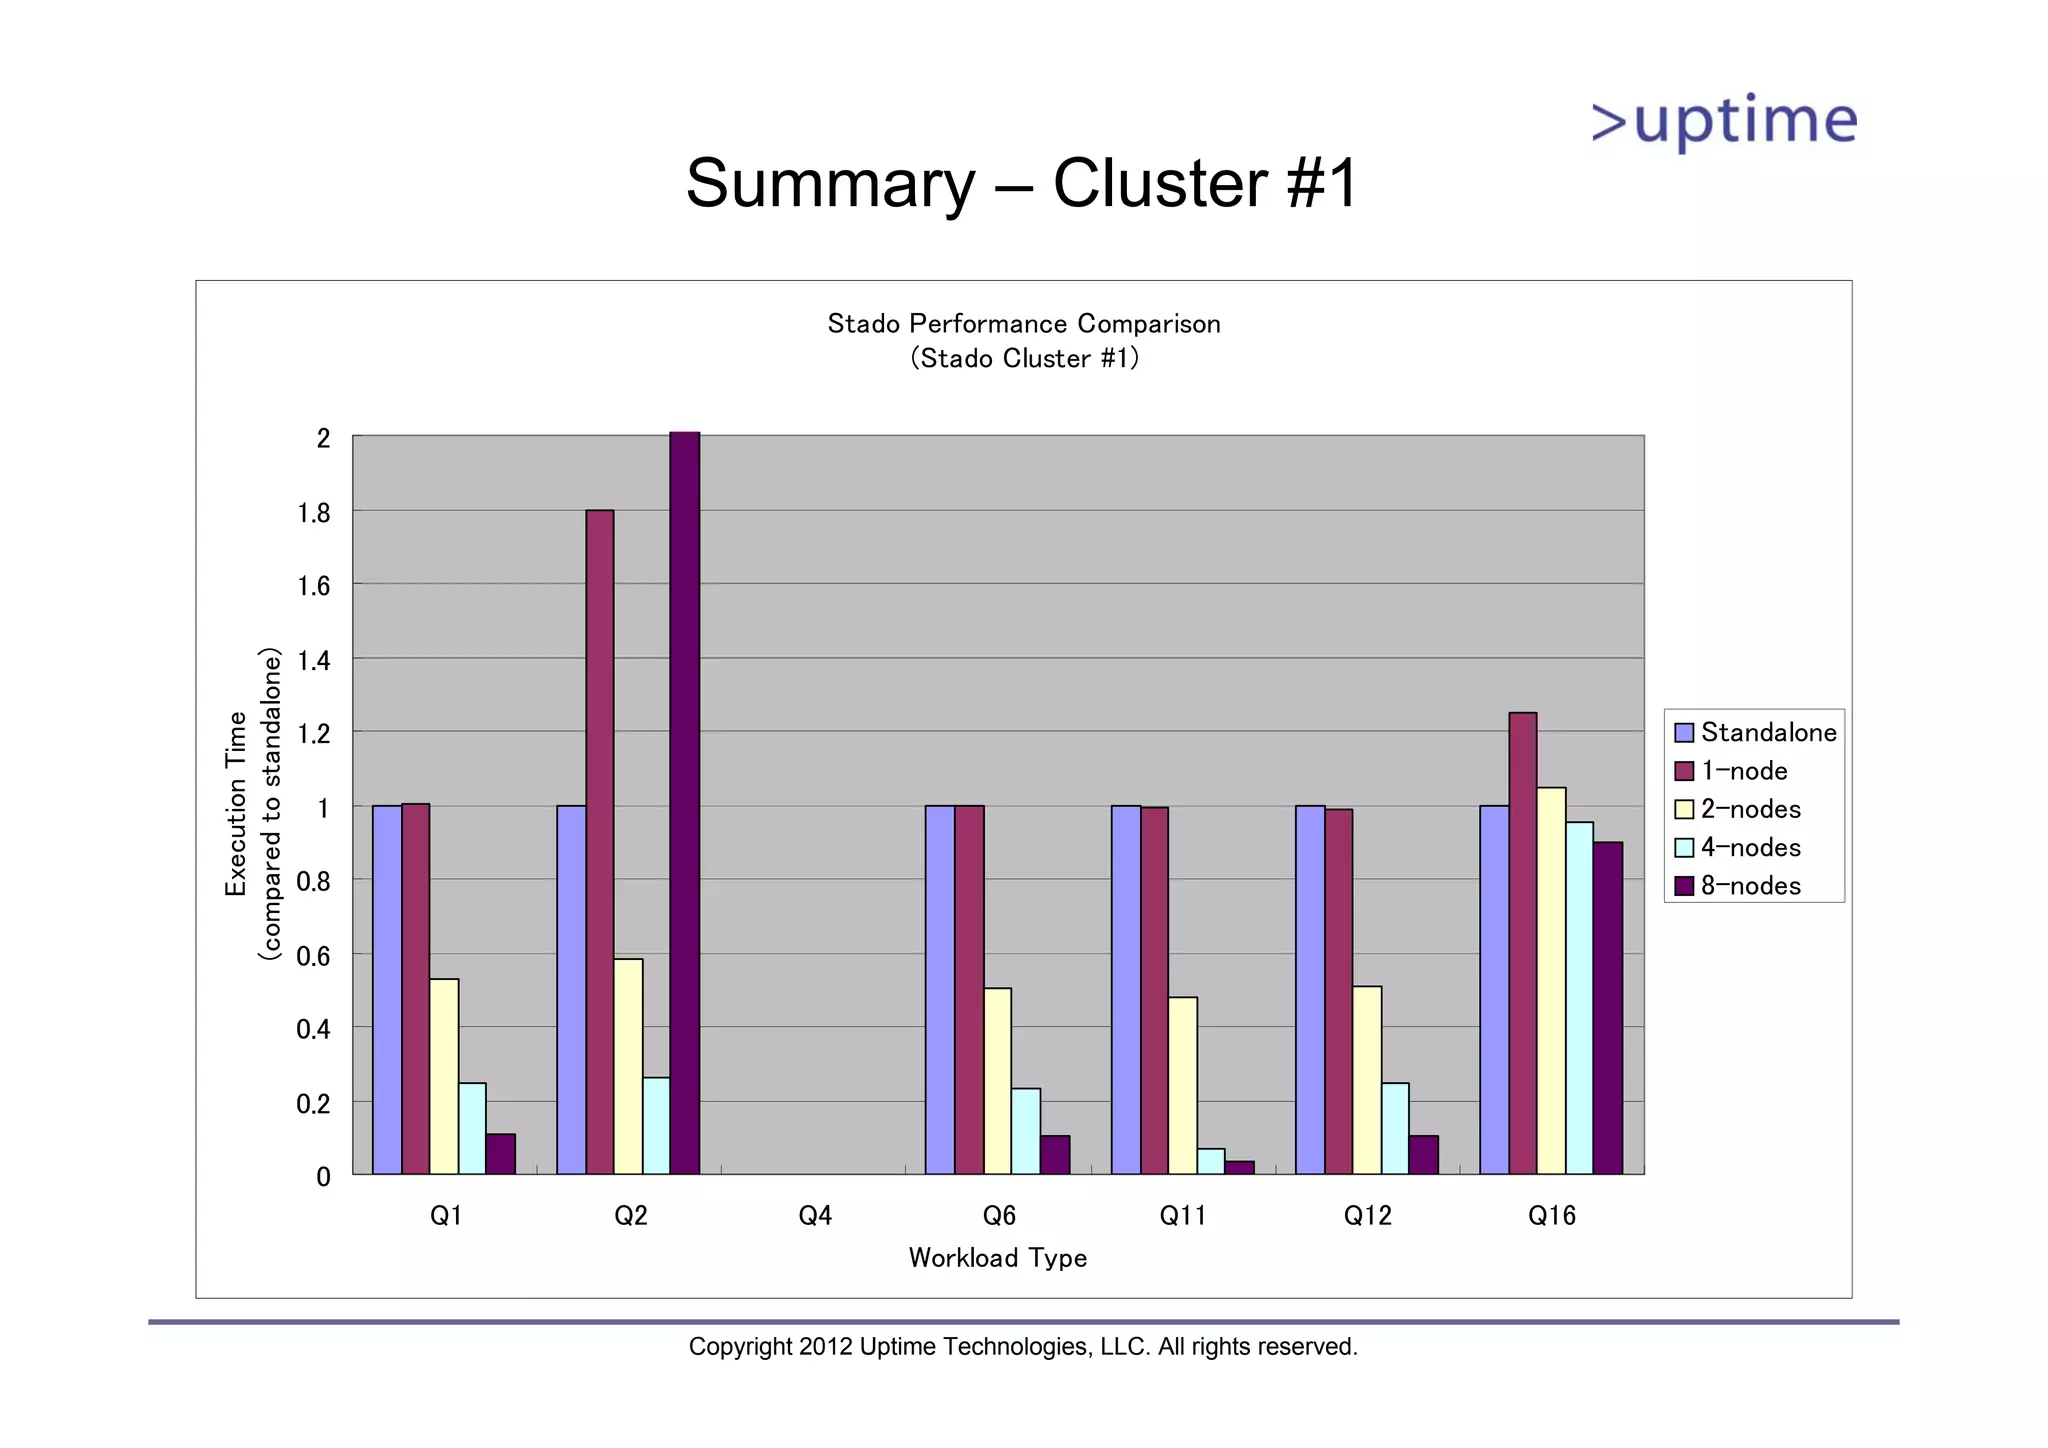
Summary – Cluster#1 Stado Performance Comparison (Stado Cluster #1) 2 1.8 1.6 1.4 (compared to standalone) Execution Time 1.2 Standalone 1-node 1 2-nodes 4-nodes 0.8 8-nodes 0.6 0.4 0.2 0 Q1 Q2 Q4 Q6 Q11 Q12 Q16 Workload Type Copyright 2012 Uptime Technologies, LLC. All rights reserved.
56.
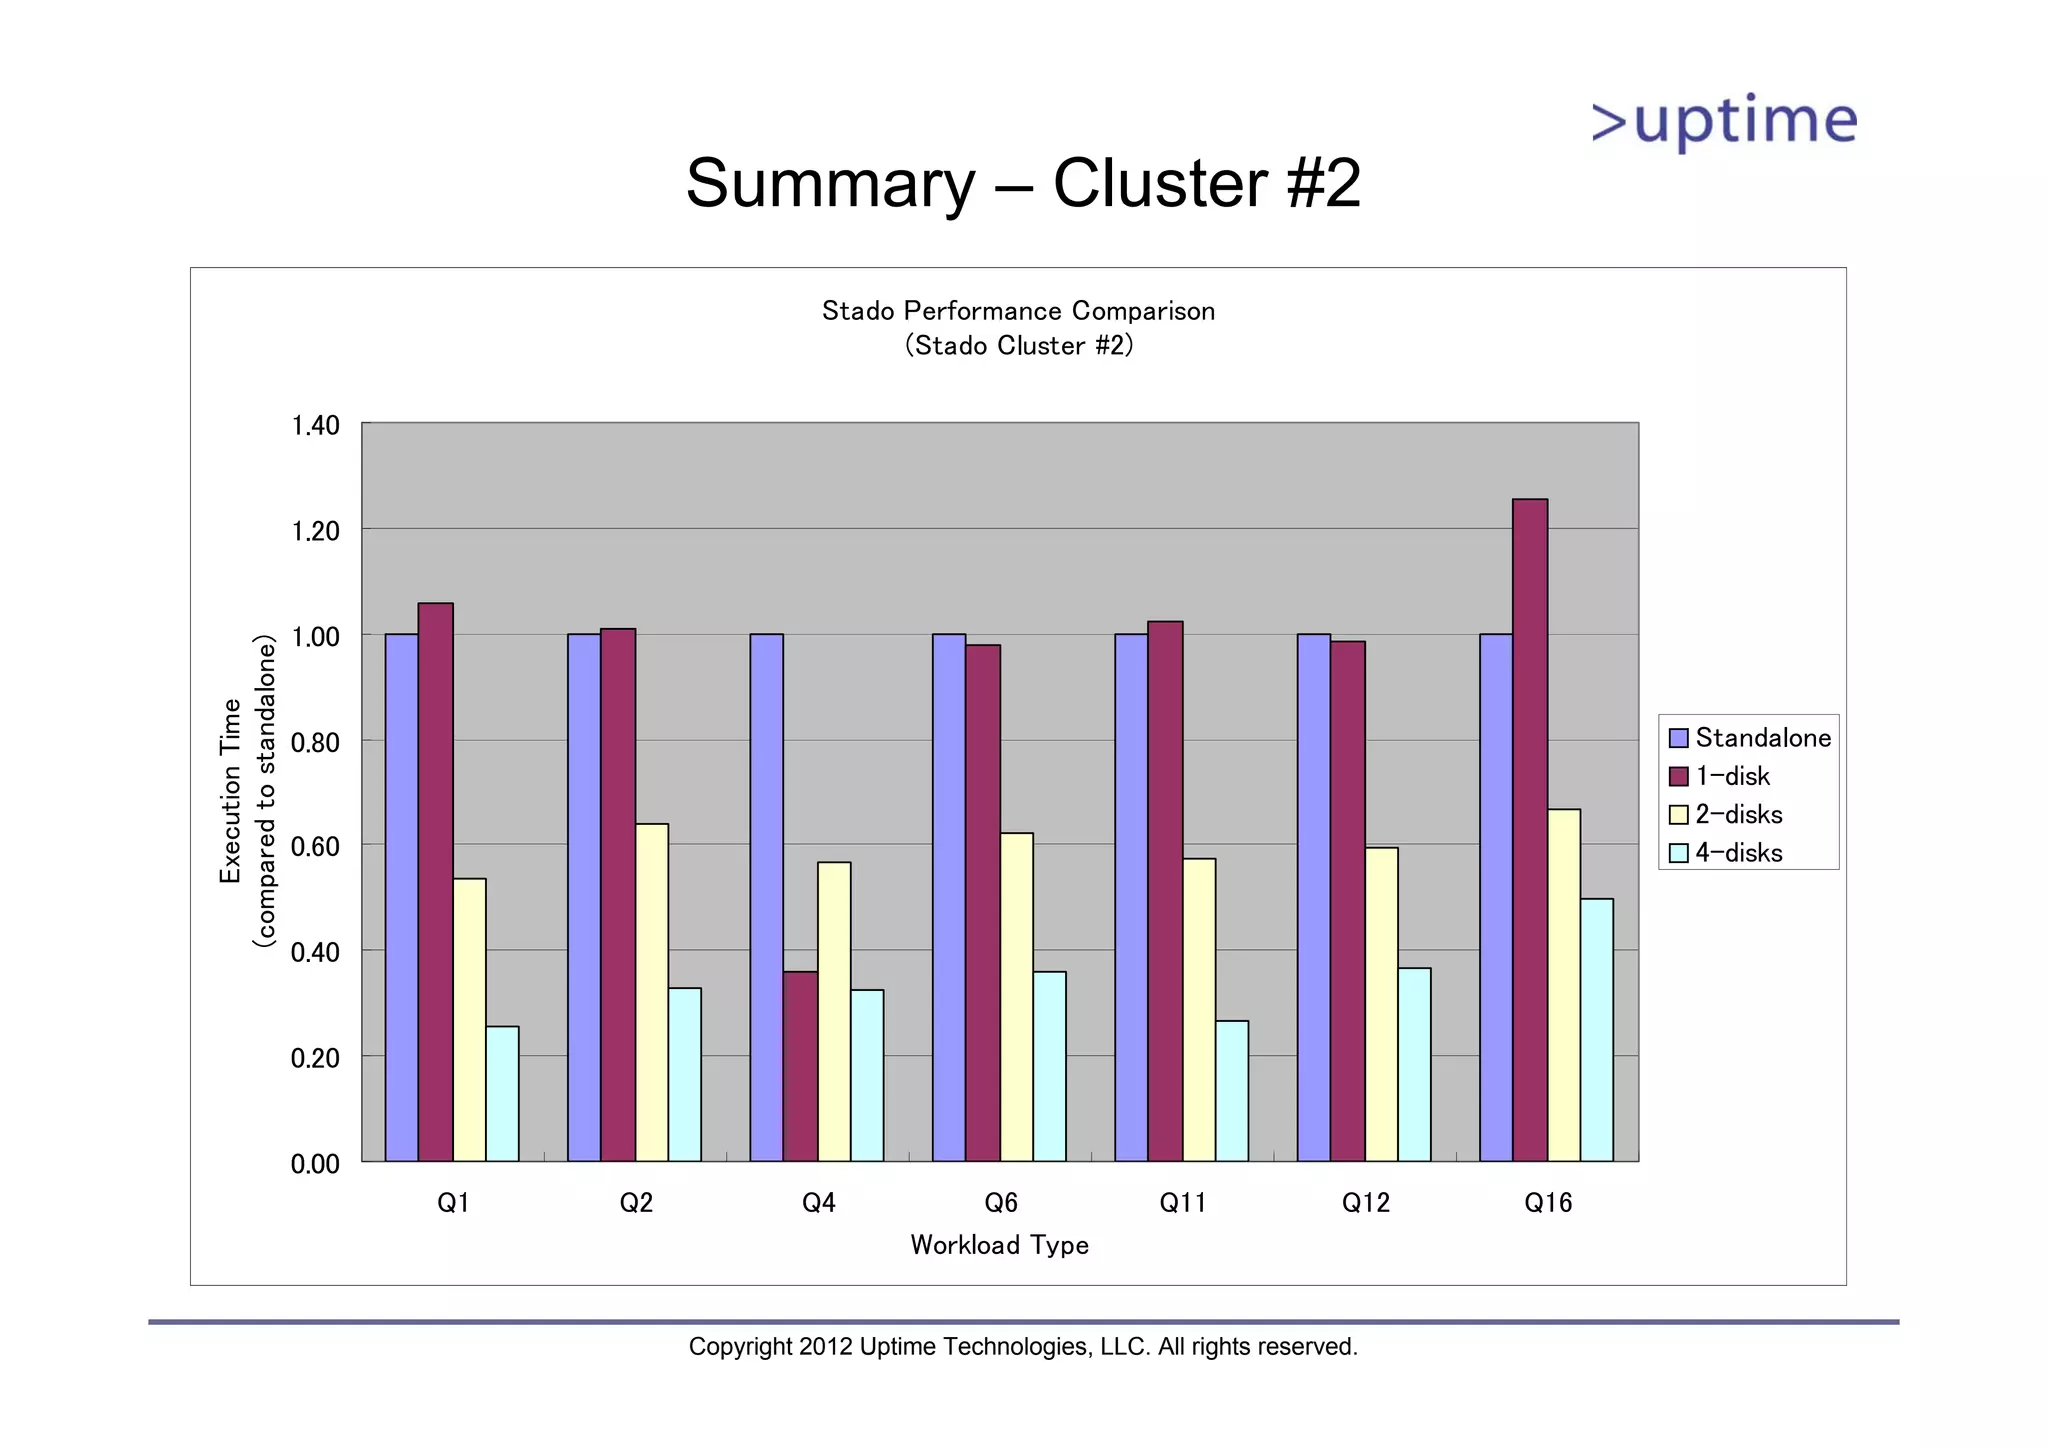
Summary – Cluster#2 Stado Performance Comparison (Stado Cluster #2) 1.40 1.20 1.00 (compared to standalone) Execution Time 0.80 Standalone 1-disk 2-disks 0.60 4-disks 0.40 0.20 0.00 Q1 Q2 Q4 Q6 Q11 Q12 Q16 Workload Type Copyright 2012 Uptime Technologies, LLC. All rights reserved.
57.
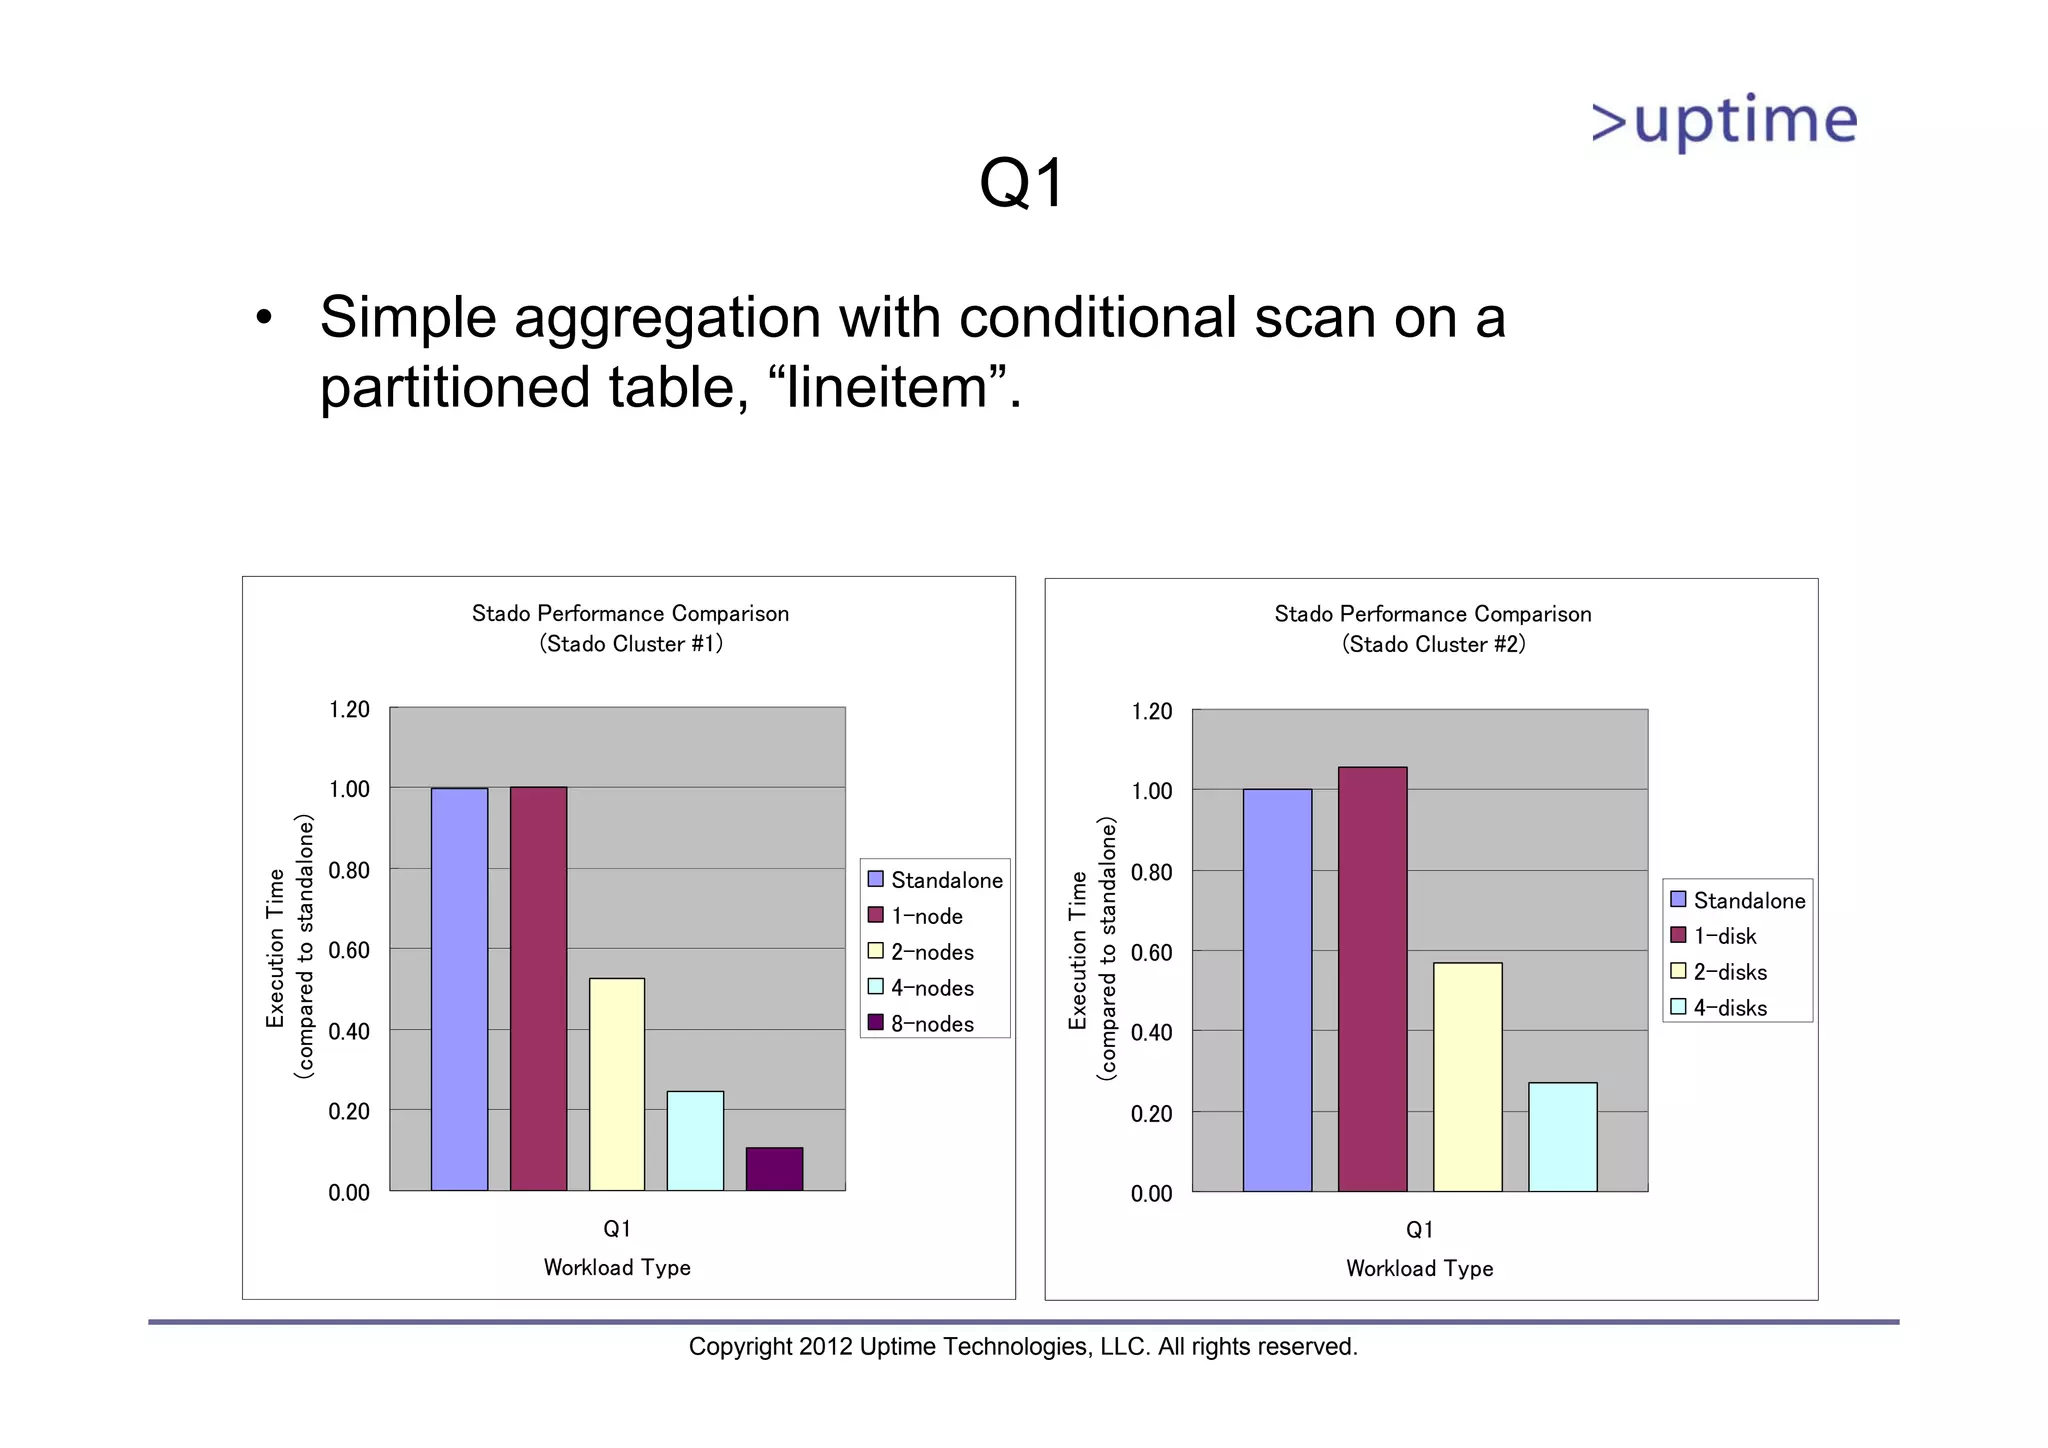
Q1 • Simple aggregationwith conditional scan on a partitioned table, “lineitem”. Stado Performance Comparison Stado Performance Comparison (Stado Cluster #1) (Stado Cluster #2) 1.20 1.20 1.00 1.00 (compared to standalone) (compared to standalone) 0.80 Standalone 0.80 Execution Time Execution Time Standalone 1-node 1-disk 0.60 2-nodes 0.60 2-disks 4-nodes 4-disks 0.40 8-nodes 0.40 0.20 0.20 0.00 0.00 Q1 Q1 Workload Type Workload Type Copyright 2012 Uptime Technologies, LLC. All rights reserved.
58.
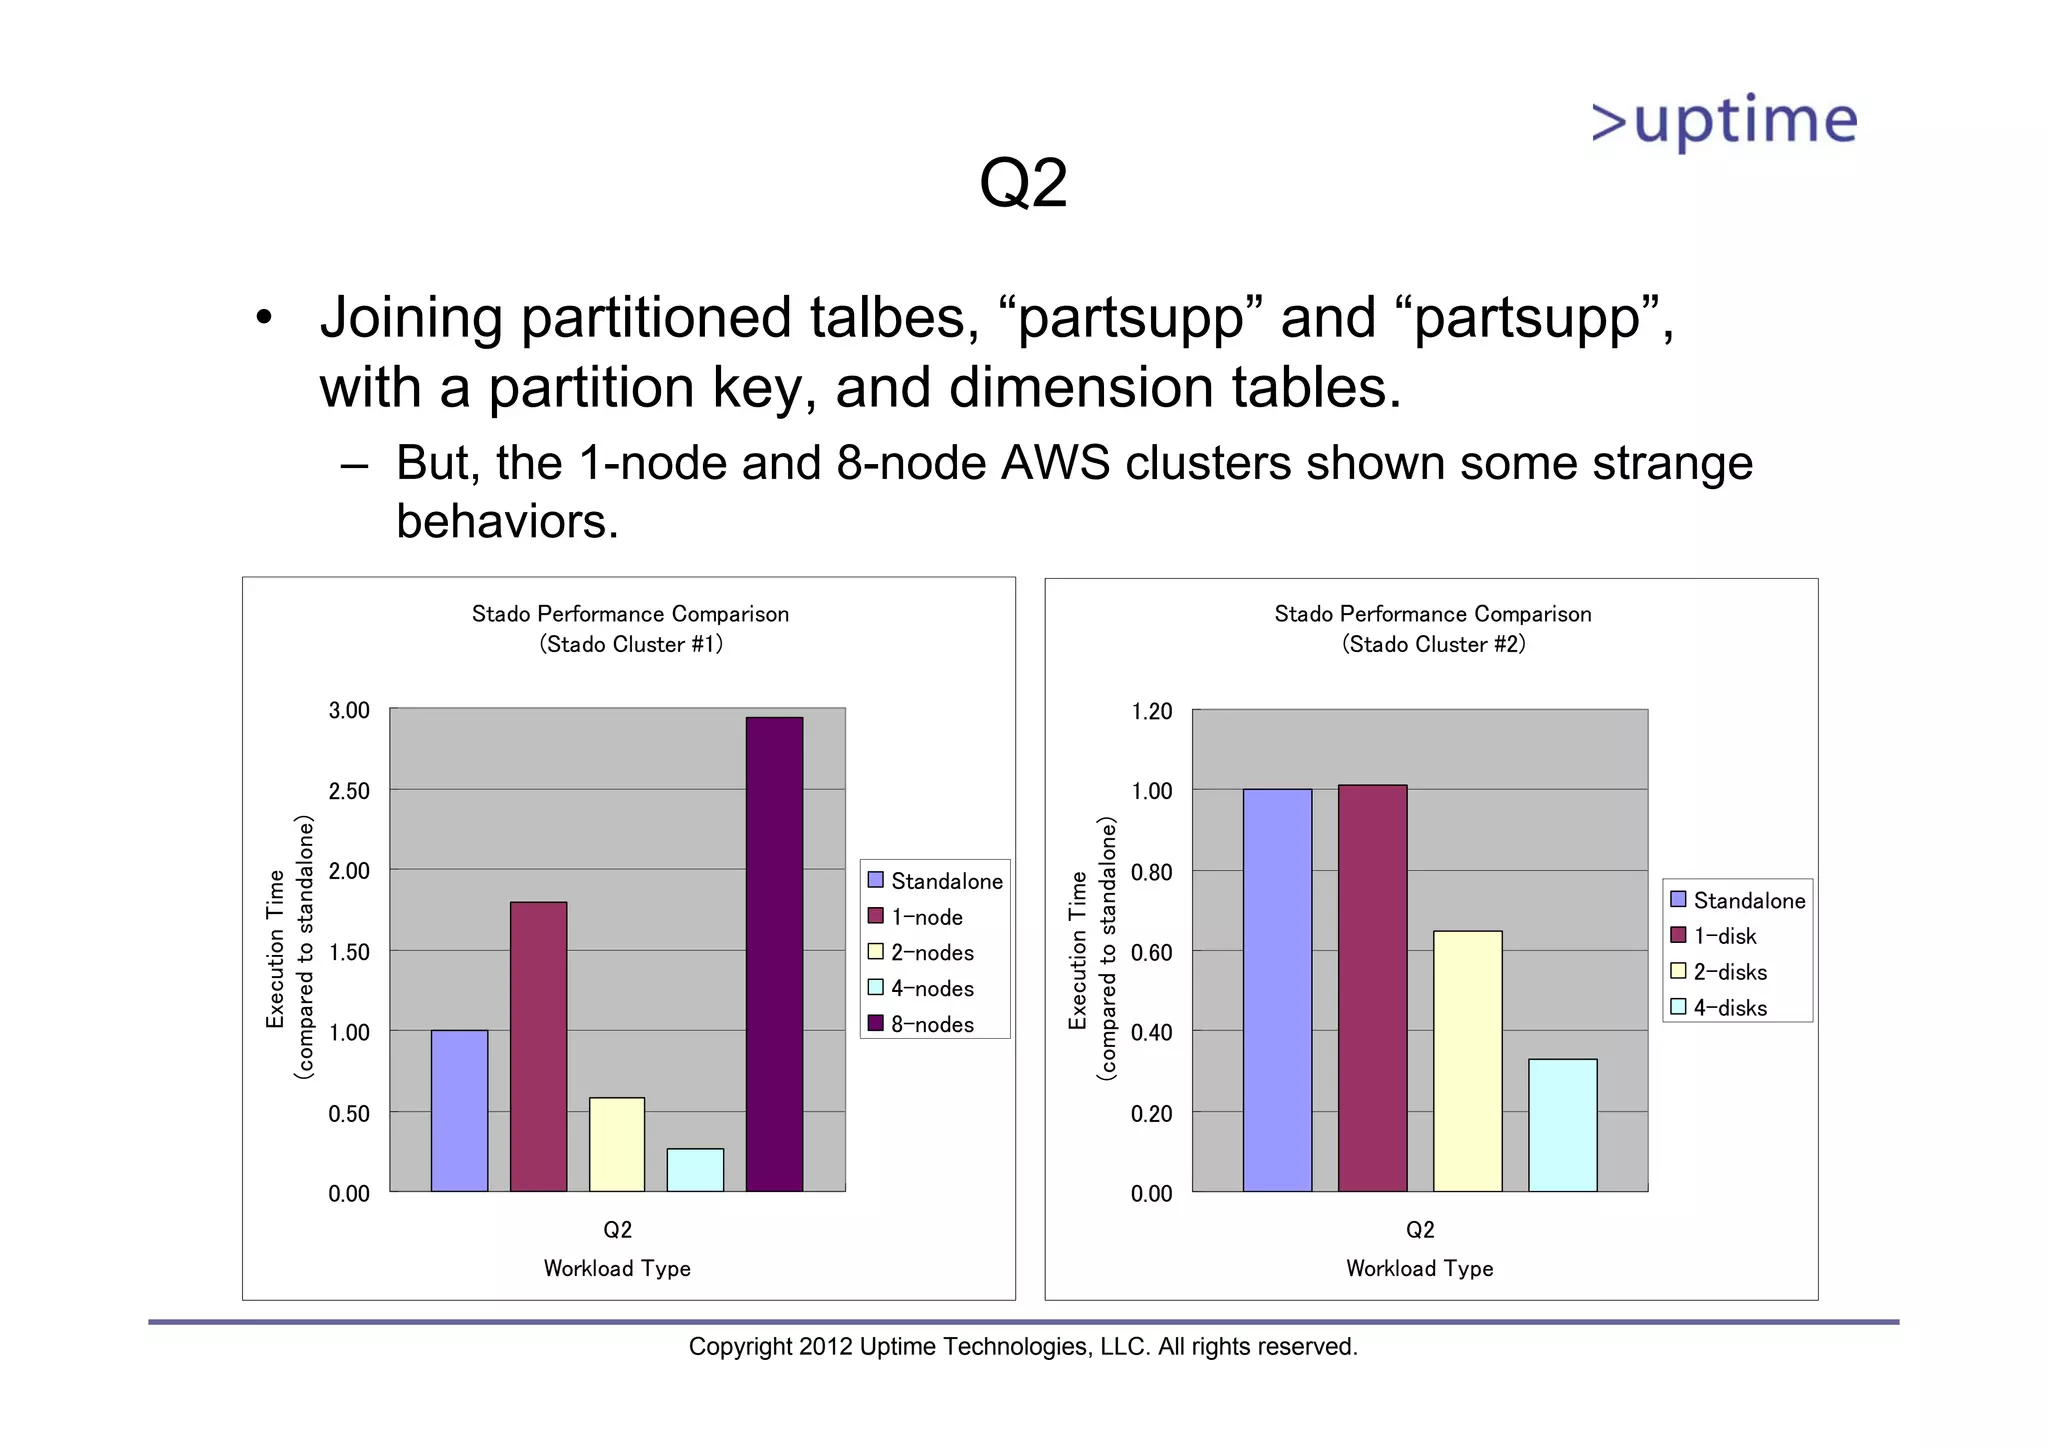
Q2 • Joining partitionedtalbes, “partsupp” and “partsupp”, with a partition key, and dimension tables. – But, the 1-node and 8-node AWS clusters shown some strange behaviors. Stado Performance Comparison Stado Performance Comparison (Stado Cluster #1) (Stado Cluster #2) 3.00 1.20 2.50 1.00 (compared to standalone) (compared to standalone) 2.00 Standalone 0.80 Execution Time Execution Time Standalone 1-node 1-disk 1.50 2-nodes 0.60 2-disks 4-nodes 4-disks 1.00 8-nodes 0.40 0.50 0.20 0.00 0.00 Q2 Q2 Workload Type Workload Type Copyright 2012 Uptime Technologies, LLC. All rights reserved.
59.
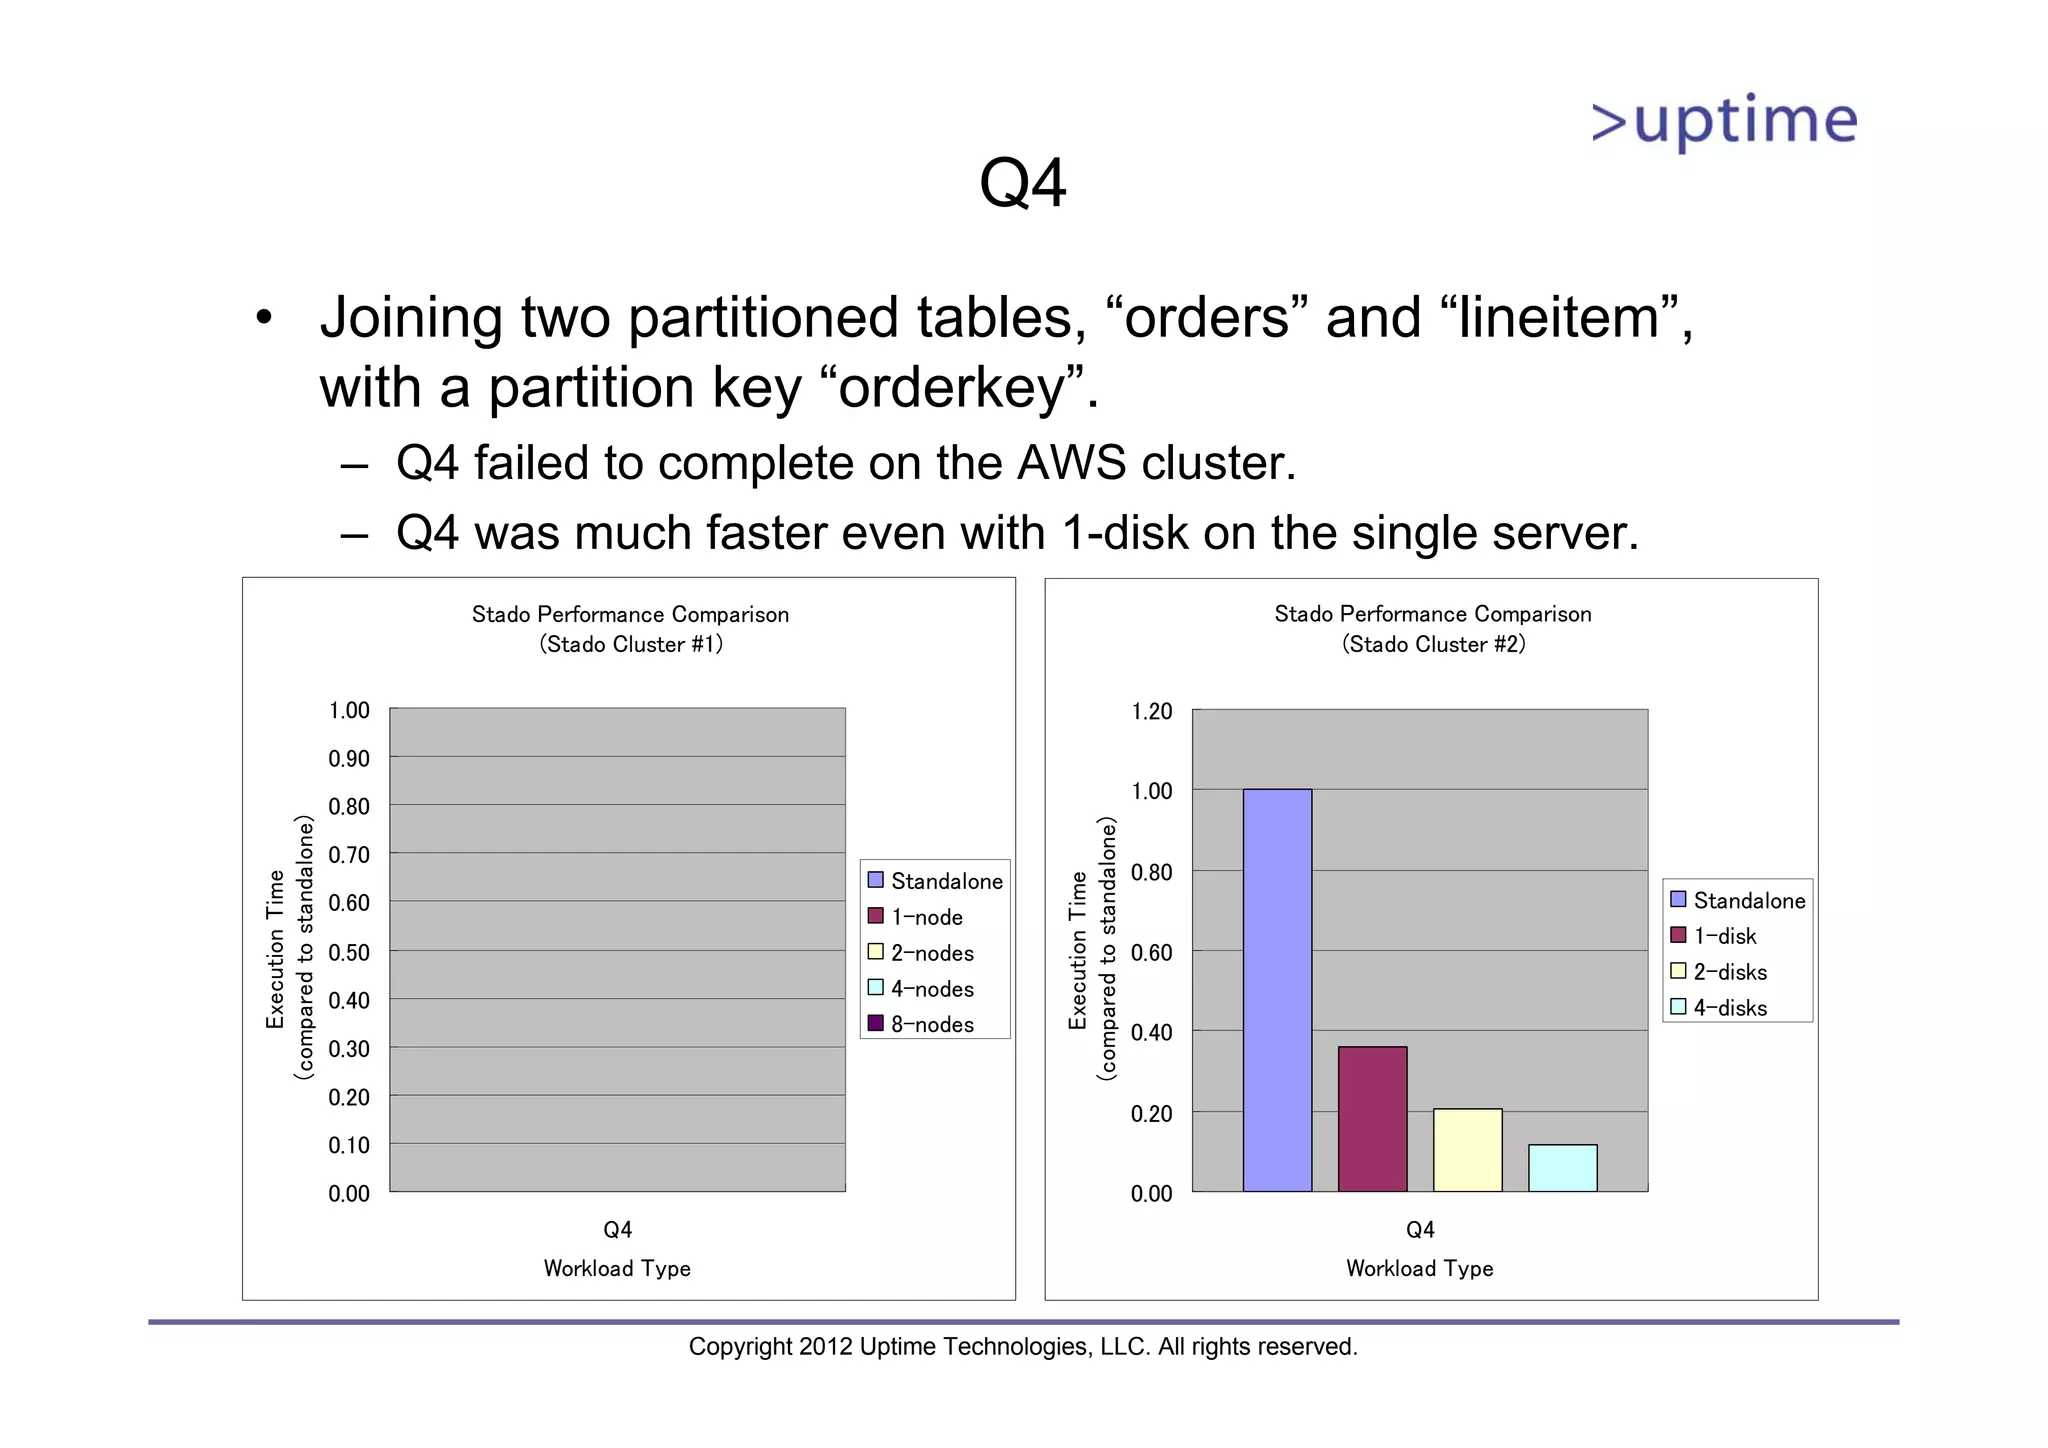
Q4 • Joining twopartitioned tables, “orders” and “lineitem”, with a partition key “orderkey”. – Q4 failed to complete on the AWS cluster. – Q4 was much faster even with 1-disk on the single server. Stado Performance Comparison Stado Performance Comparison (Stado Cluster #1) (Stado Cluster #2) 1.00 1.20 0.90 1.00 0.80 (compared to standalone) (compared to standalone) 0.70 Standalone 0.80 Execution Time Execution Time 0.60 Standalone 1-node 1-disk 0.50 2-nodes 0.60 2-disks 0.40 4-nodes 4-disks 8-nodes 0.40 0.30 0.20 0.20 0.10 0.00 0.00 Q4 Q4 Workload Type Workload Type Copyright 2012 Uptime Technologies, LLC. All rights reserved.
60.
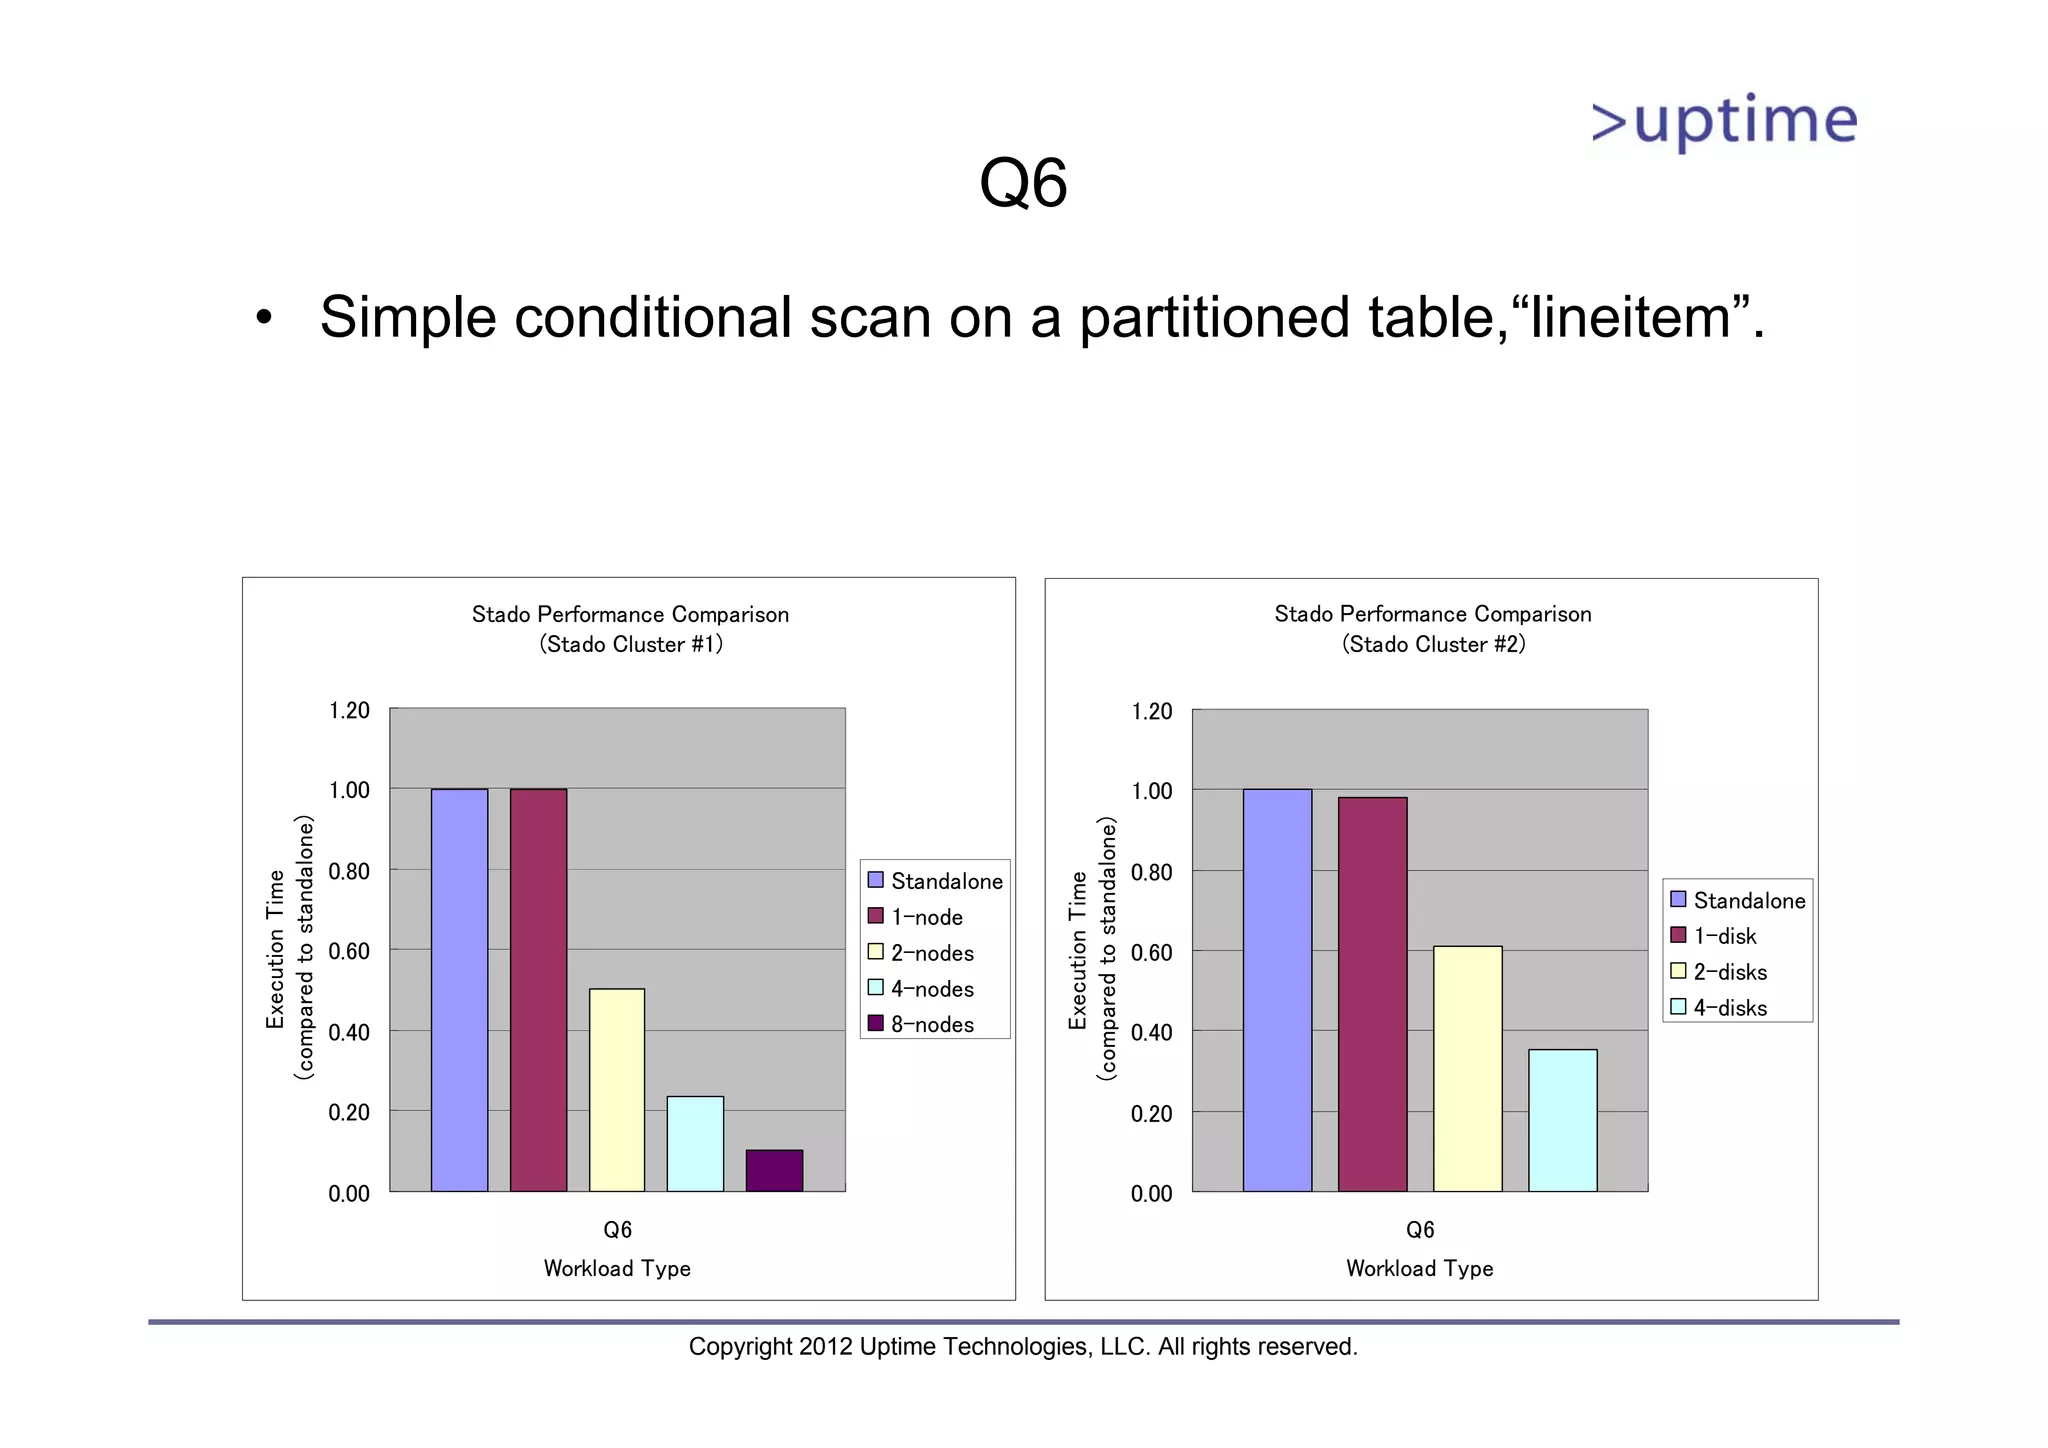
Q6 • Simple conditionalscan on a partitioned table,“lineitem”. Stado Performance Comparison Stado Performance Comparison (Stado Cluster #1) (Stado Cluster #2) 1.20 1.20 1.00 1.00 (compared to standalone) (compared to standalone) 0.80 Standalone 0.80 Execution Time Execution Time Standalone 1-node 1-disk 0.60 2-nodes 0.60 2-disks 4-nodes 4-disks 0.40 8-nodes 0.40 0.20 0.20 0.00 0.00 Q6 Q6 Workload Type Workload Type Copyright 2012 Uptime Technologies, LLC. All rights reserved.
61.
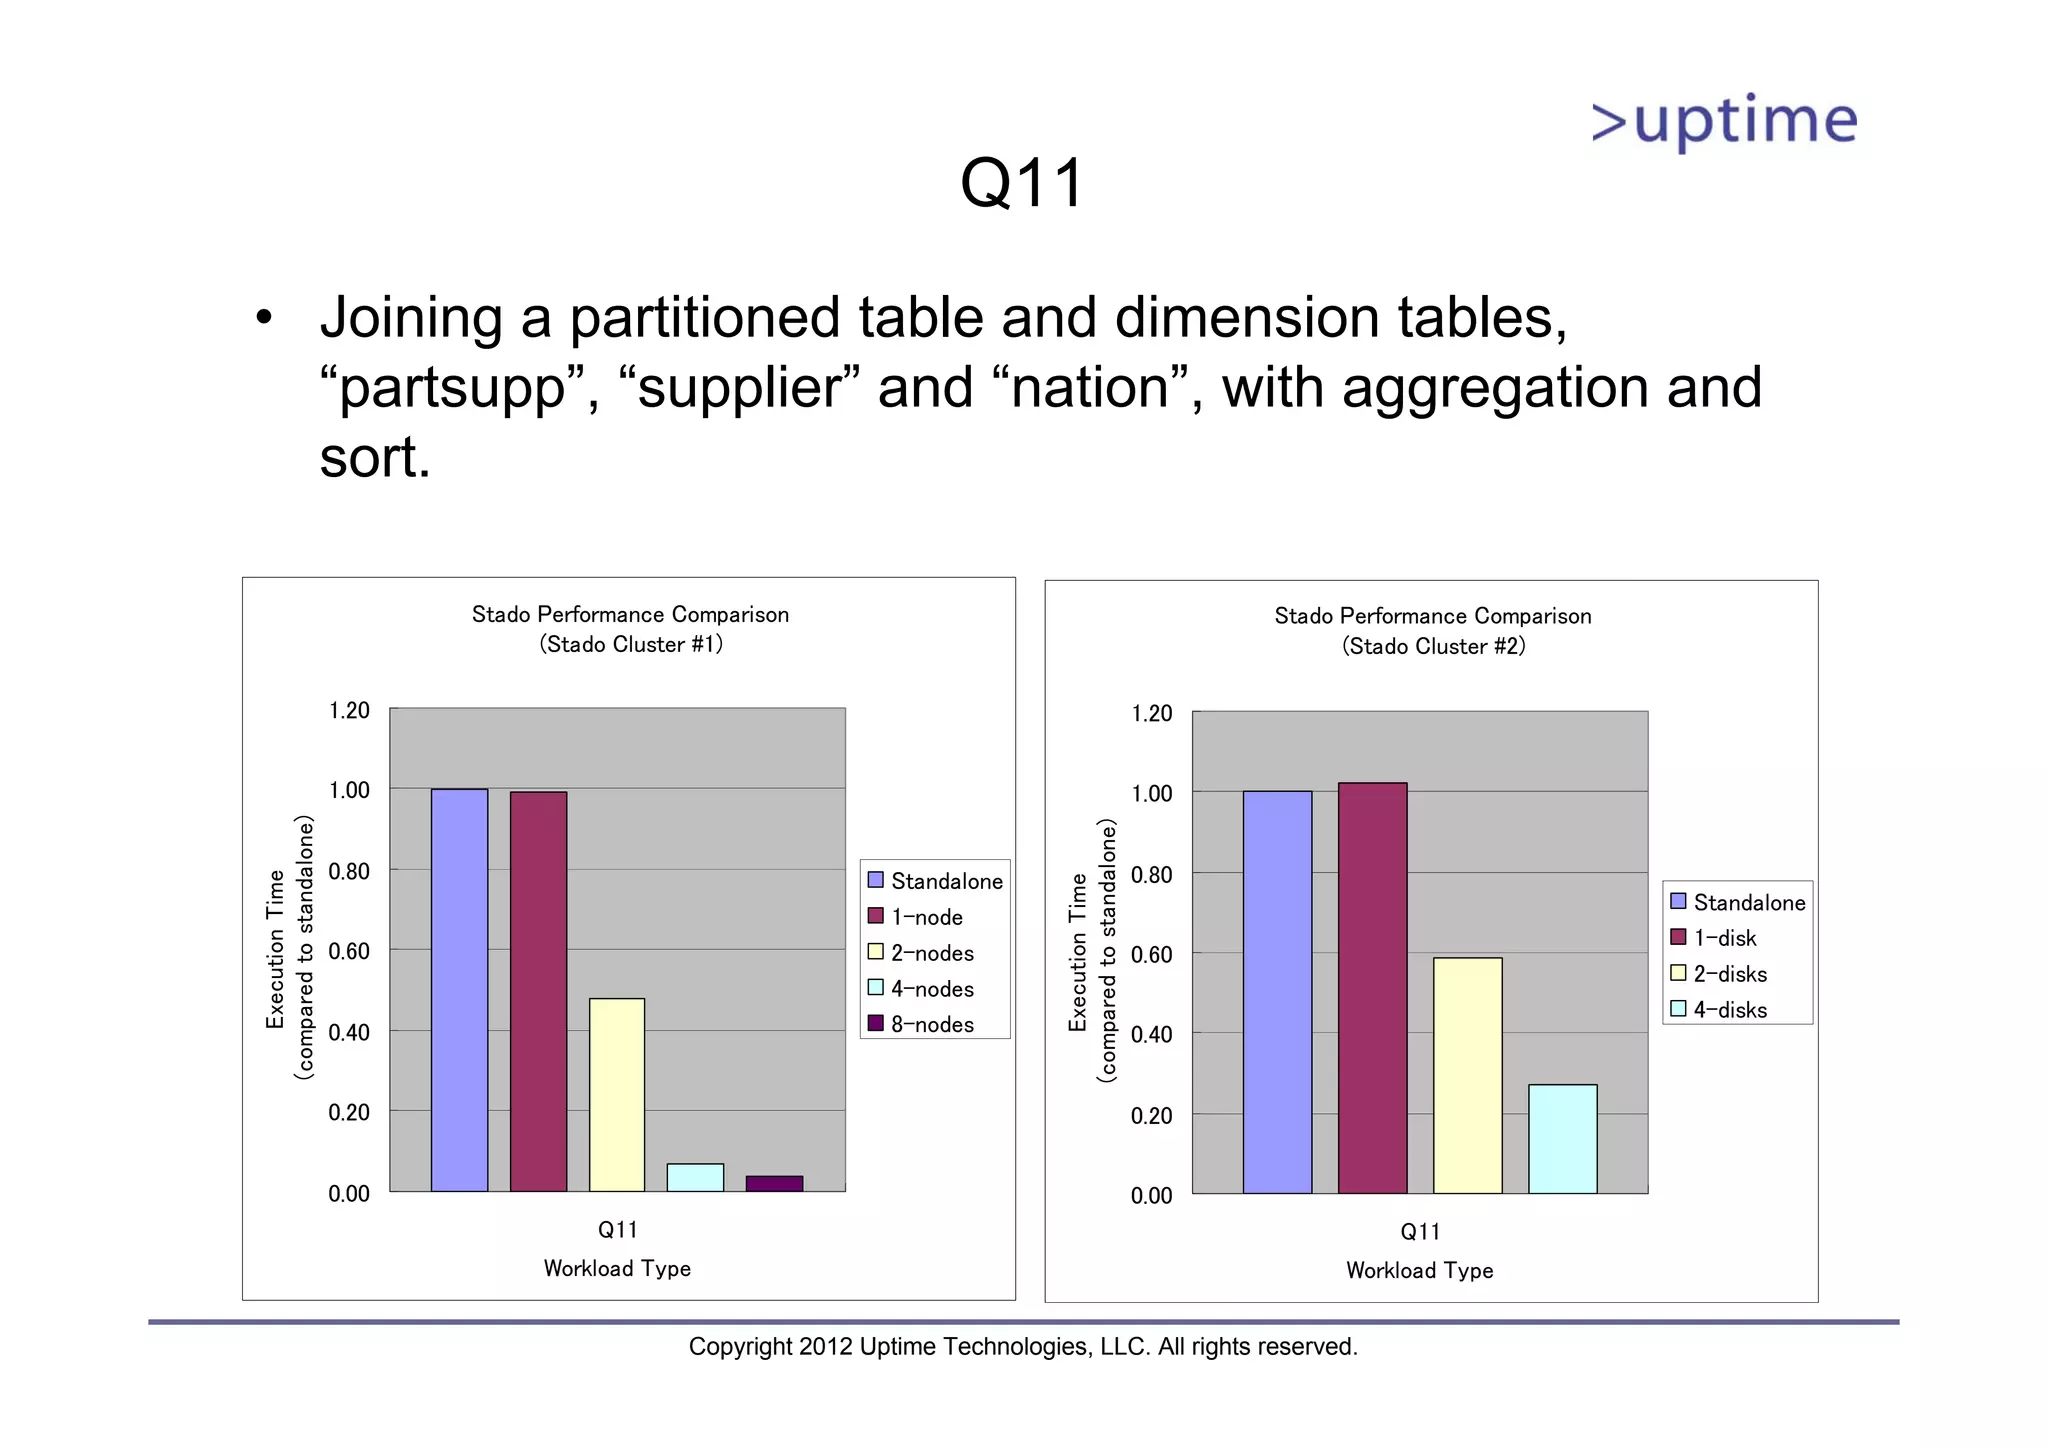
Q11 • Joining apartitioned table and dimension tables, “partsupp”, “supplier” and “nation”, with aggregation and sort. Stado Performance Comparison Stado Performance Comparison (Stado Cluster #1) (Stado Cluster #2) 1.20 1.20 1.00 1.00 (compared to standalone) (compared to standalone) 0.80 Standalone 0.80 Execution Time Execution Time Standalone 1-node 1-disk 0.60 2-nodes 0.60 2-disks 4-nodes 4-disks 0.40 8-nodes 0.40 0.20 0.20 0.00 0.00 Q11 Q11 Workload Type Workload Type Copyright 2012 Uptime Technologies, LLC. All rights reserved.
62.
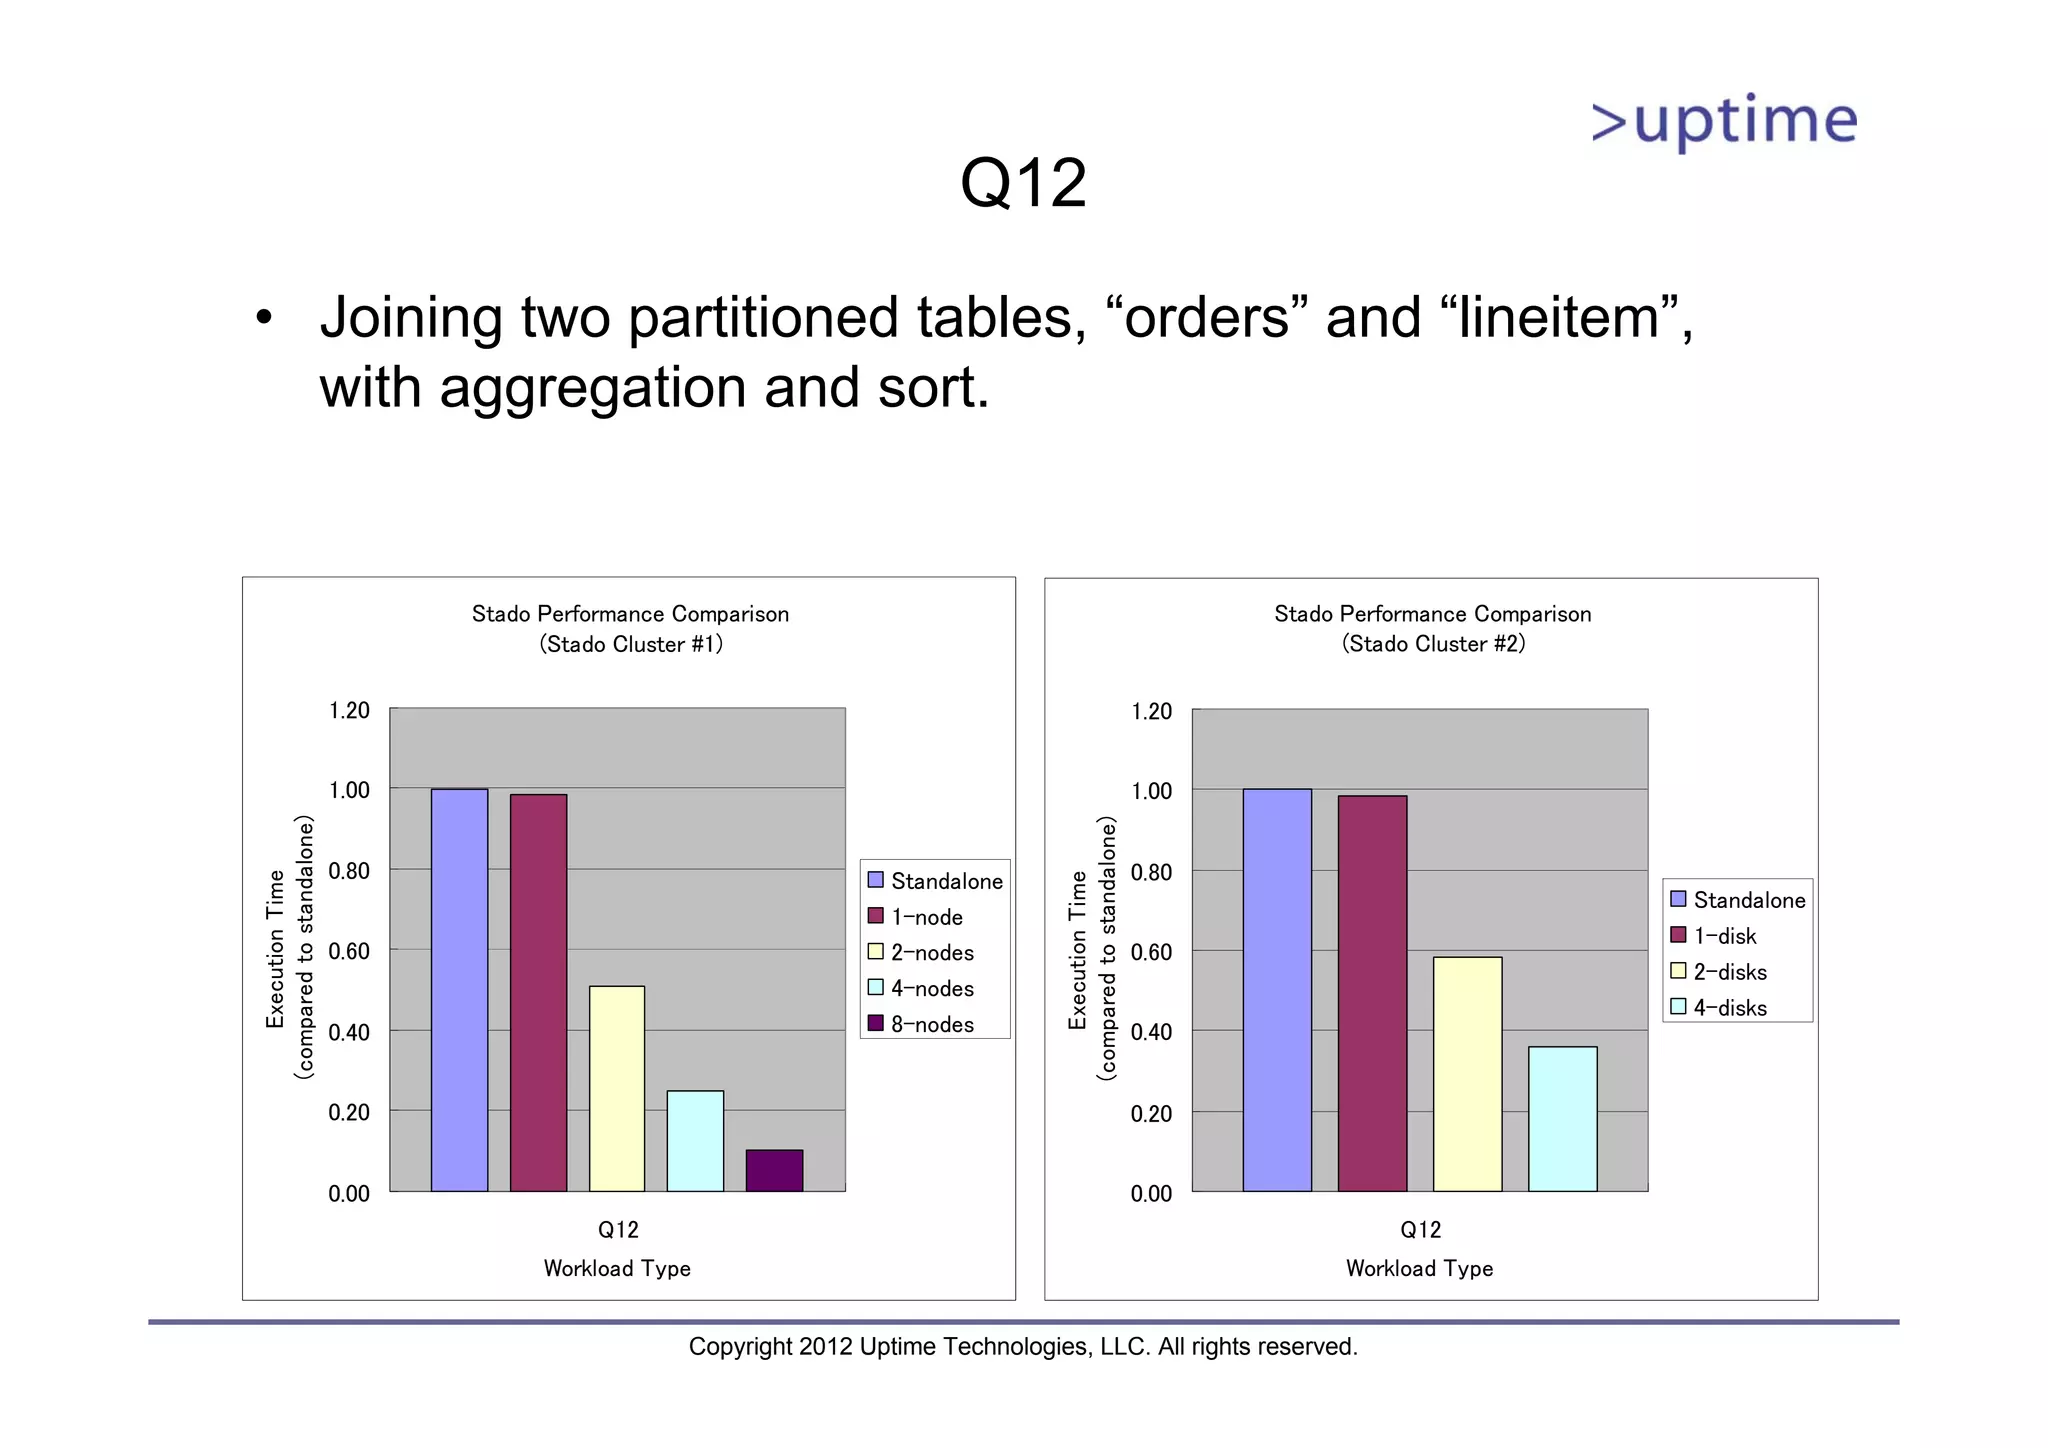
Q12 • Joining twopartitioned tables, “orders” and “lineitem”, with aggregation and sort. Stado Performance Comparison Stado Performance Comparison (Stado Cluster #1) (Stado Cluster #2) 1.20 1.20 1.00 1.00 (compared to standalone) (compared to standalone) 0.80 Standalone 0.80 Execution Time Execution Time Standalone 1-node 1-disk 0.60 2-nodes 0.60 2-disks 4-nodes 4-disks 0.40 8-nodes 0.40 0.20 0.20 0.00 0.00 Q12 Q12 Workload Type Workload Type Copyright 2012 Uptime Technologies, LLC. All rights reserved.
63.
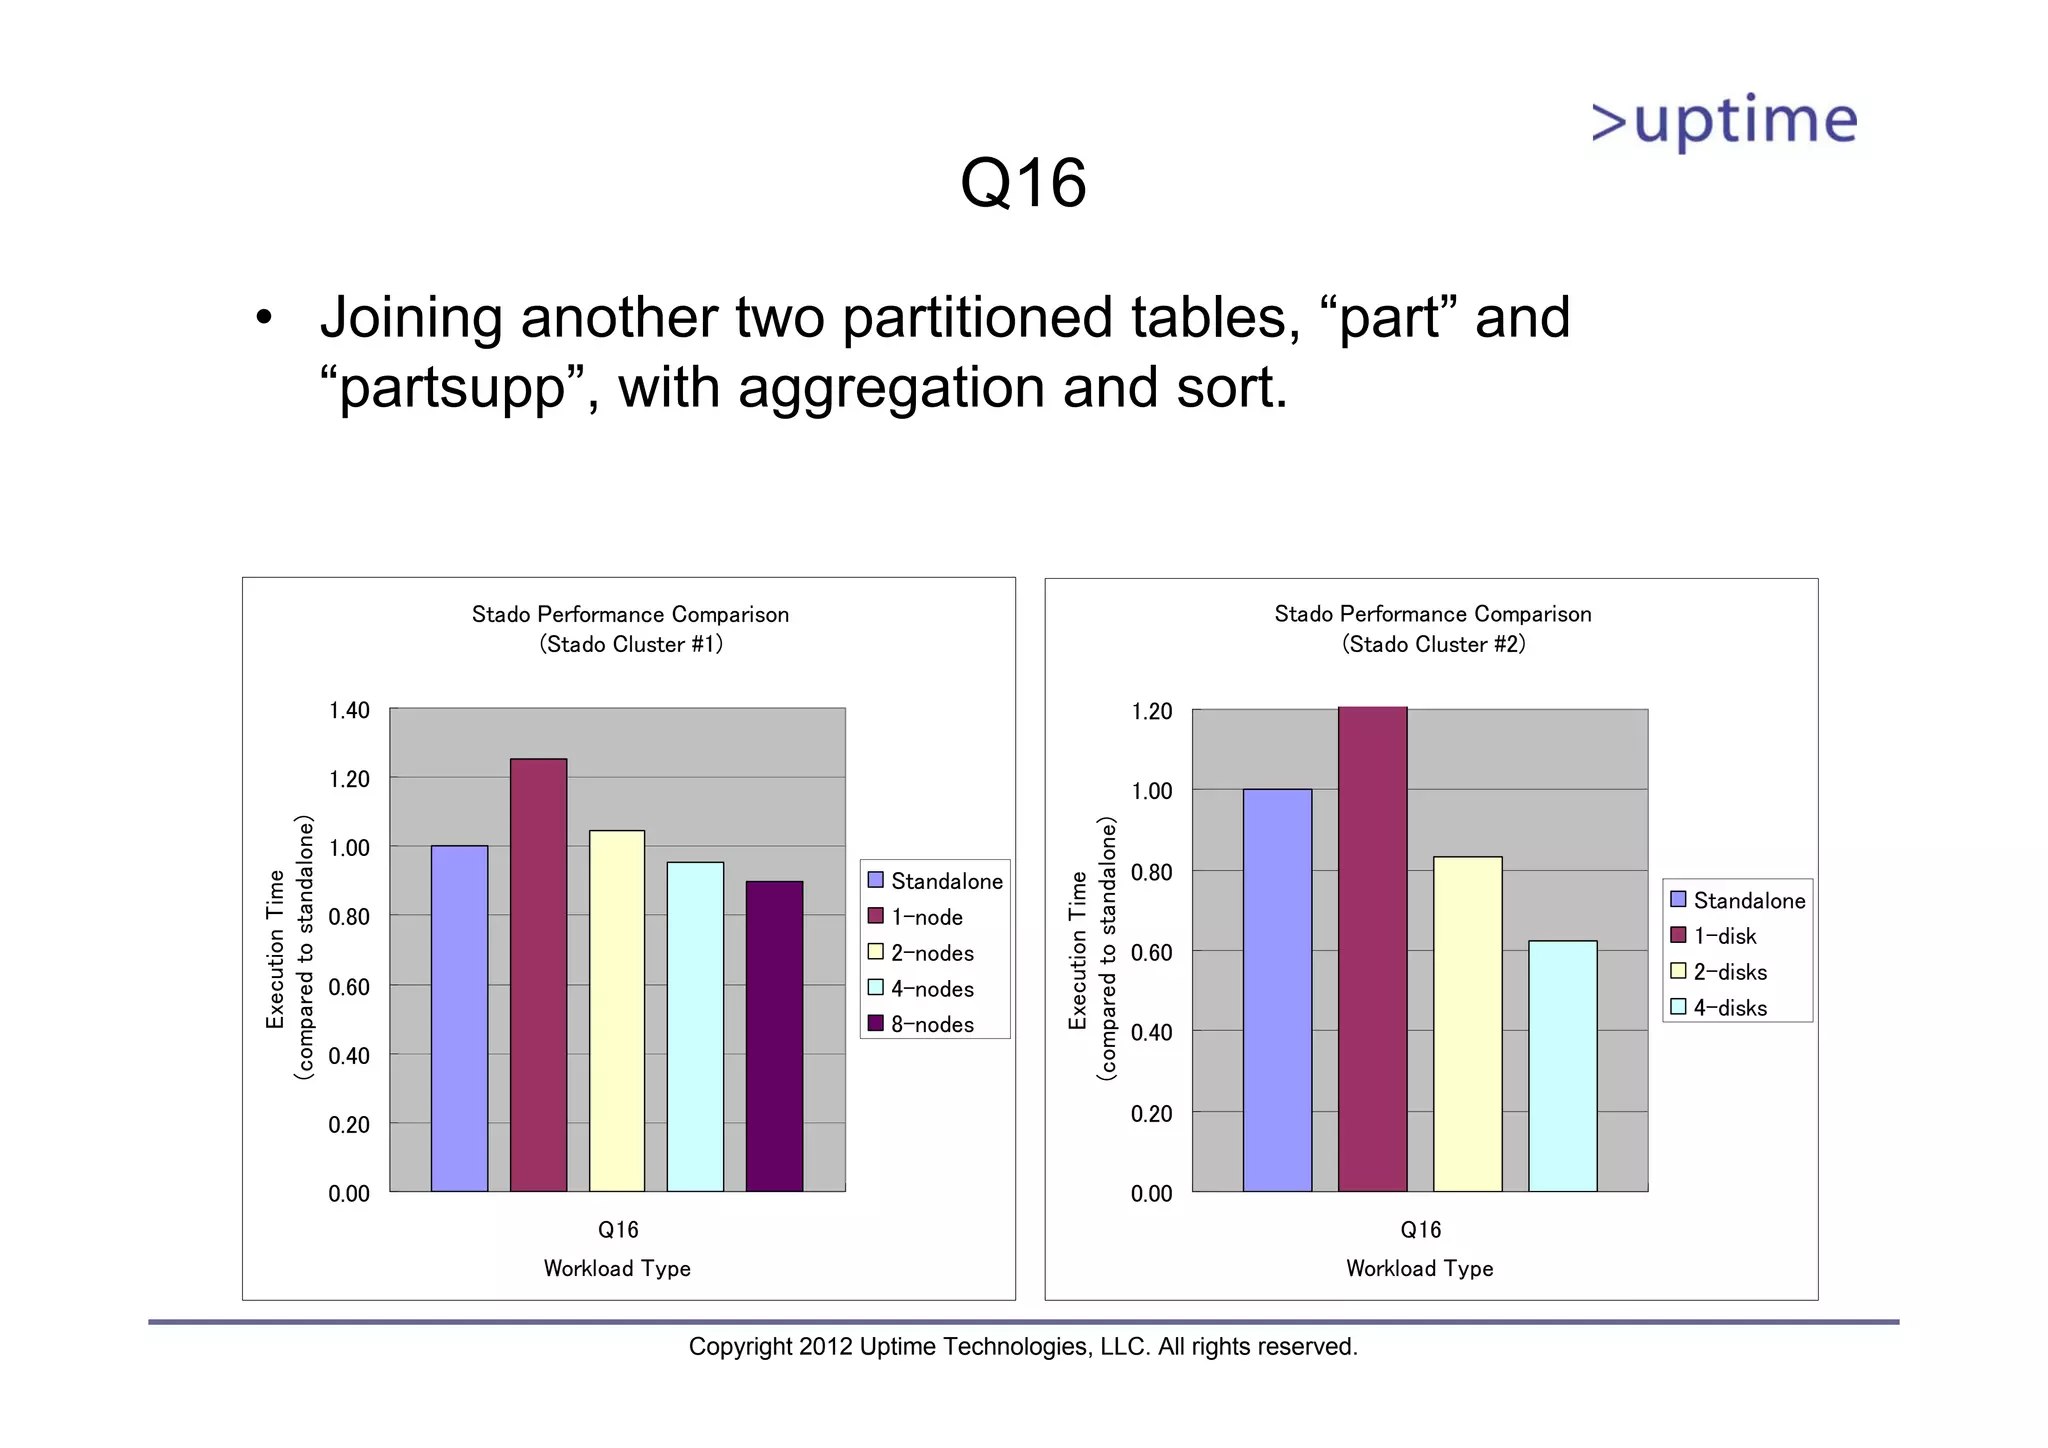
Q16 • Joining anothertwo partitioned tables, “part” and “partsupp”, with aggregation and sort. Stado Performance Comparison Stado Performance Comparison (Stado Cluster #1) (Stado Cluster #2) 1.40 1.20 1.20 1.00 (compared to standalone) (compared to standalone) 1.00 Standalone 0.80 Execution Time Execution Time Standalone 0.80 1-node 1-disk 2-nodes 0.60 2-disks 0.60 4-nodes 4-disks 8-nodes 0.40 0.40 0.20 0.20 0.00 0.00 Q16 Q16 Workload Type Workload Type Copyright 2012 Uptime Technologies, LLC. All rights reserved.
64.
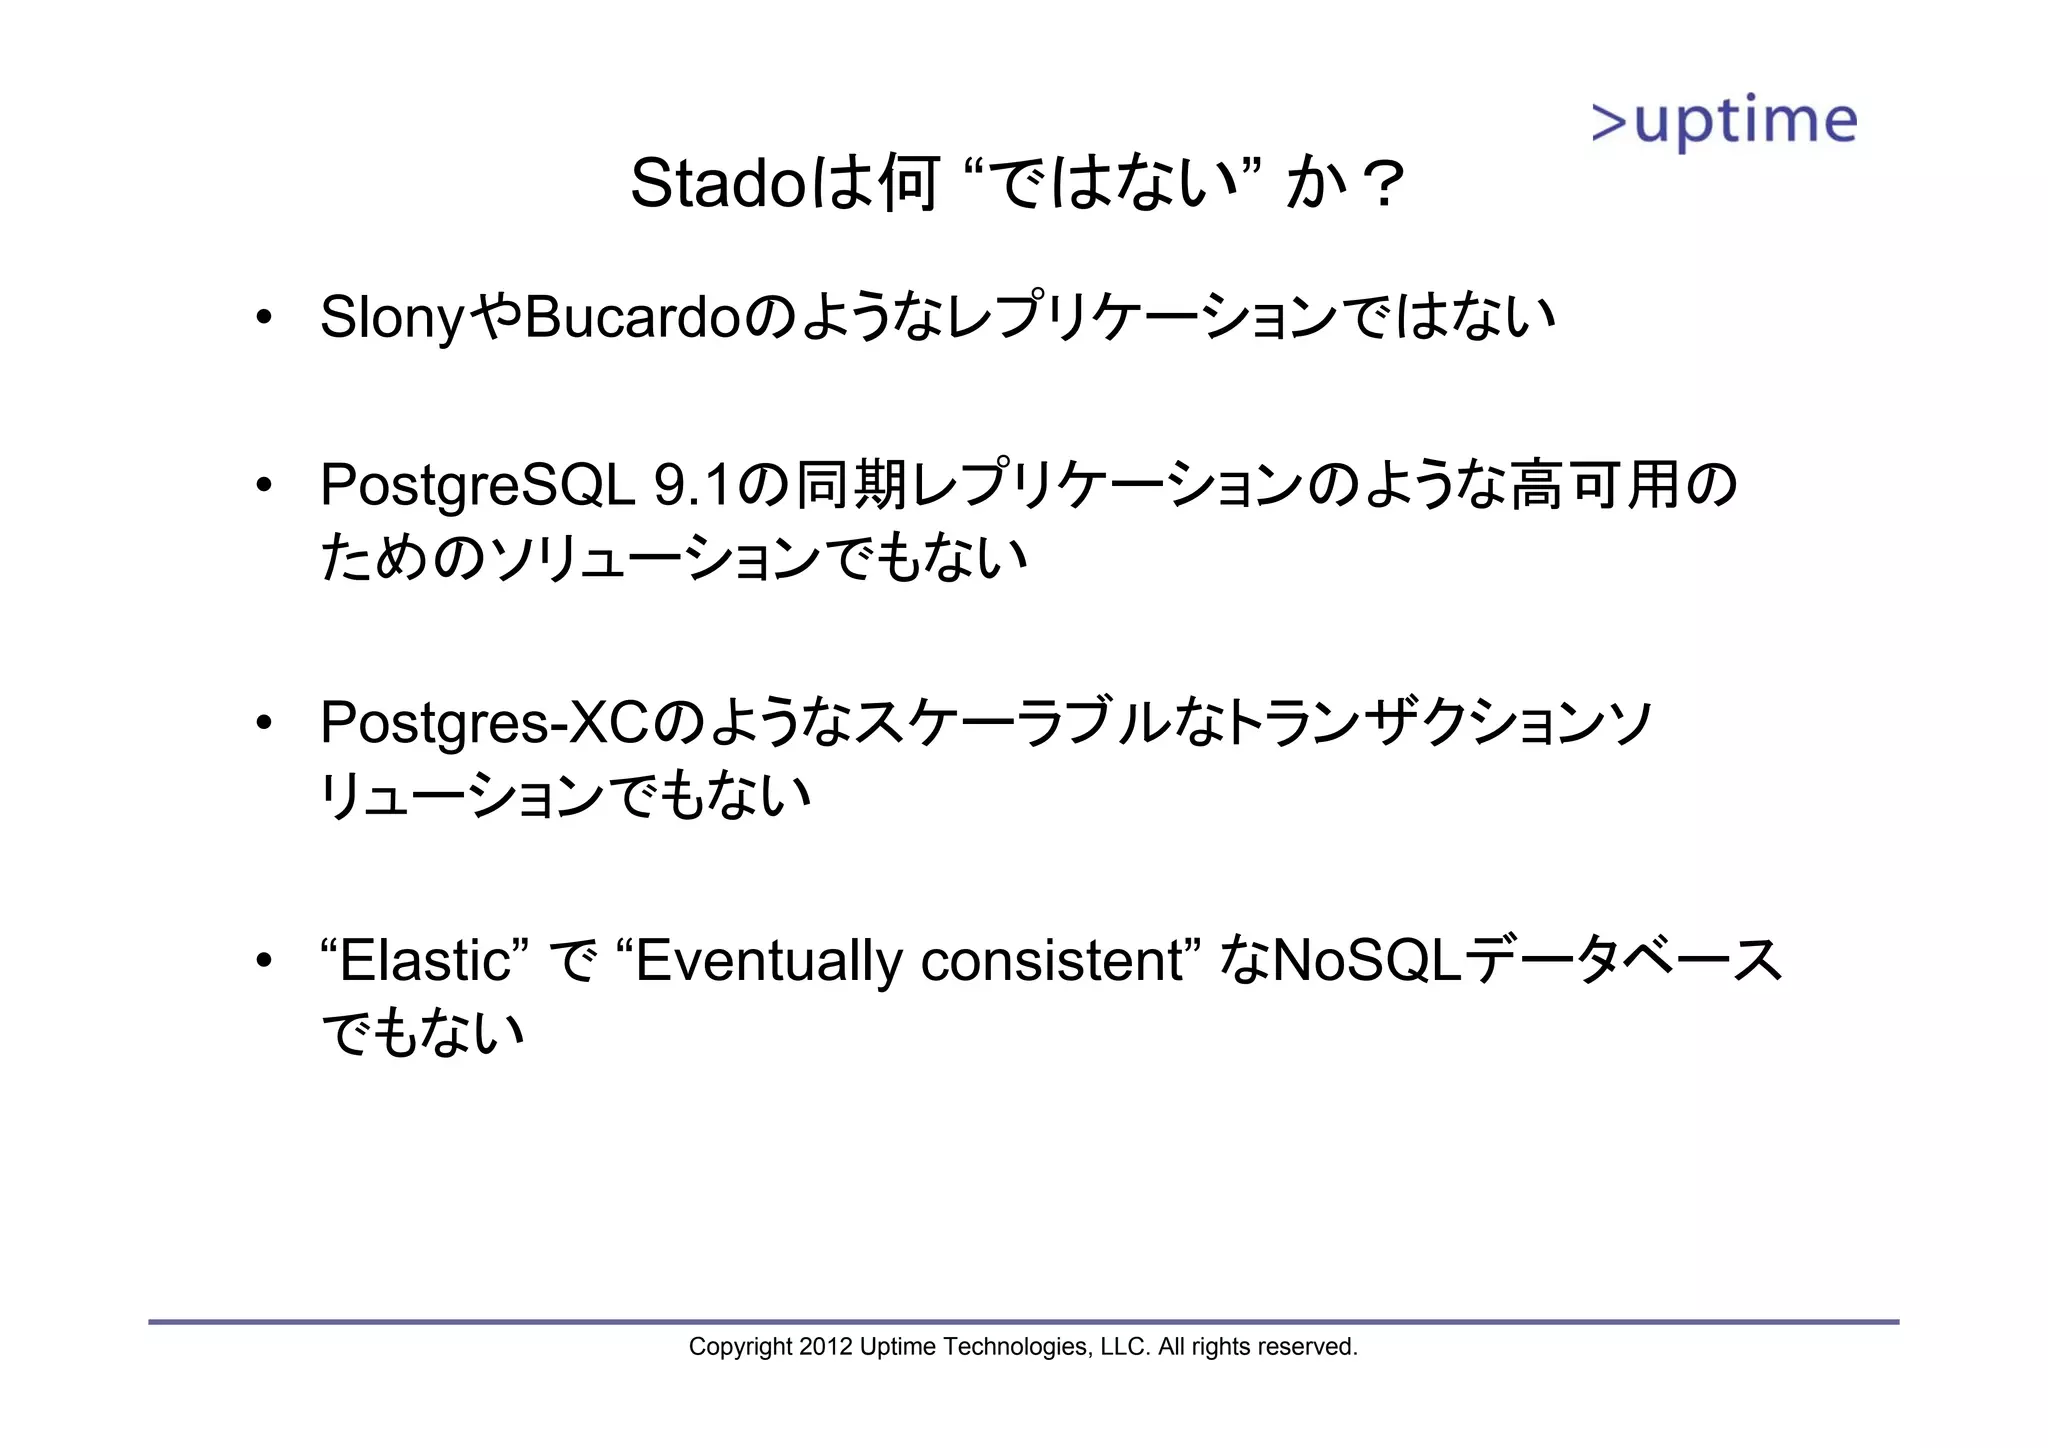
その他 • SQLの互換性はほぼ問題なし – DBT-3のクエリ22本はほとんどそのままの形で実行可能 – 一部、明示的な型キャストや優先度の指定が必要(parse errorなどが発生) • statement_timeout相当の処理がStadoには無いので注意 – SET statement_timeout コマンドを送れない – Row Shipping中(COPYコマンド中)にはpostgresql.confの statement_timeoutも効かなかった(調査中) • EXPLAINは、Row Shippingの発生および量を明確には教えてくれない ので、頭の中で理解しておく – “Even though, EXPLAIN is still your friend.” • 今後の課題 – ログ出力の強化、改善 – 管理コマンドの強化(パーティションの再配置等) – ドキュメントの強化 Copyright 2012 Uptime Technologies, LLC. All rights reserved.