Downloaded 166 times

![Install & Config FileBeat 4 # rpm -ivh filebeat-1.0.1-x86_64.rpm $vi /etc/filebeat/filebeat.yml filebeat: prospectors: paths: - /db/data01/mysql-slow.log //slow query path output: #elasticsearch: //comment #hosts: ["localhost:9200"] //comment logstash: //uncomment # The Logstash hosts hosts: ["10.xx.xx.xx:5044"] //logstash server ip 1. Install FileBeat – on DB servers 2. Parameter configuration](https://image.slidesharecdn.com/mysqlslowlog20160628-160629001606/75/MySQL-Slow-Query-log-Monitoring-using-Beats-ELK-4-2048.jpg)
![5 # /etc/init.d/filebeat start Starting filebeat: [ OK ] 3. Start FileBeat – on DB servers Install & Config FileBeat](https://image.slidesharecdn.com/mysqlslowlog20160628-160629001606/75/MySQL-Slow-Query-log-Monitoring-using-Beats-ELK-5-2048.jpg)
![9 2-2. Configure(filter plugin) filter { grok { match => [ "message", "^# User@Host: %{USER:query_user}(?:[[^]]+])?s+@s+%{HOSTNAME:query_host}?s+[%{IP:query_ip}?]" ] } grok { match => [ "message", "^# Thread_id: %{NUMBER:thread_id:int}s+Schema: %{USER:schema}s+Last_errno: %{NUMBER:last_errno:int}s+Killed: %{NUMBER:killed:int}"] } grok { match => [ "message", "^# Query_time: %{NUMBER:query_time:float}s+Lock_time: %{NUMBER:lock_time}s+ Rows_sent: %{NUMBER:rows_sent:int} s+Rows_examined: %{NUMBER:rows_examined:int}s+Rows_affected: %{NUMBER:rows_affected:int}s+Rows_read: %{NUMBER:rows_read:int}"] } grok { match => [ "message", "^# Bytes_sent: %{NUMBER:bytes_sent:float}"] } grok { match => [ "message", "^SET timestamp=%{NUMBER:timestamp}" ] } grok { match => [ "message", "^SET timestamp=%{NUMBER};s+%{GREEDYDATA:query}" ] } date { match => [ "timestamp", "UNIX" ] } mutate { remove_field => "timestamp" } } Install & Config Logstash](https://image.slidesharecdn.com/mysqlslowlog20160628-160629001606/75/MySQL-Slow-Query-log-Monitoring-using-Beats-ELK-9-2048.jpg)


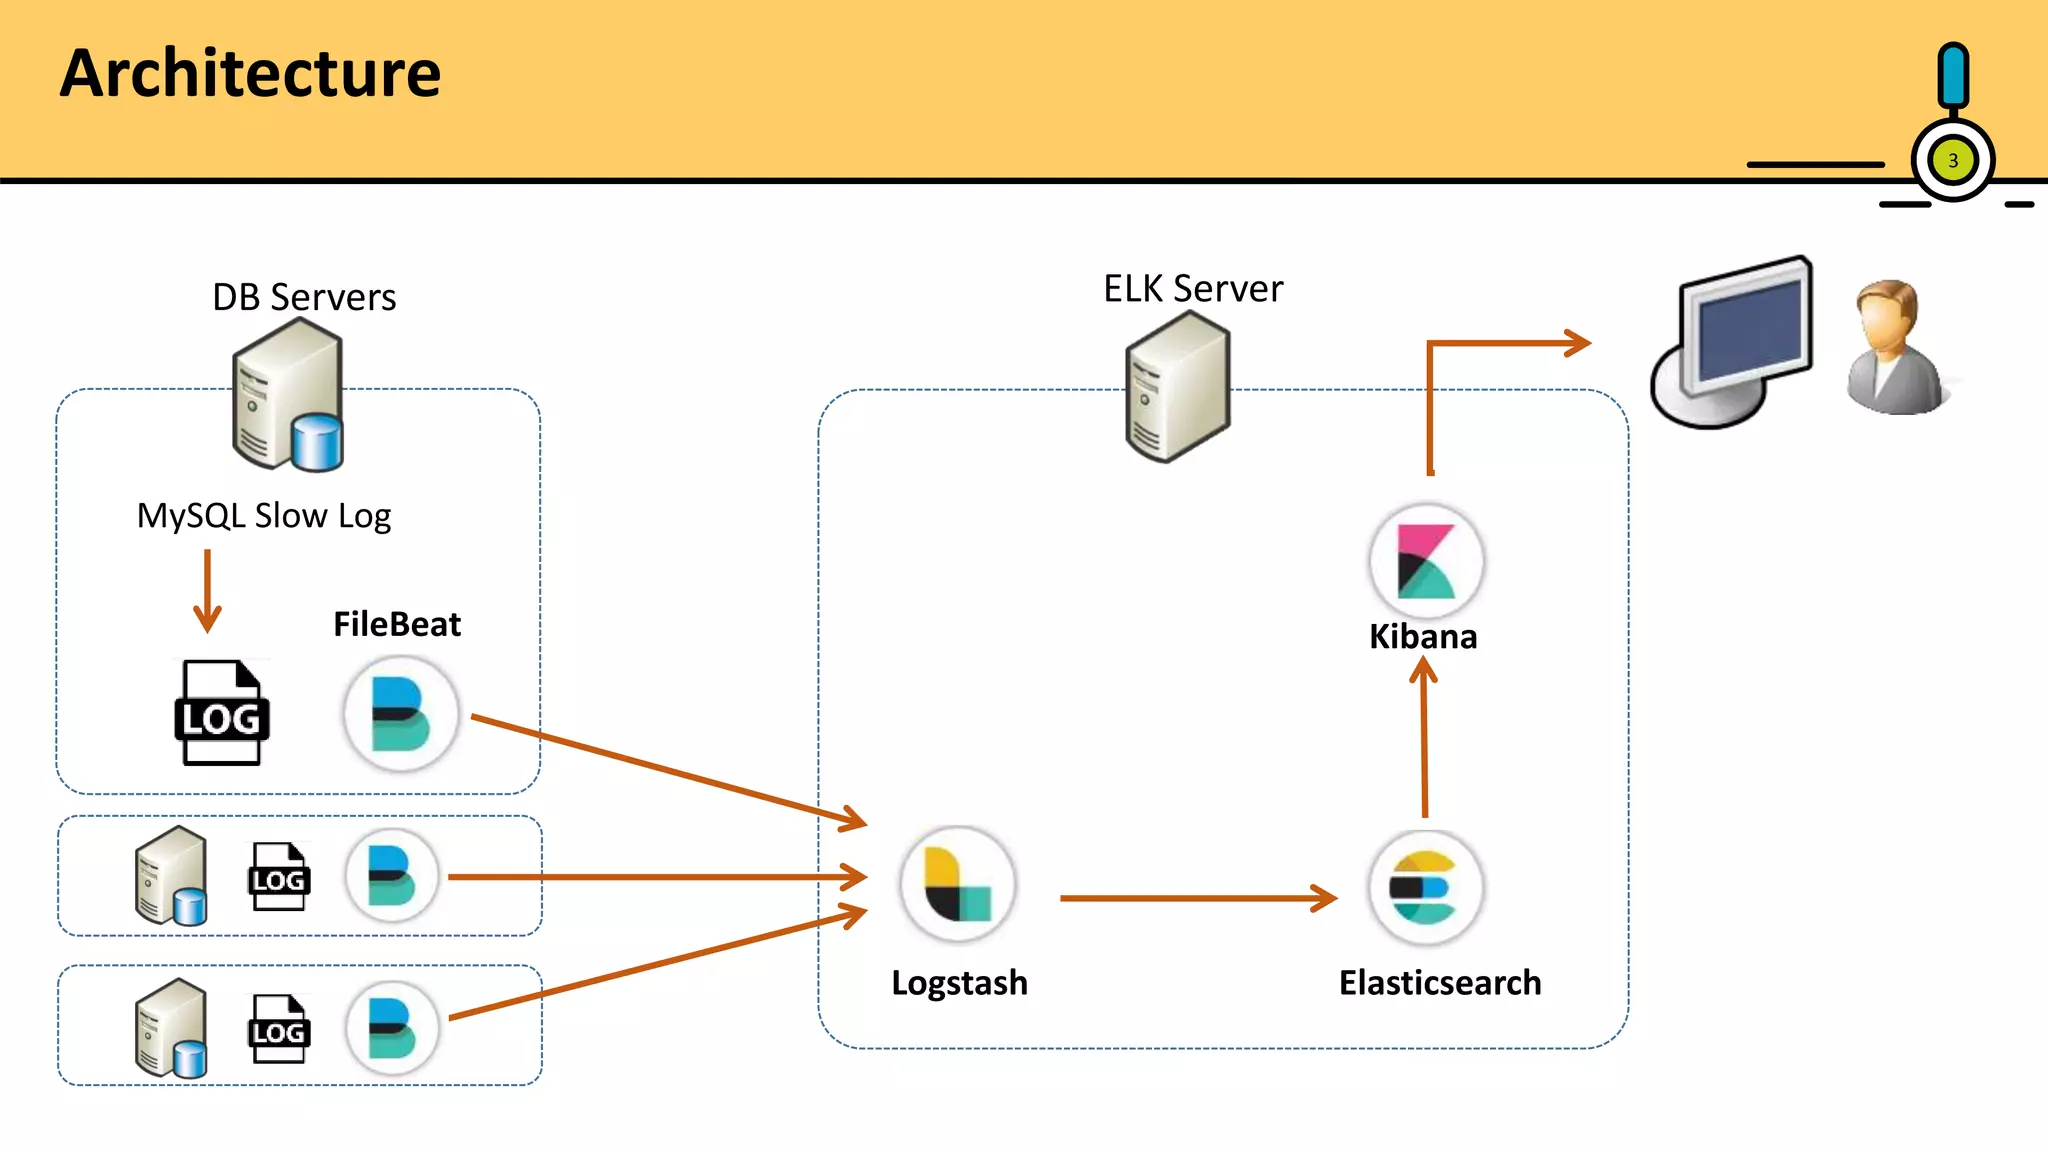
This document provides instructions for using Filebeat, Logstash, Elasticsearch, and Kibana to monitor and visualize MySQL slow query logs. It describes installing and configuring each component on appropriate servers to ship MySQL slow logs from database servers to Logstash for processing, indexing to Elasticsearch for search and analysis, and visualization of slow query trends and details in Kibana dashboards and graphs.
Introduction to monitoring MySQL slow query logs using Beats and ELK stack.
Personal introduction of the presenter with an email contact.
Overview of the architecture involving DB servers, ELK Server (Logstash, Elasticsearch, FileBeat, Kibana) for slow log processing.
Steps to install FileBeat on DB servers and configure it for collecting MySQL slow query logs.
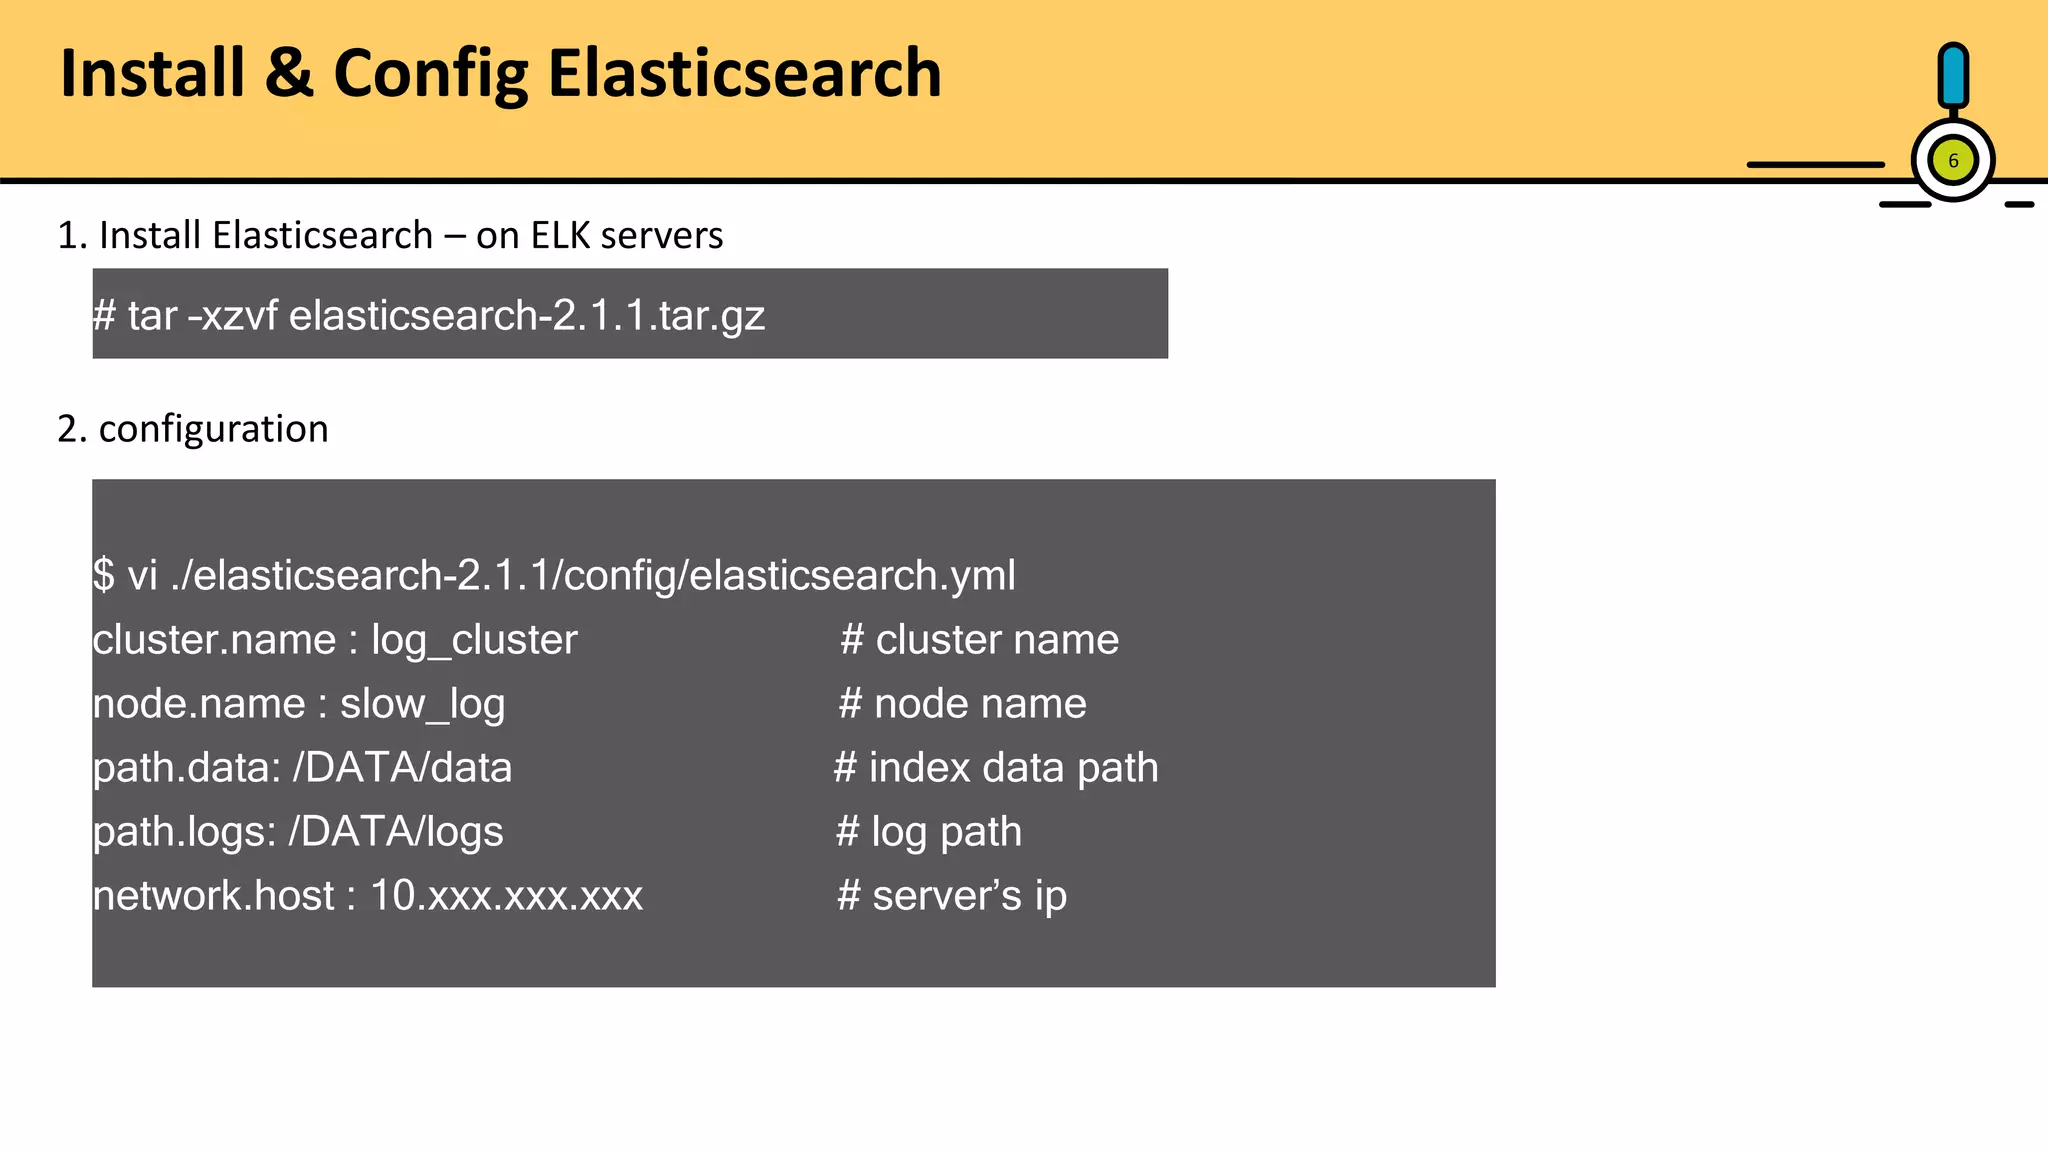
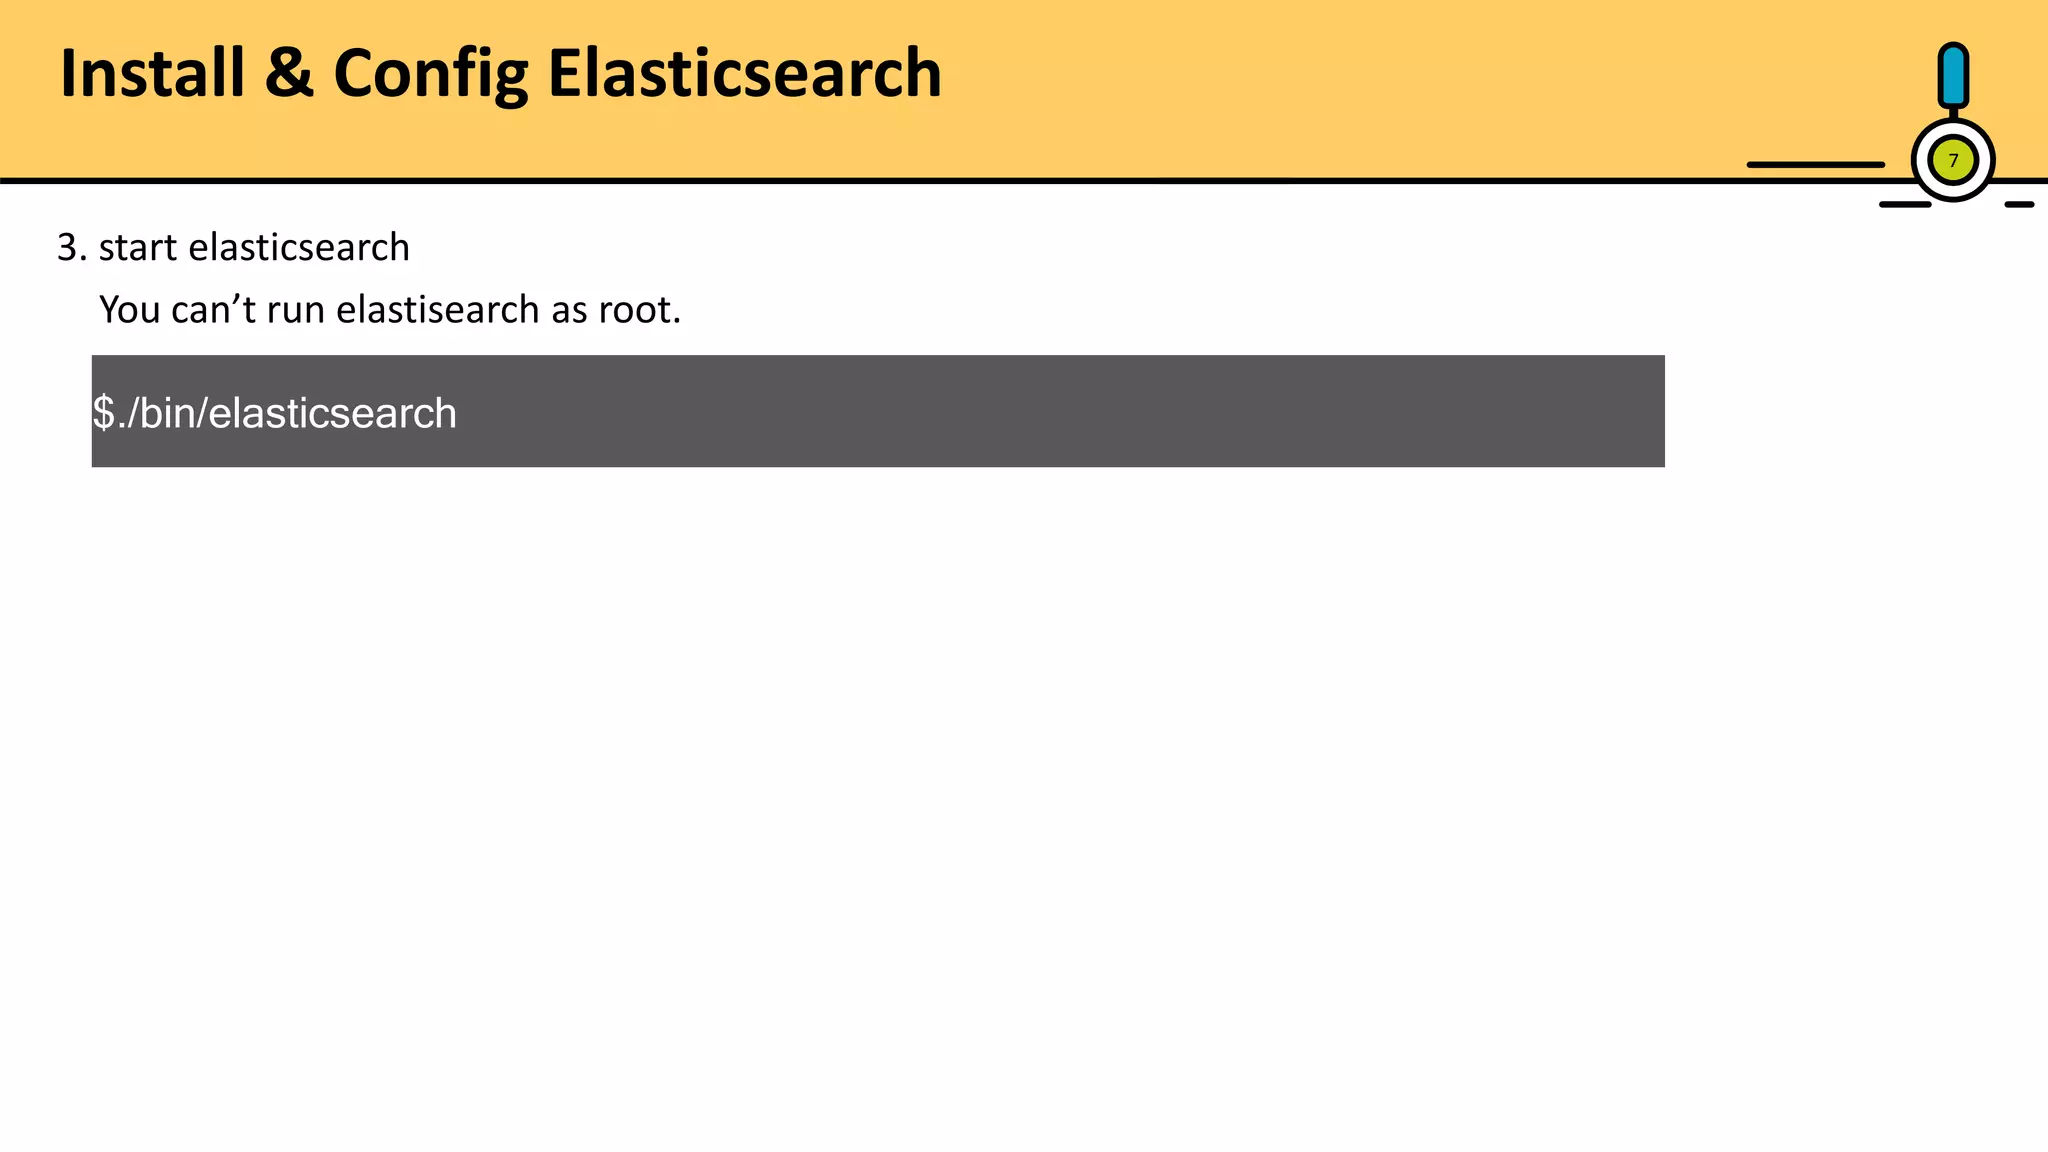
Installation steps for Elasticsearch on ELK servers including configuration of cluster and node settings.
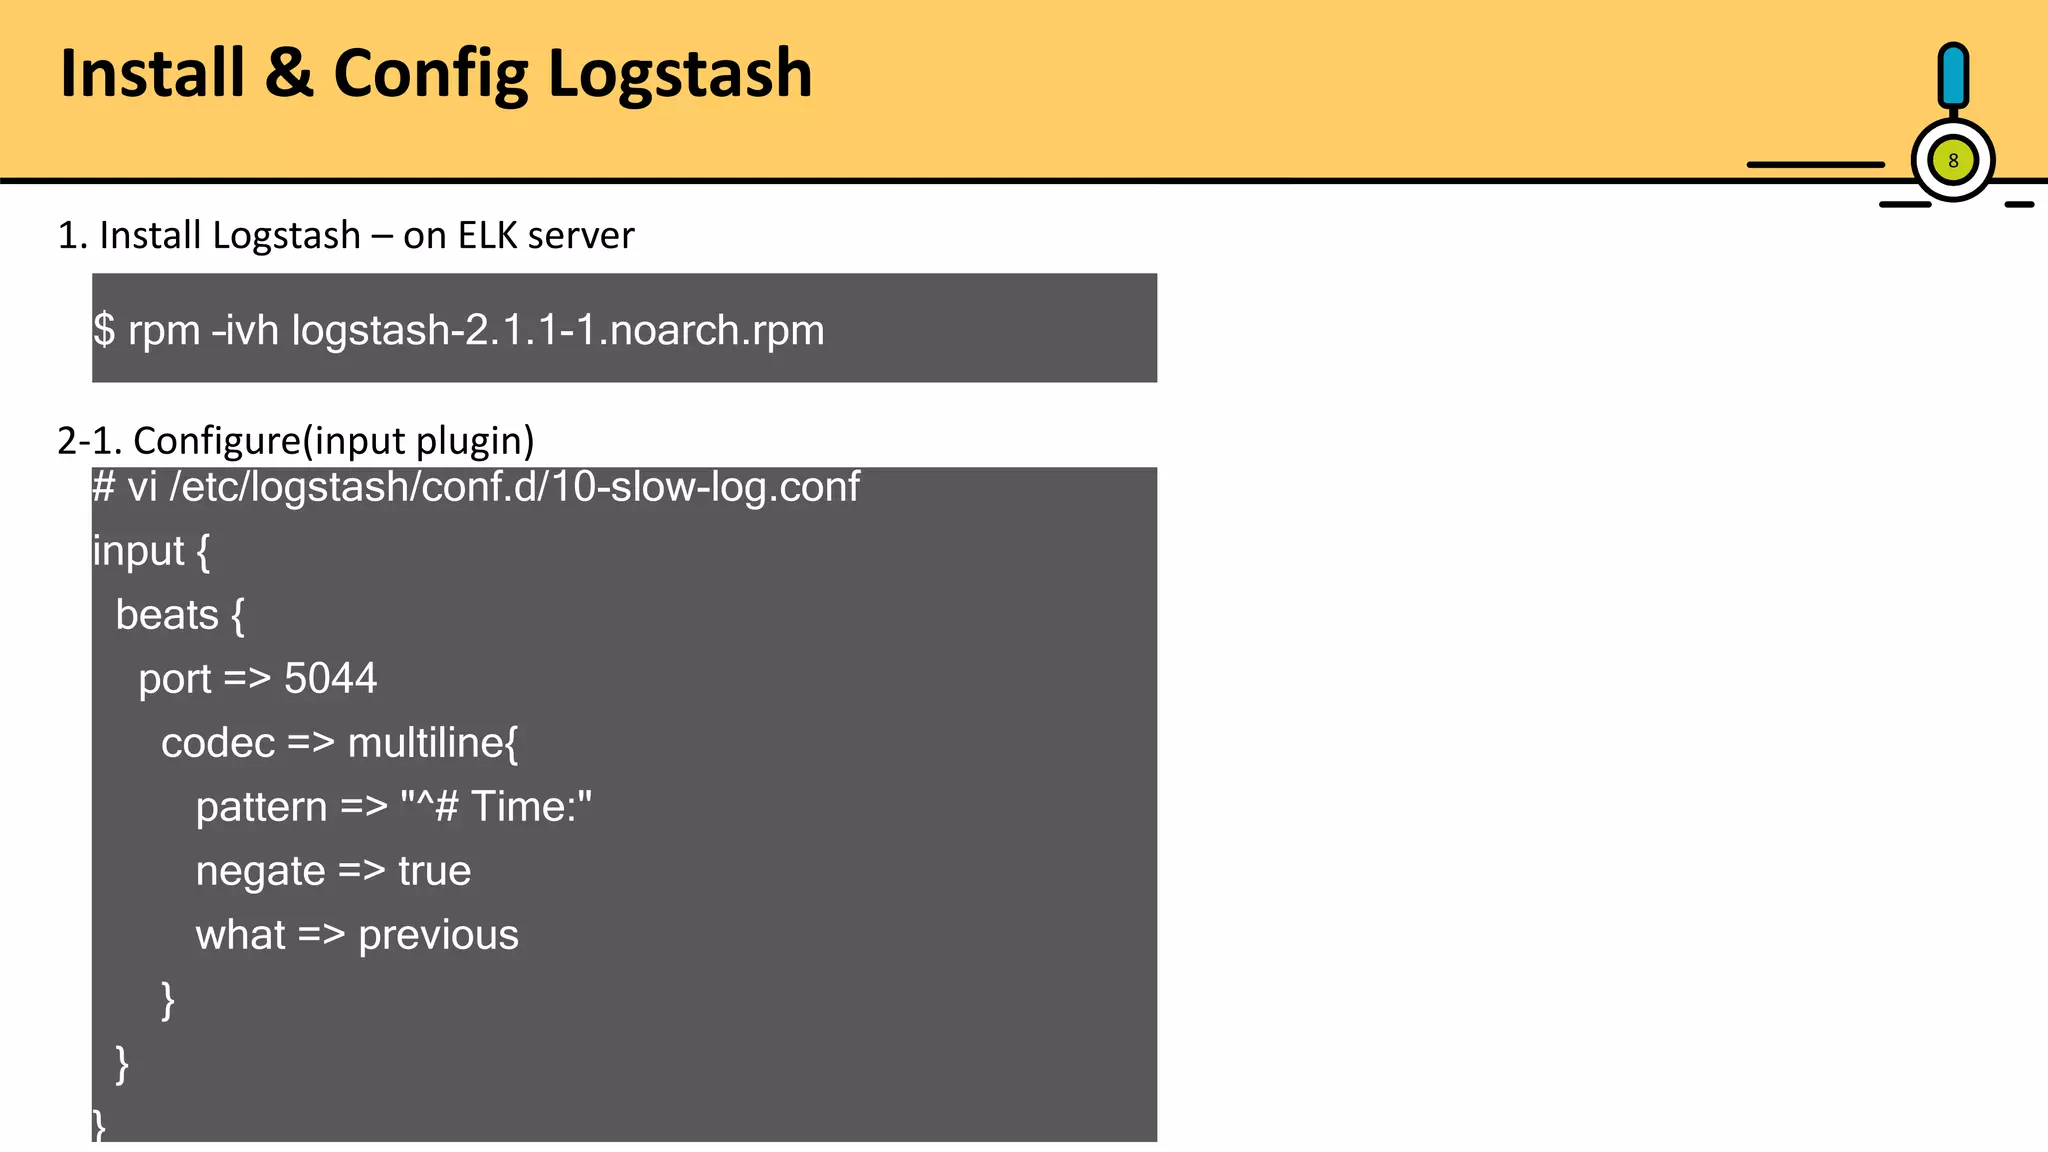
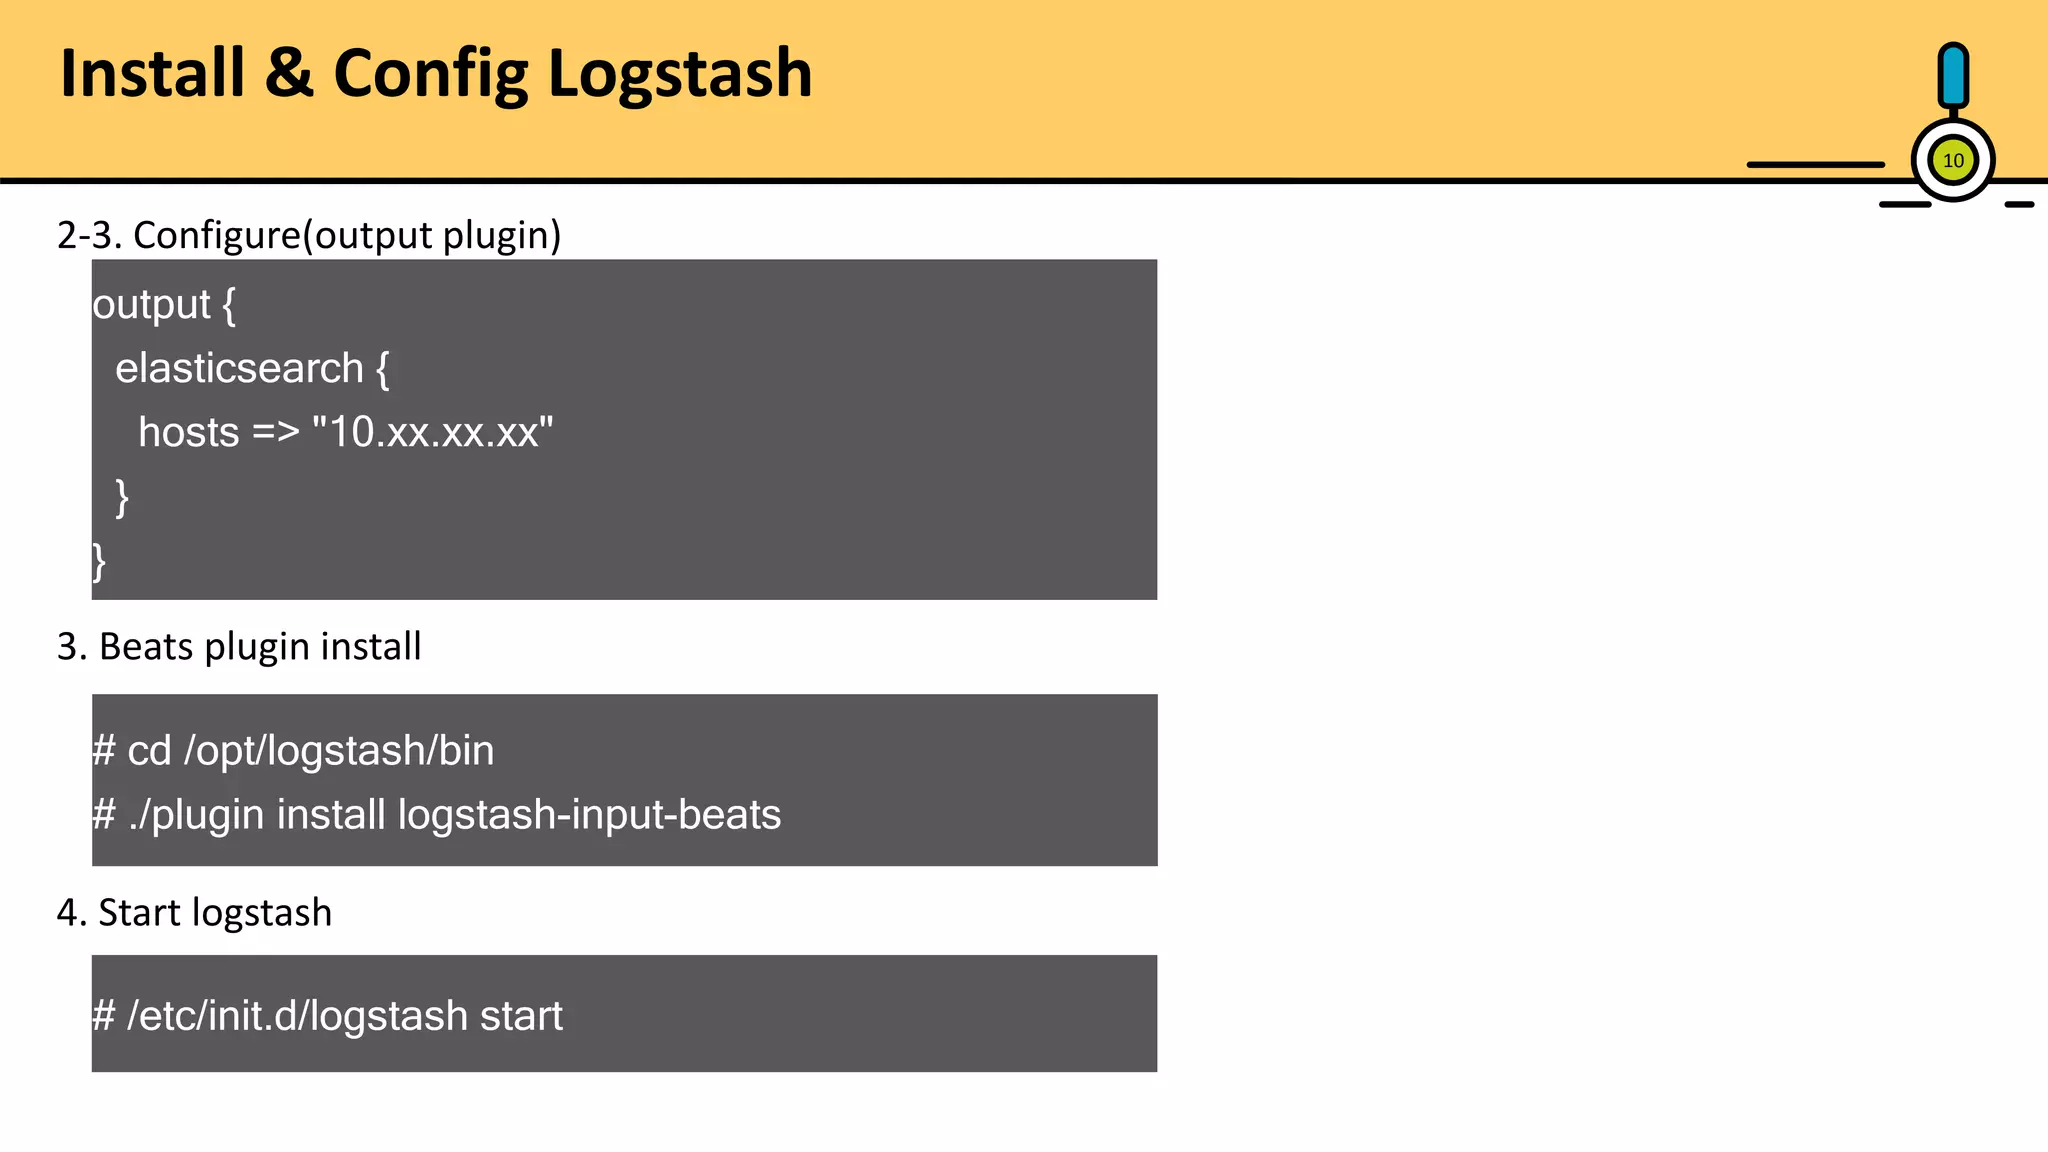
Installation of Logstash, including input, filter, and output plugin configurations to process MySQL slow logs.
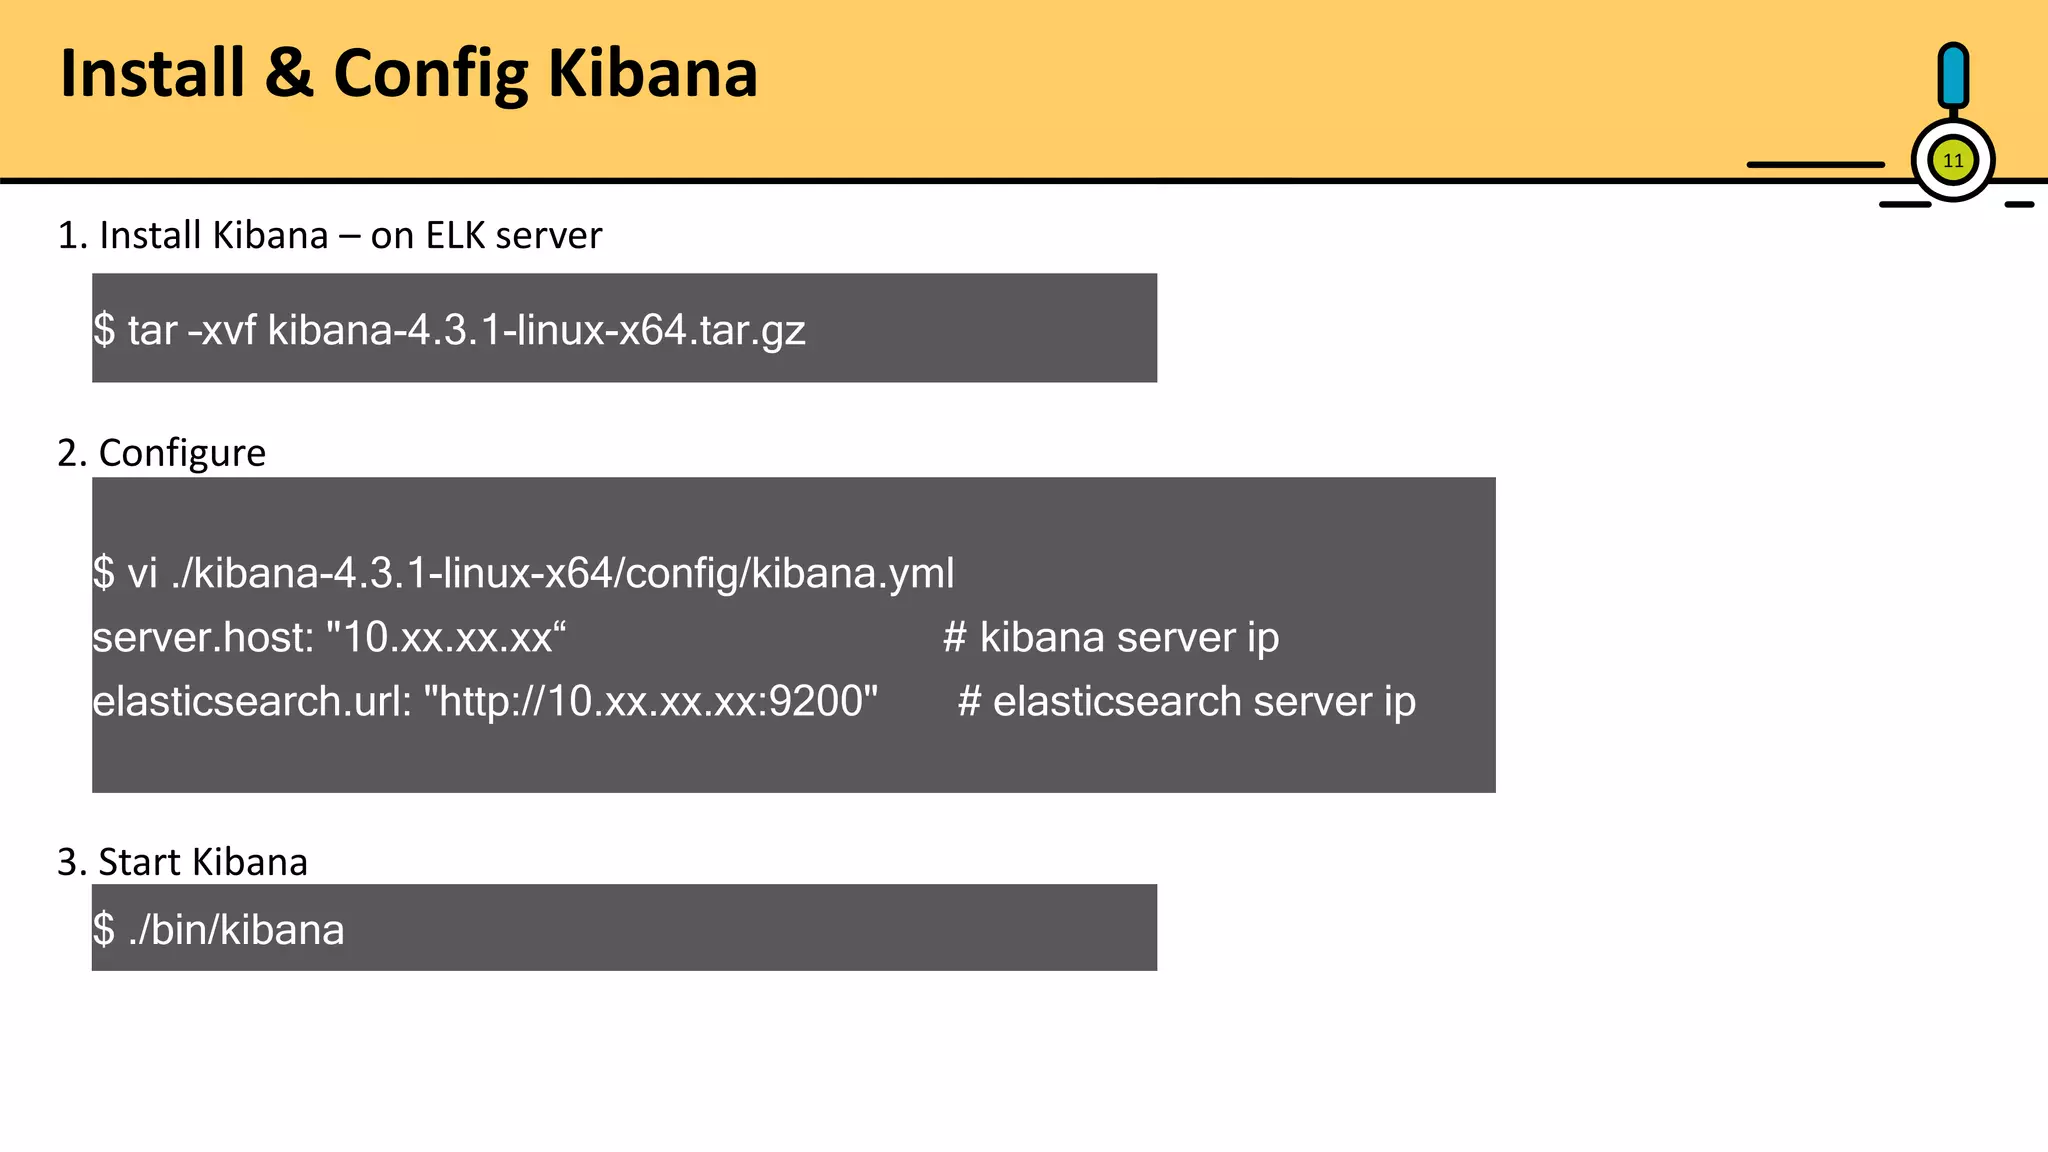
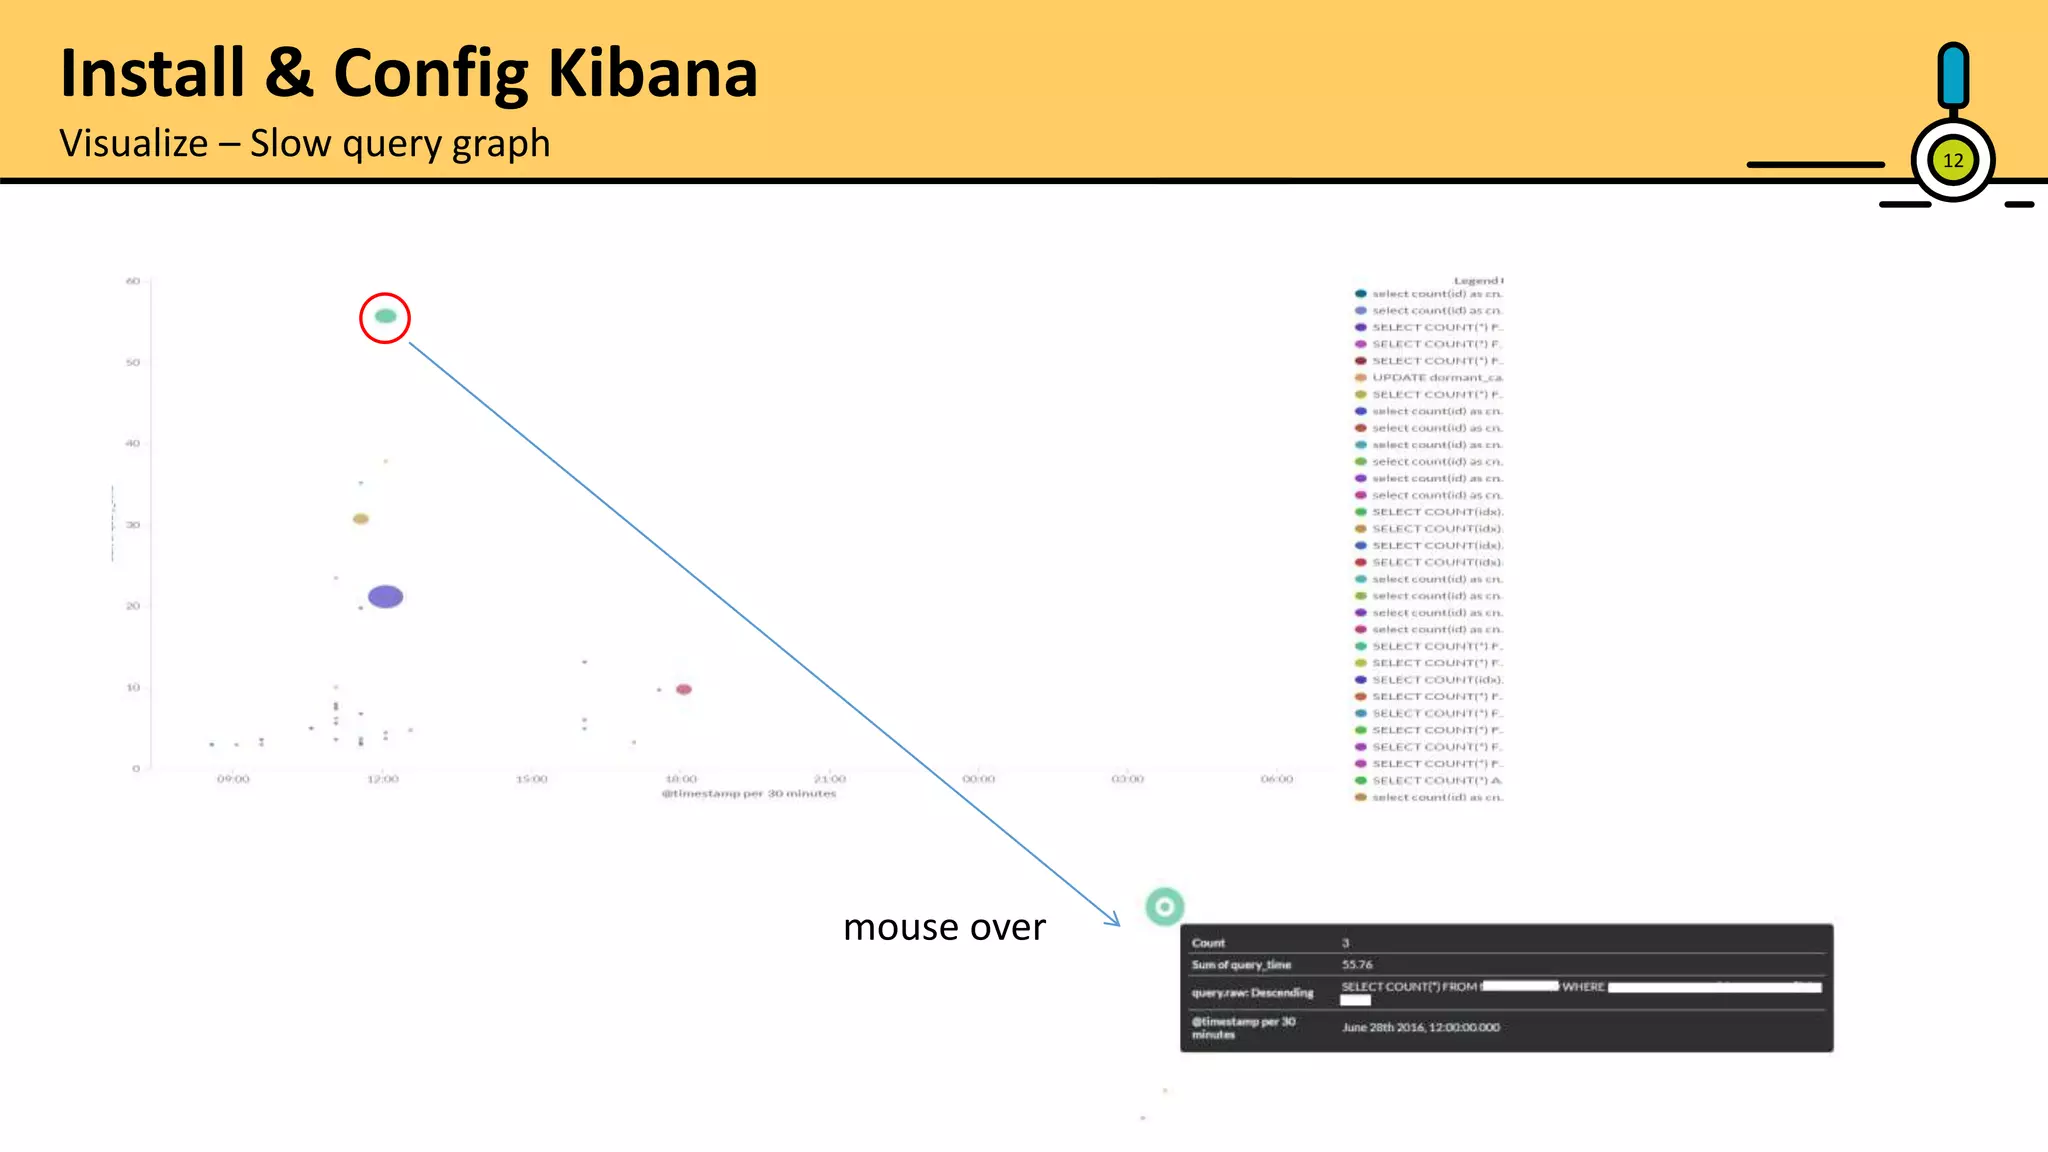
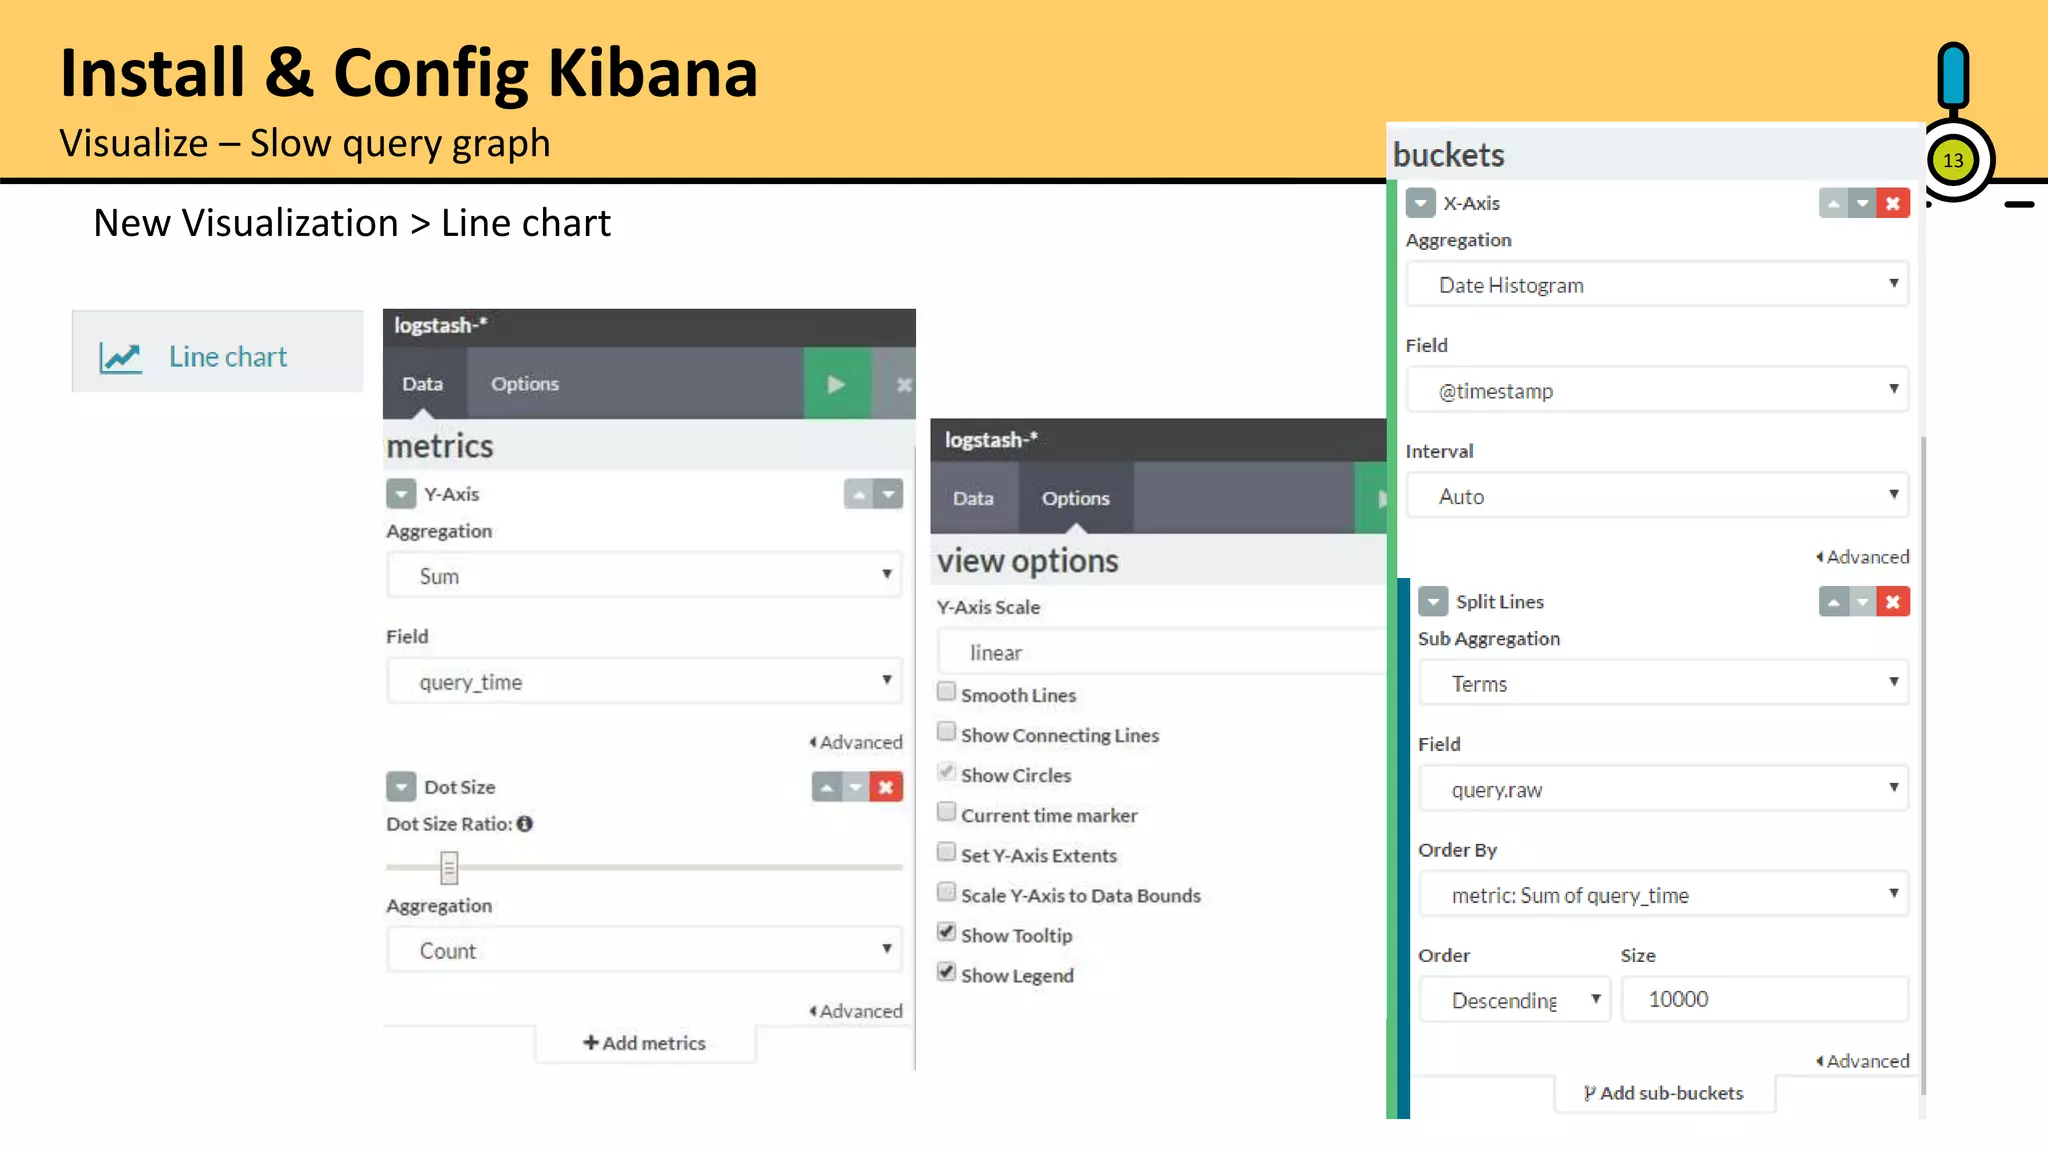
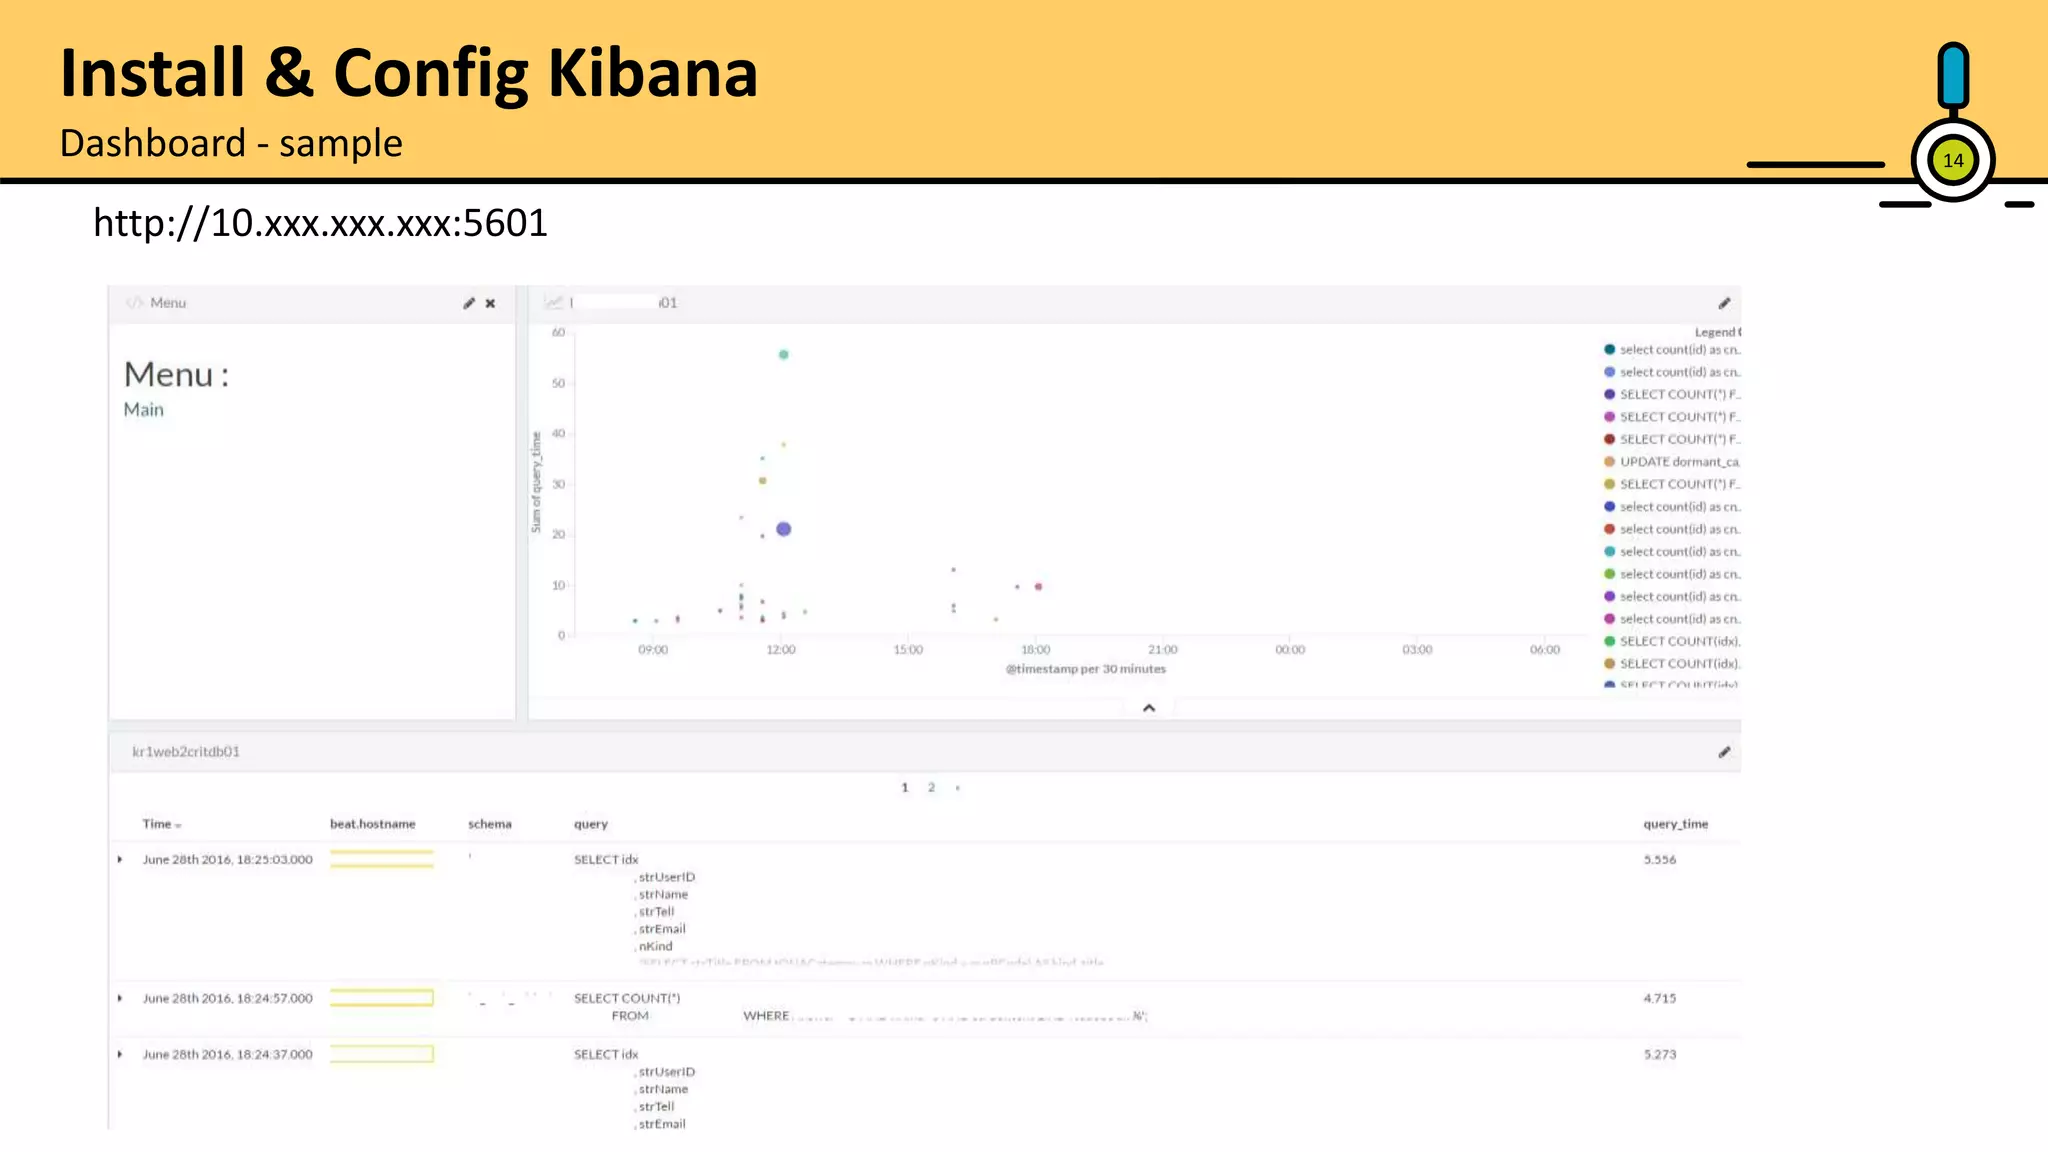
Steps for installing Kibana, its configuration, and creating visualizations and dashboards for slow query data.
Final thanks and closing remarks from the presenter.