Download to read offline


![Implementing readiness and liveliness 1. Add health checks with tags 2. Register multiple endpoints with filter using Options predicate /api/v1/… /health /health/ready /health/lively app.UseHealthChecks("/health/ready", new HealthCheckOptions() { Predicate = reg => reg.Tags.Contains("ready") }); services.AddHealthChecks() .AddCheck<CircuitBreakerHealthCheck>( "circuitbreakers", tags: new string[] { "ready" }); app.UseHealthChecks("/health/lively", new HealthCheckOptions() { Predicate = _ => true });](https://image.slidesharecdn.com/loggingtracingandinstrumentationin-210318171640/75/Logging-tracing-and-metrics-Instrumentation-in-NET-5-and-Azure-31-2048.jpg)

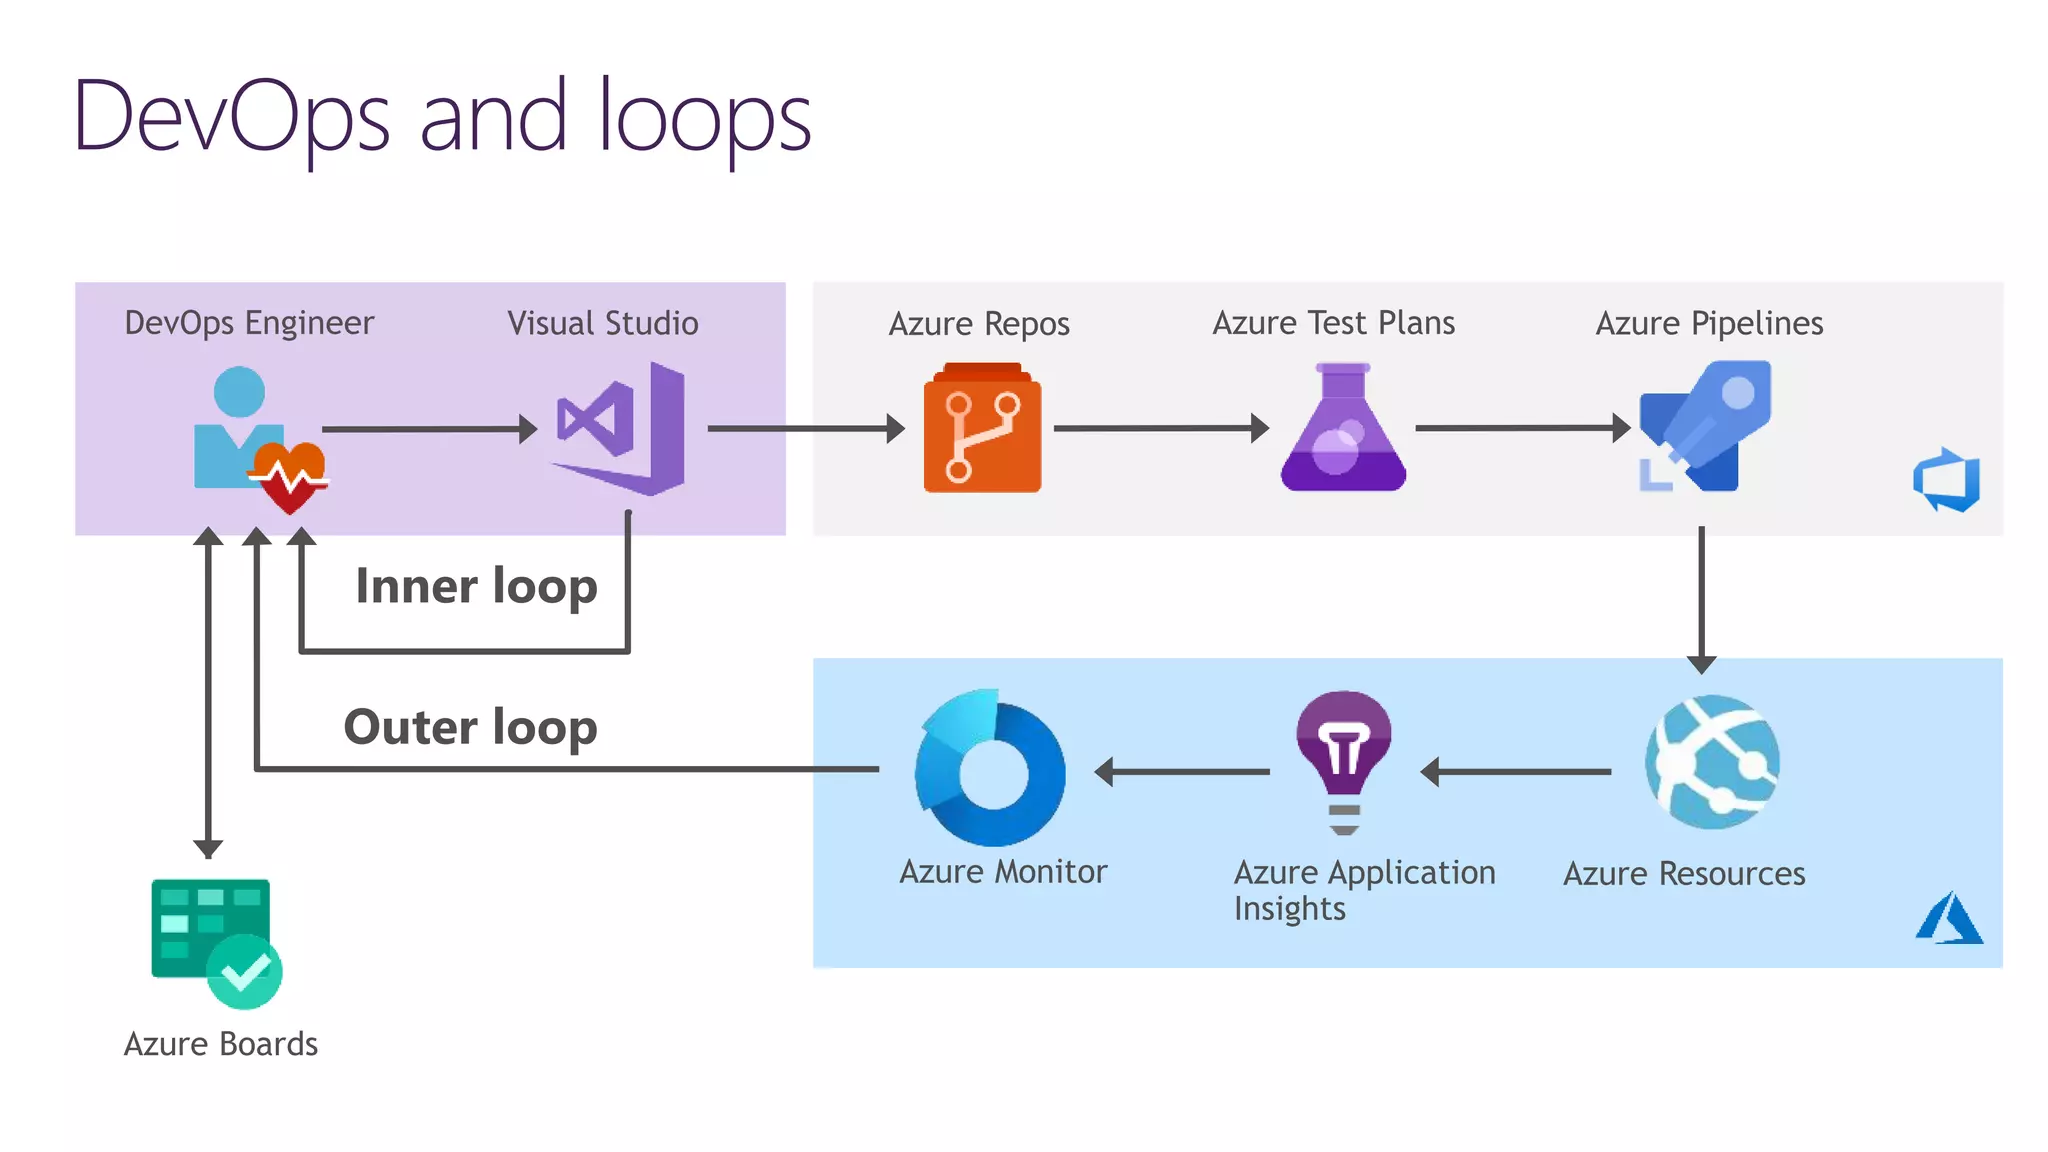
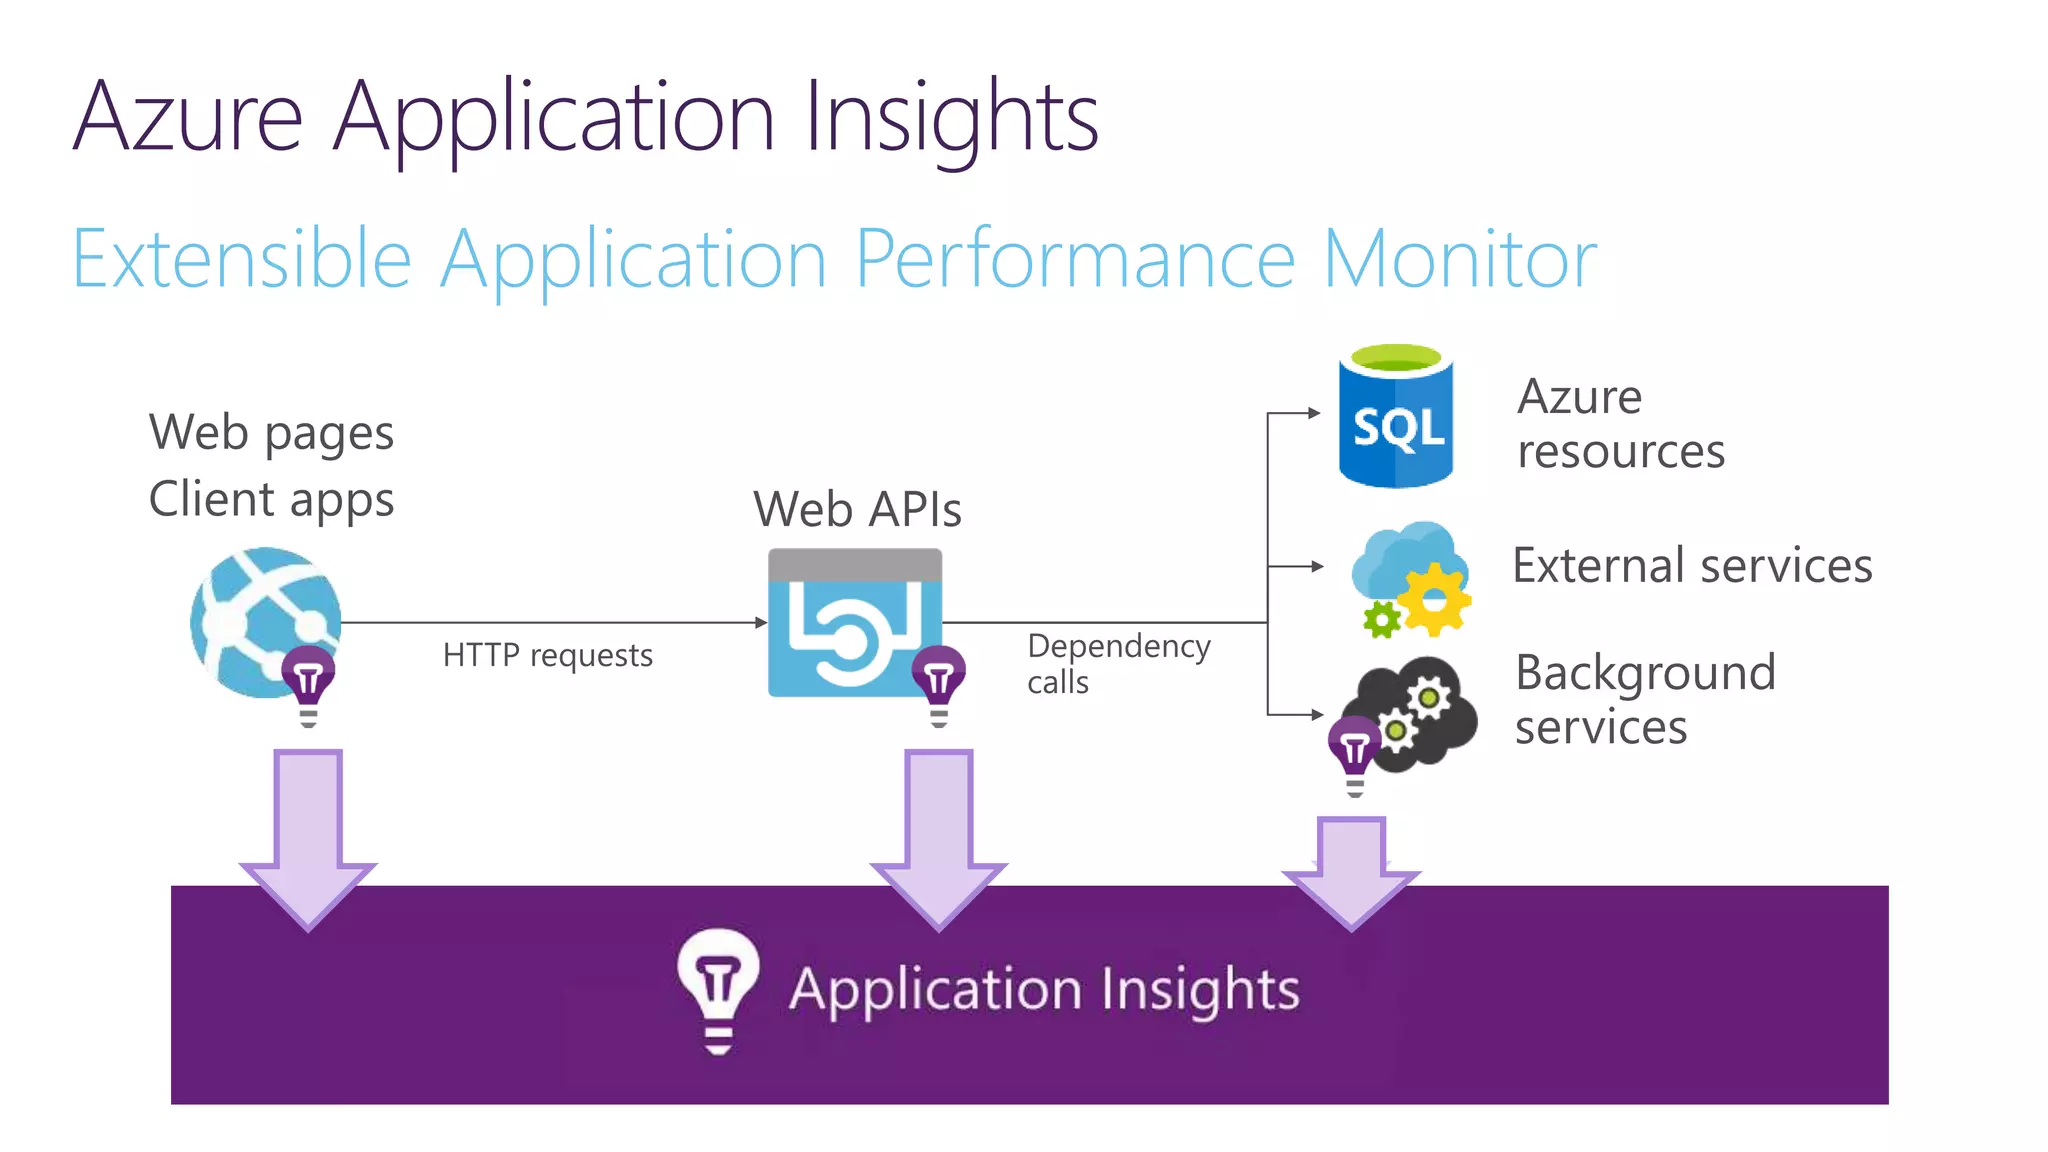
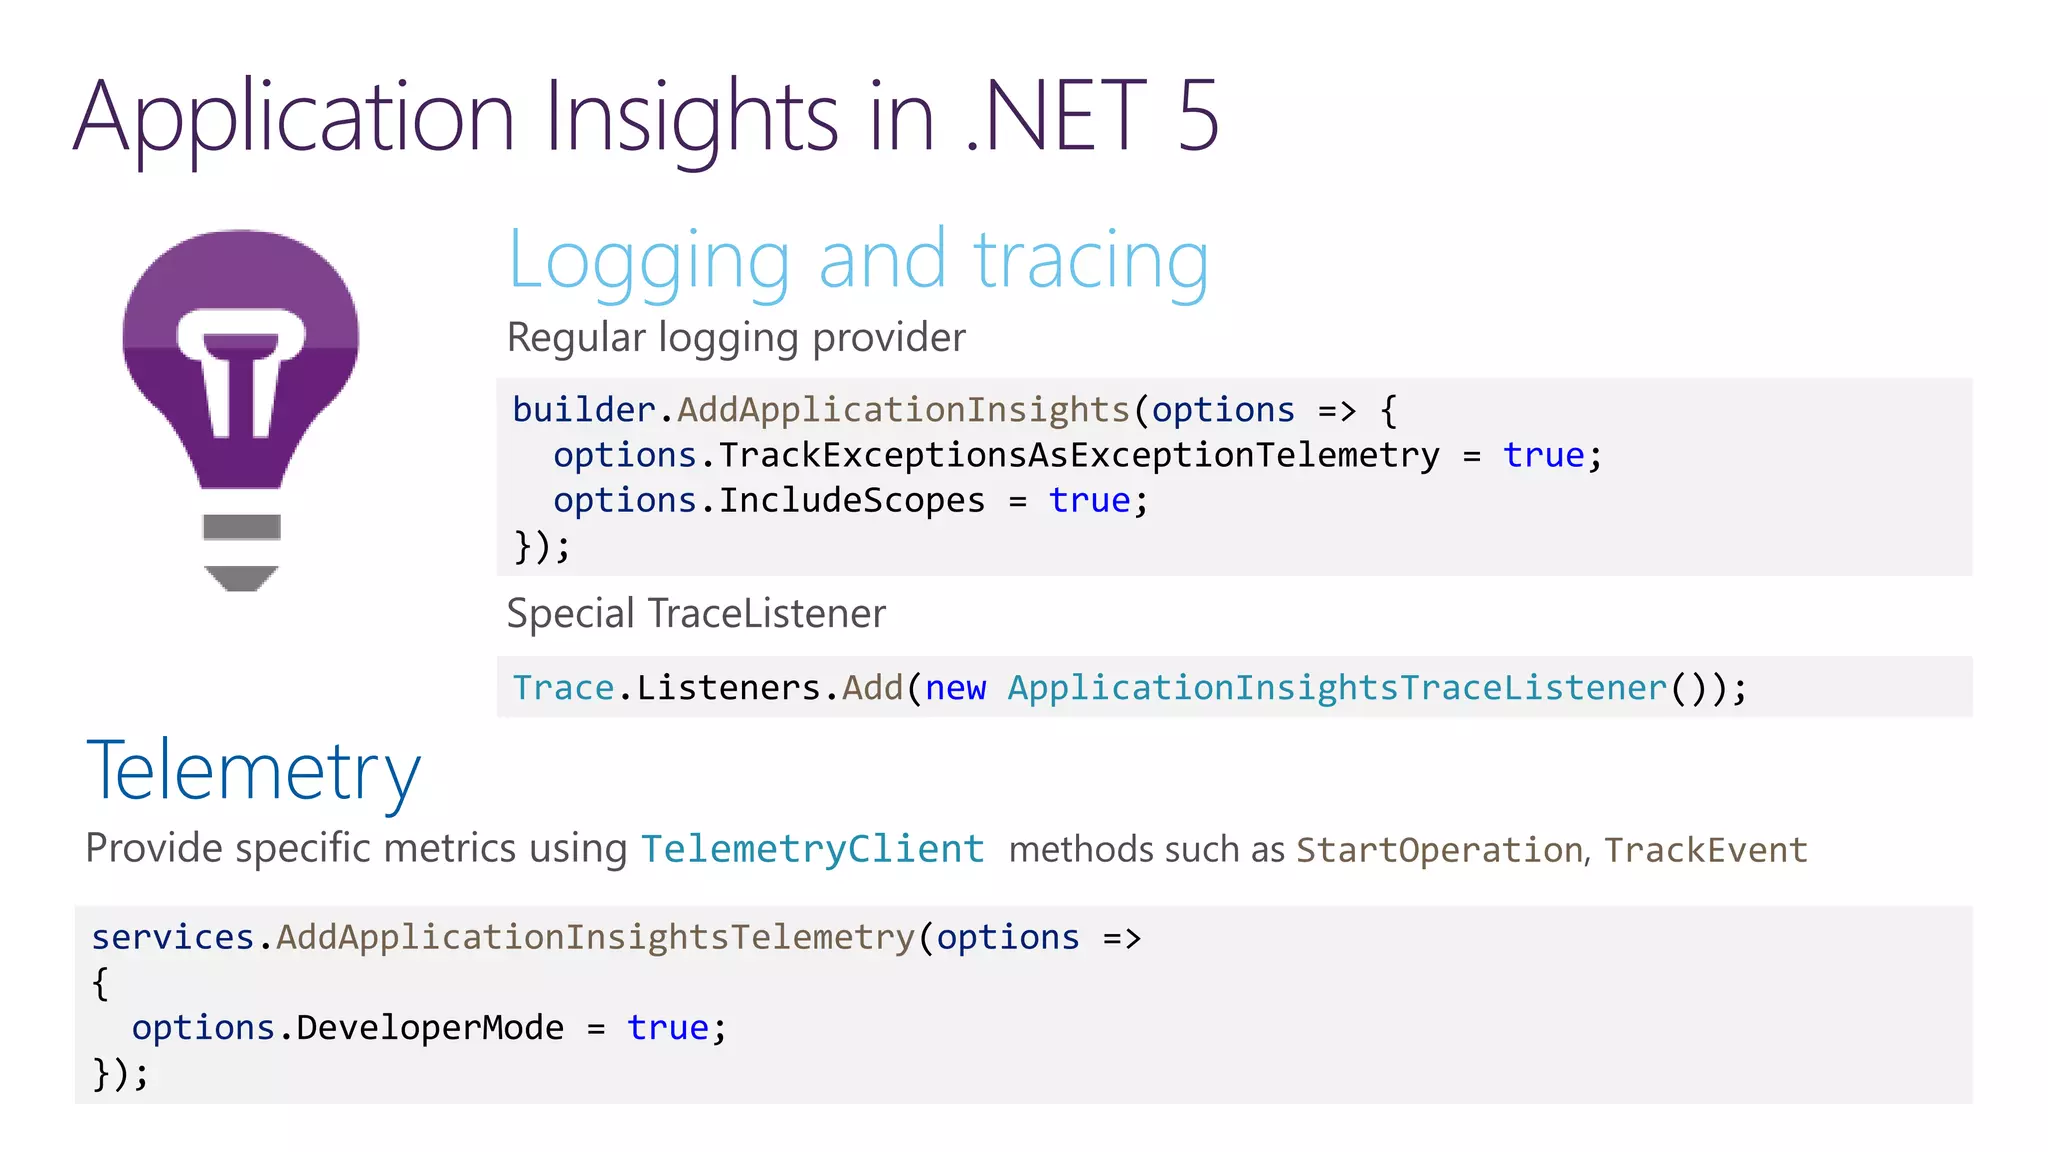
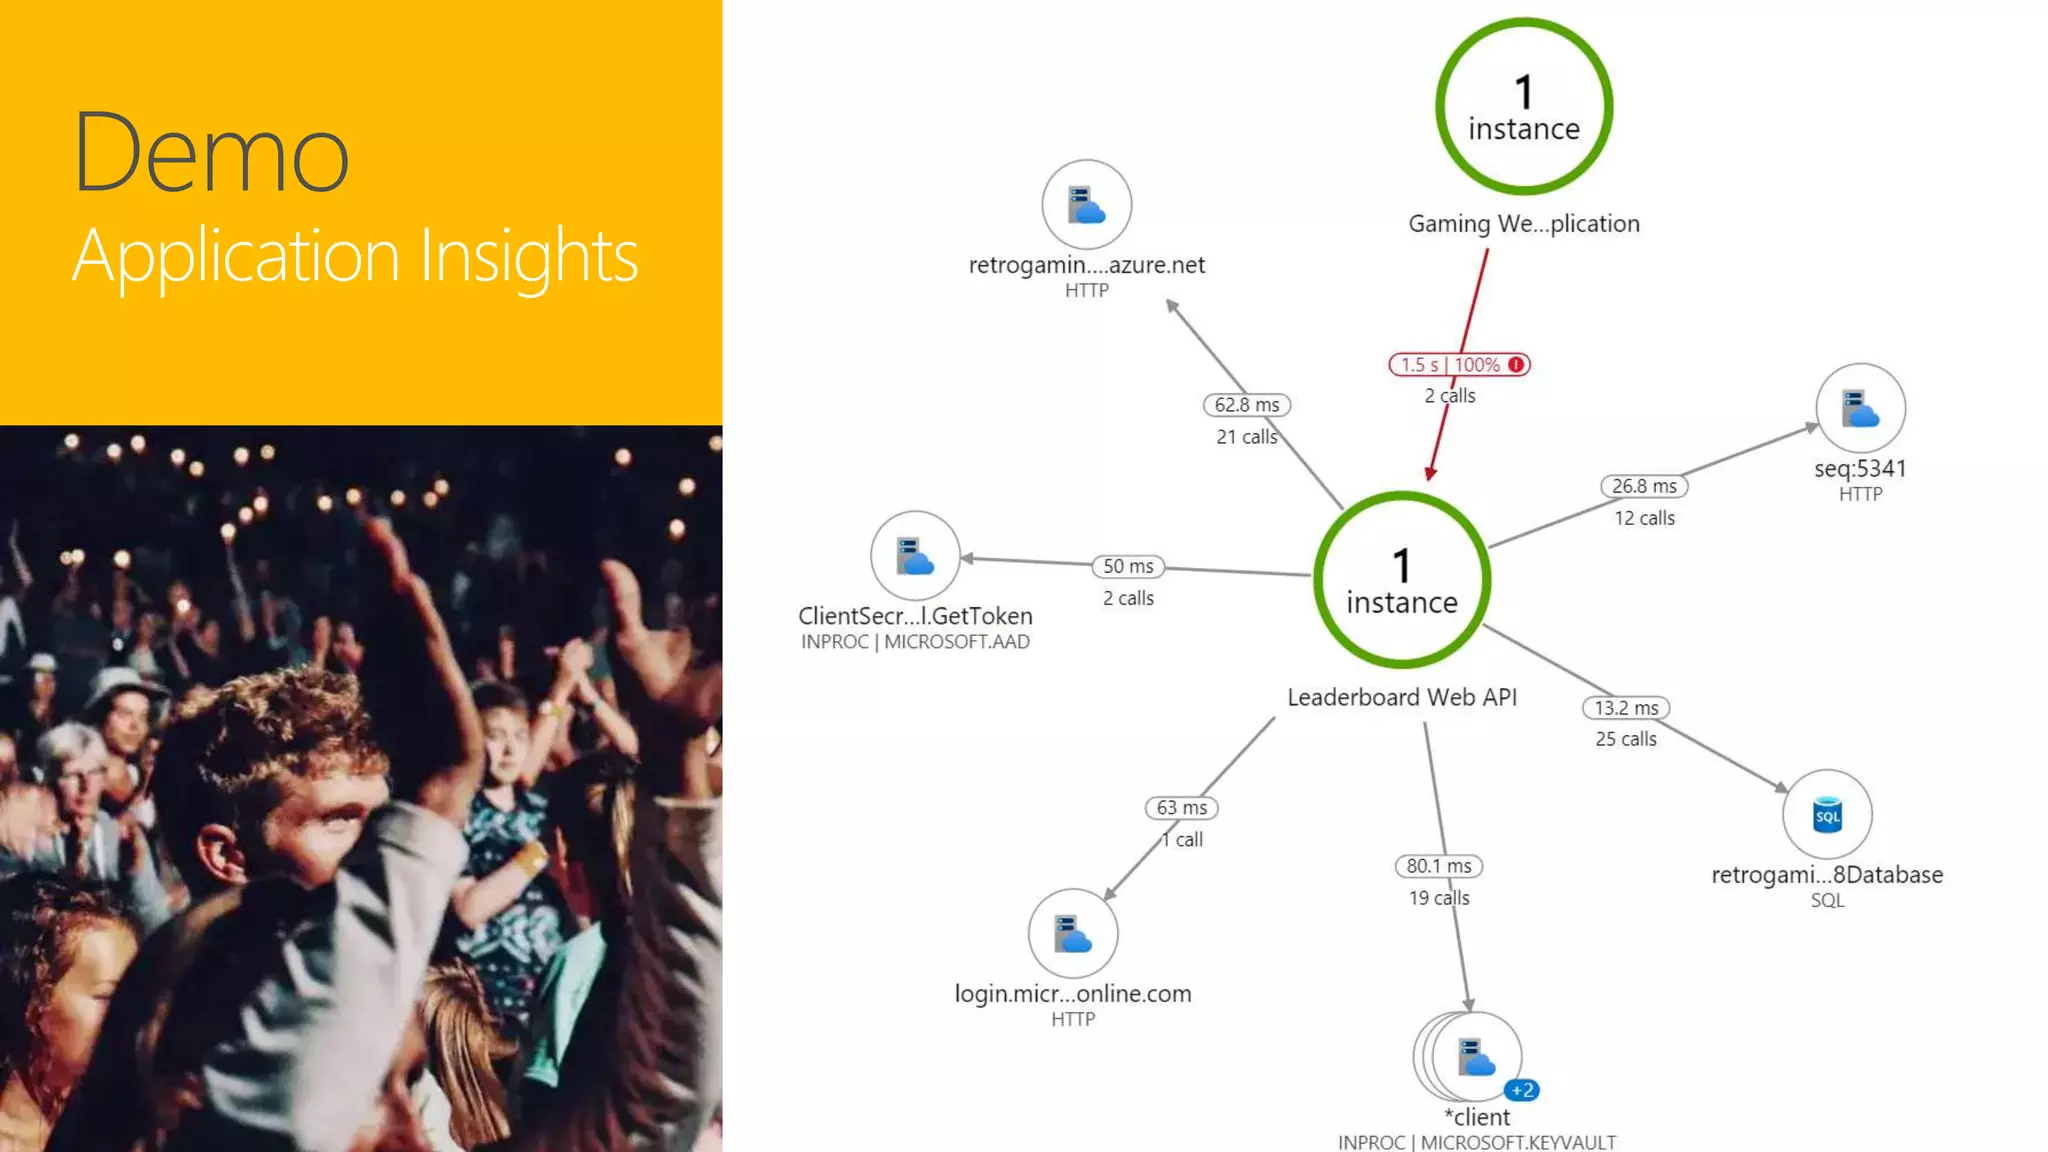
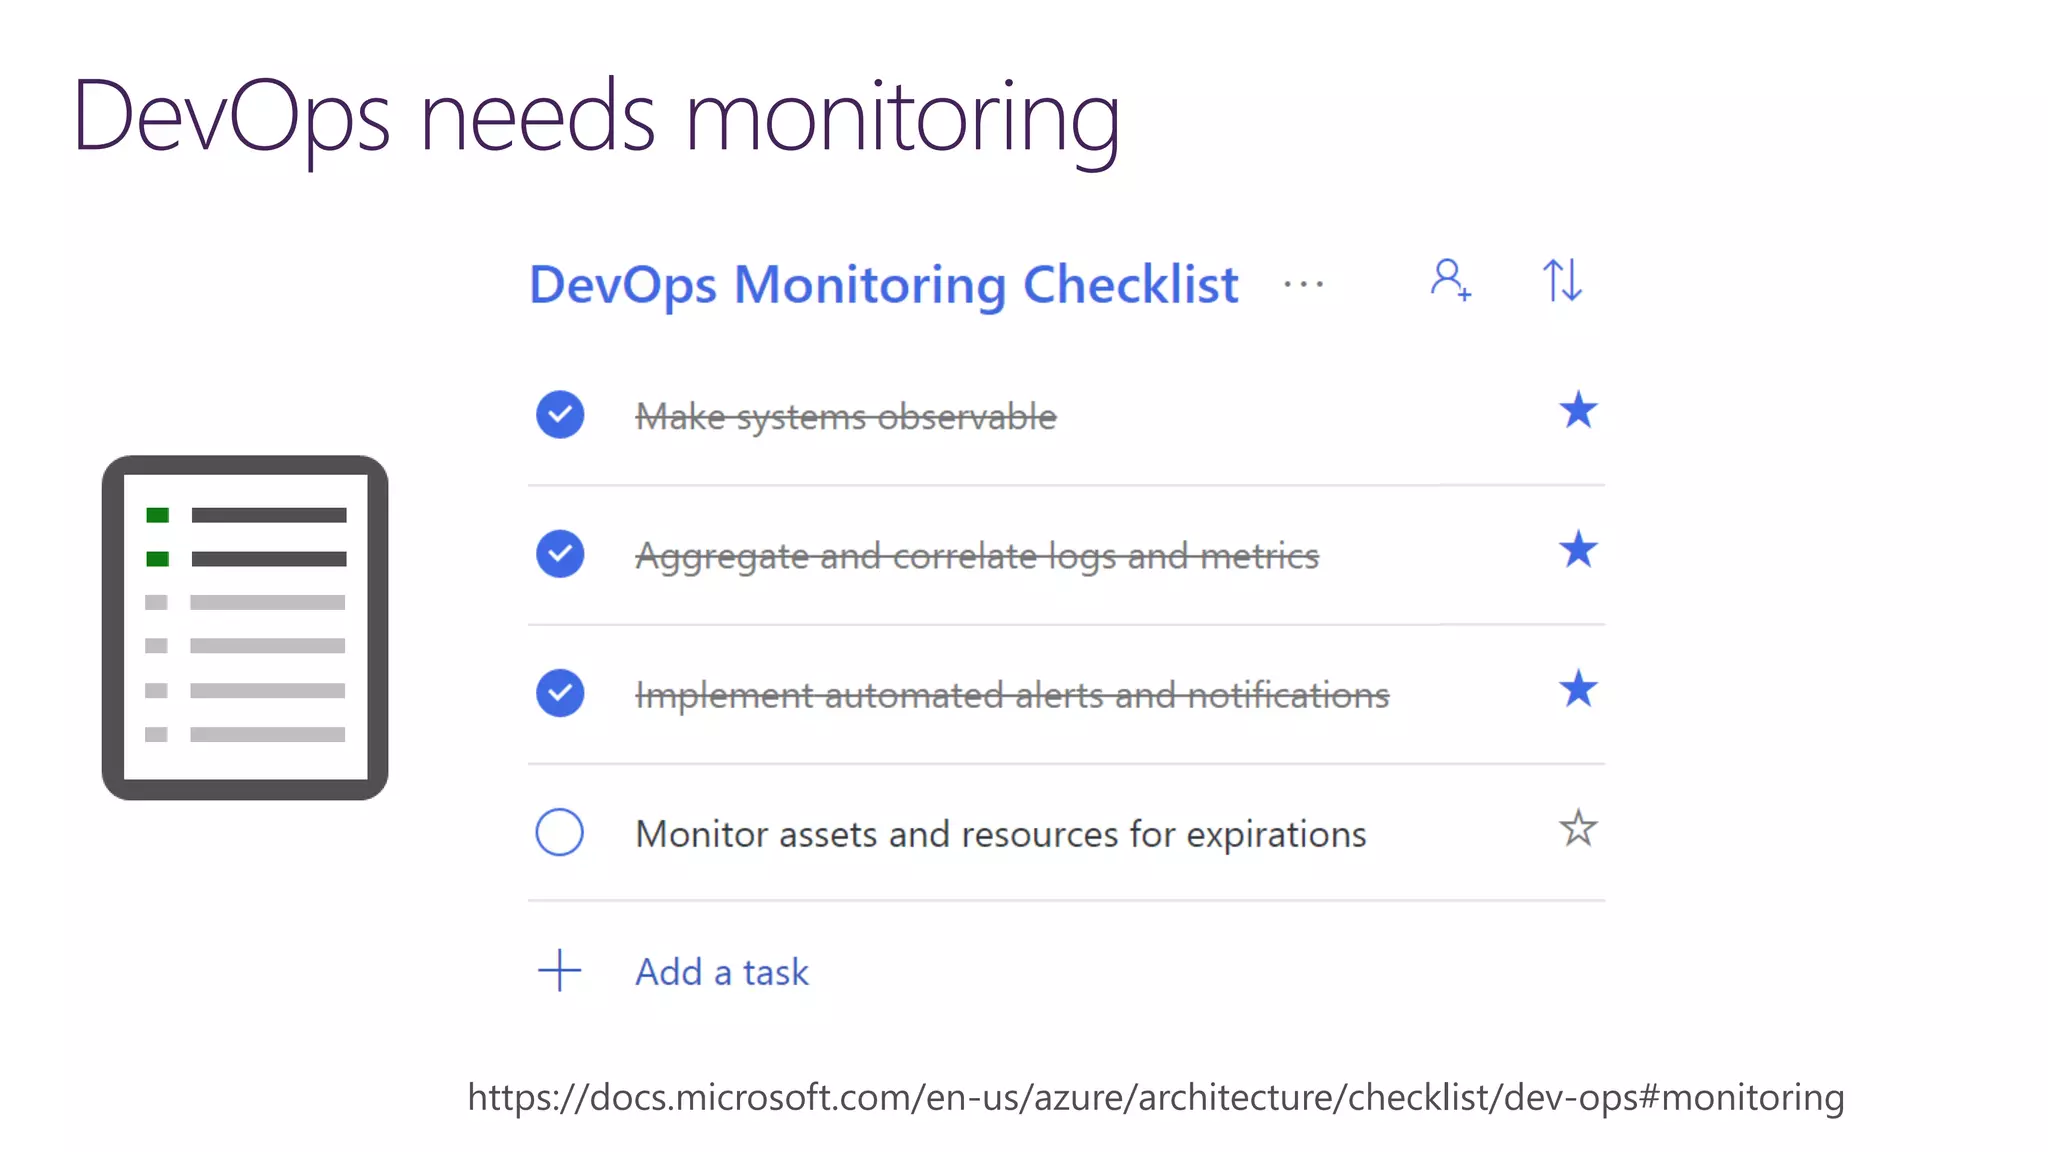


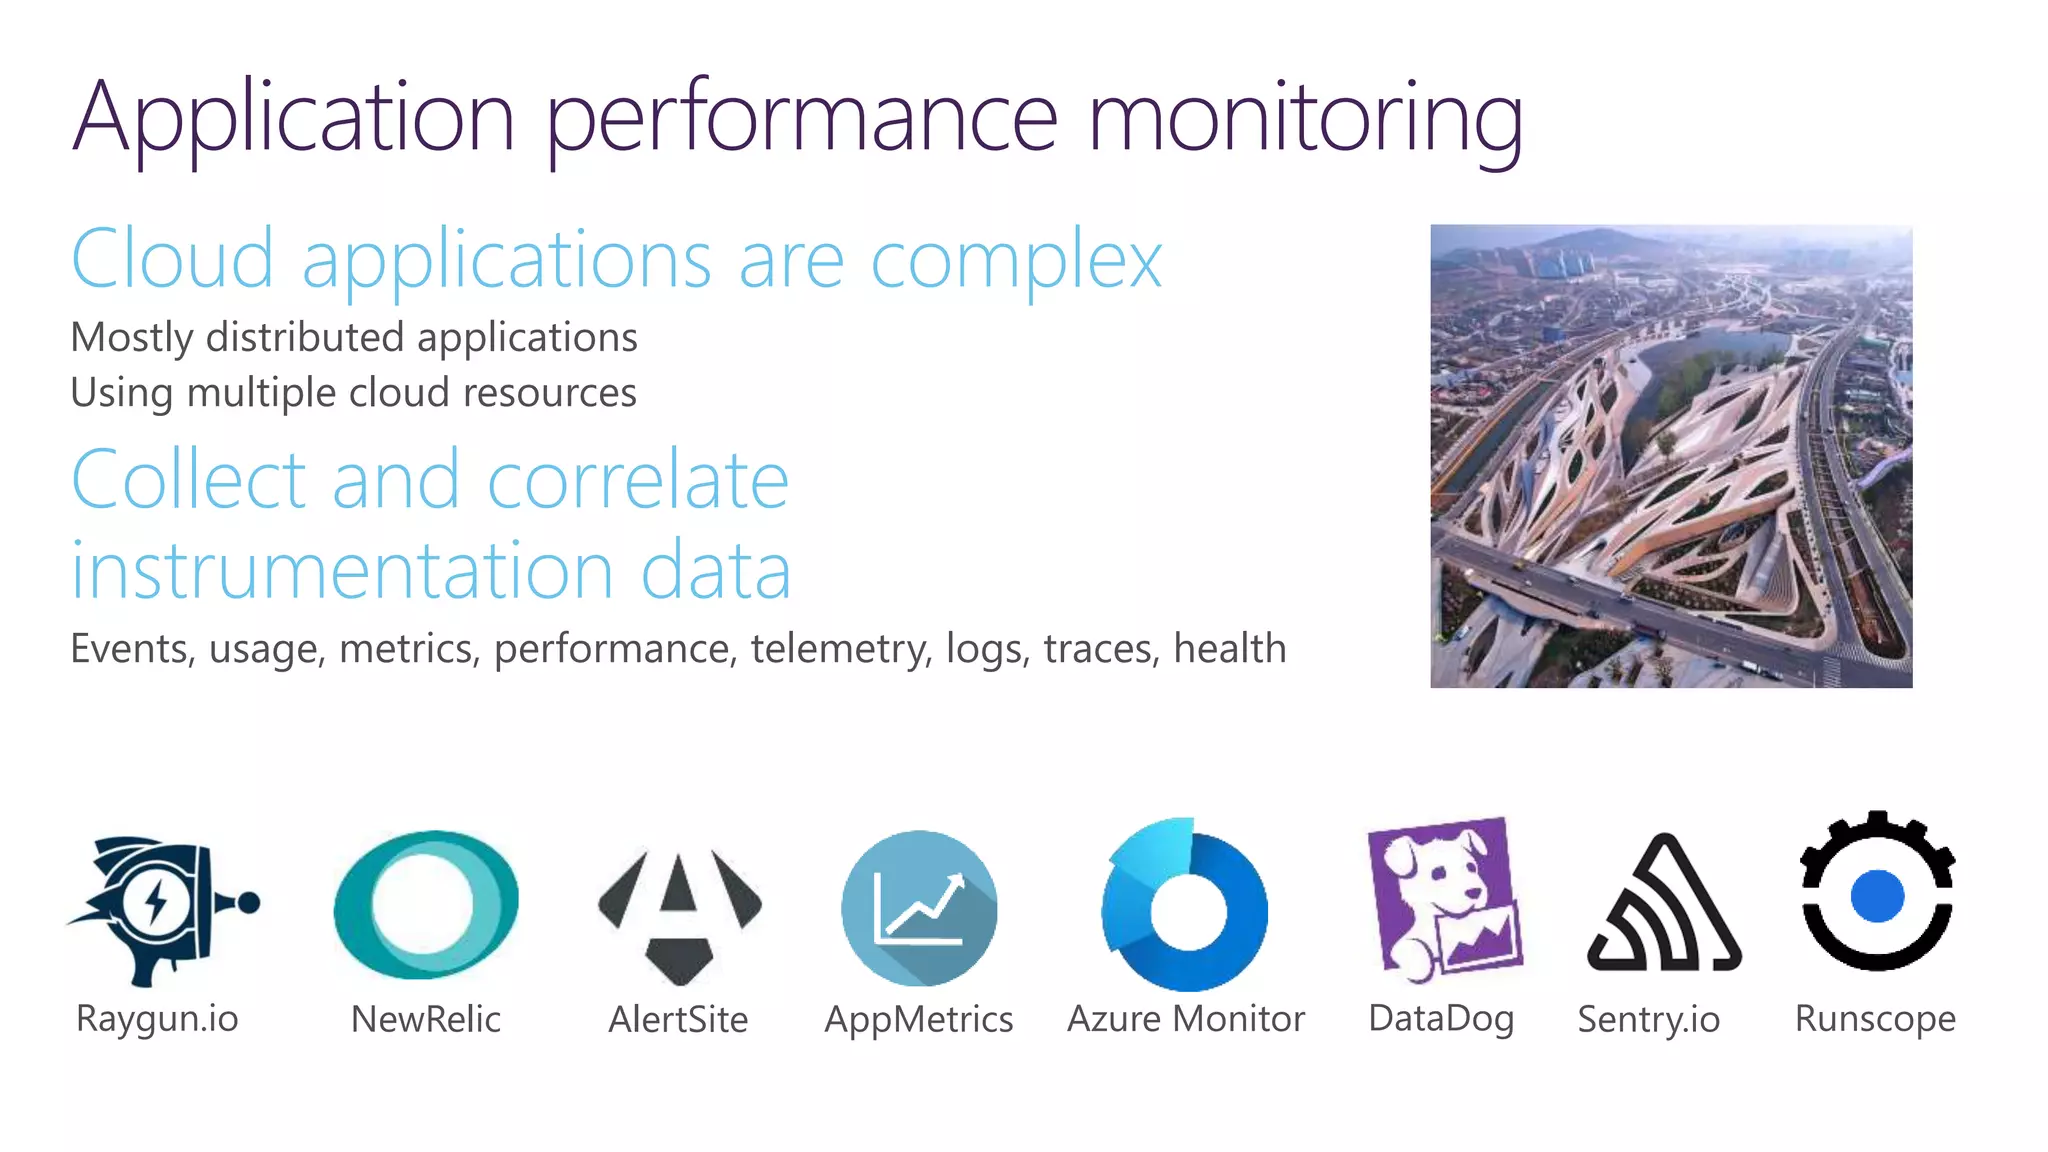
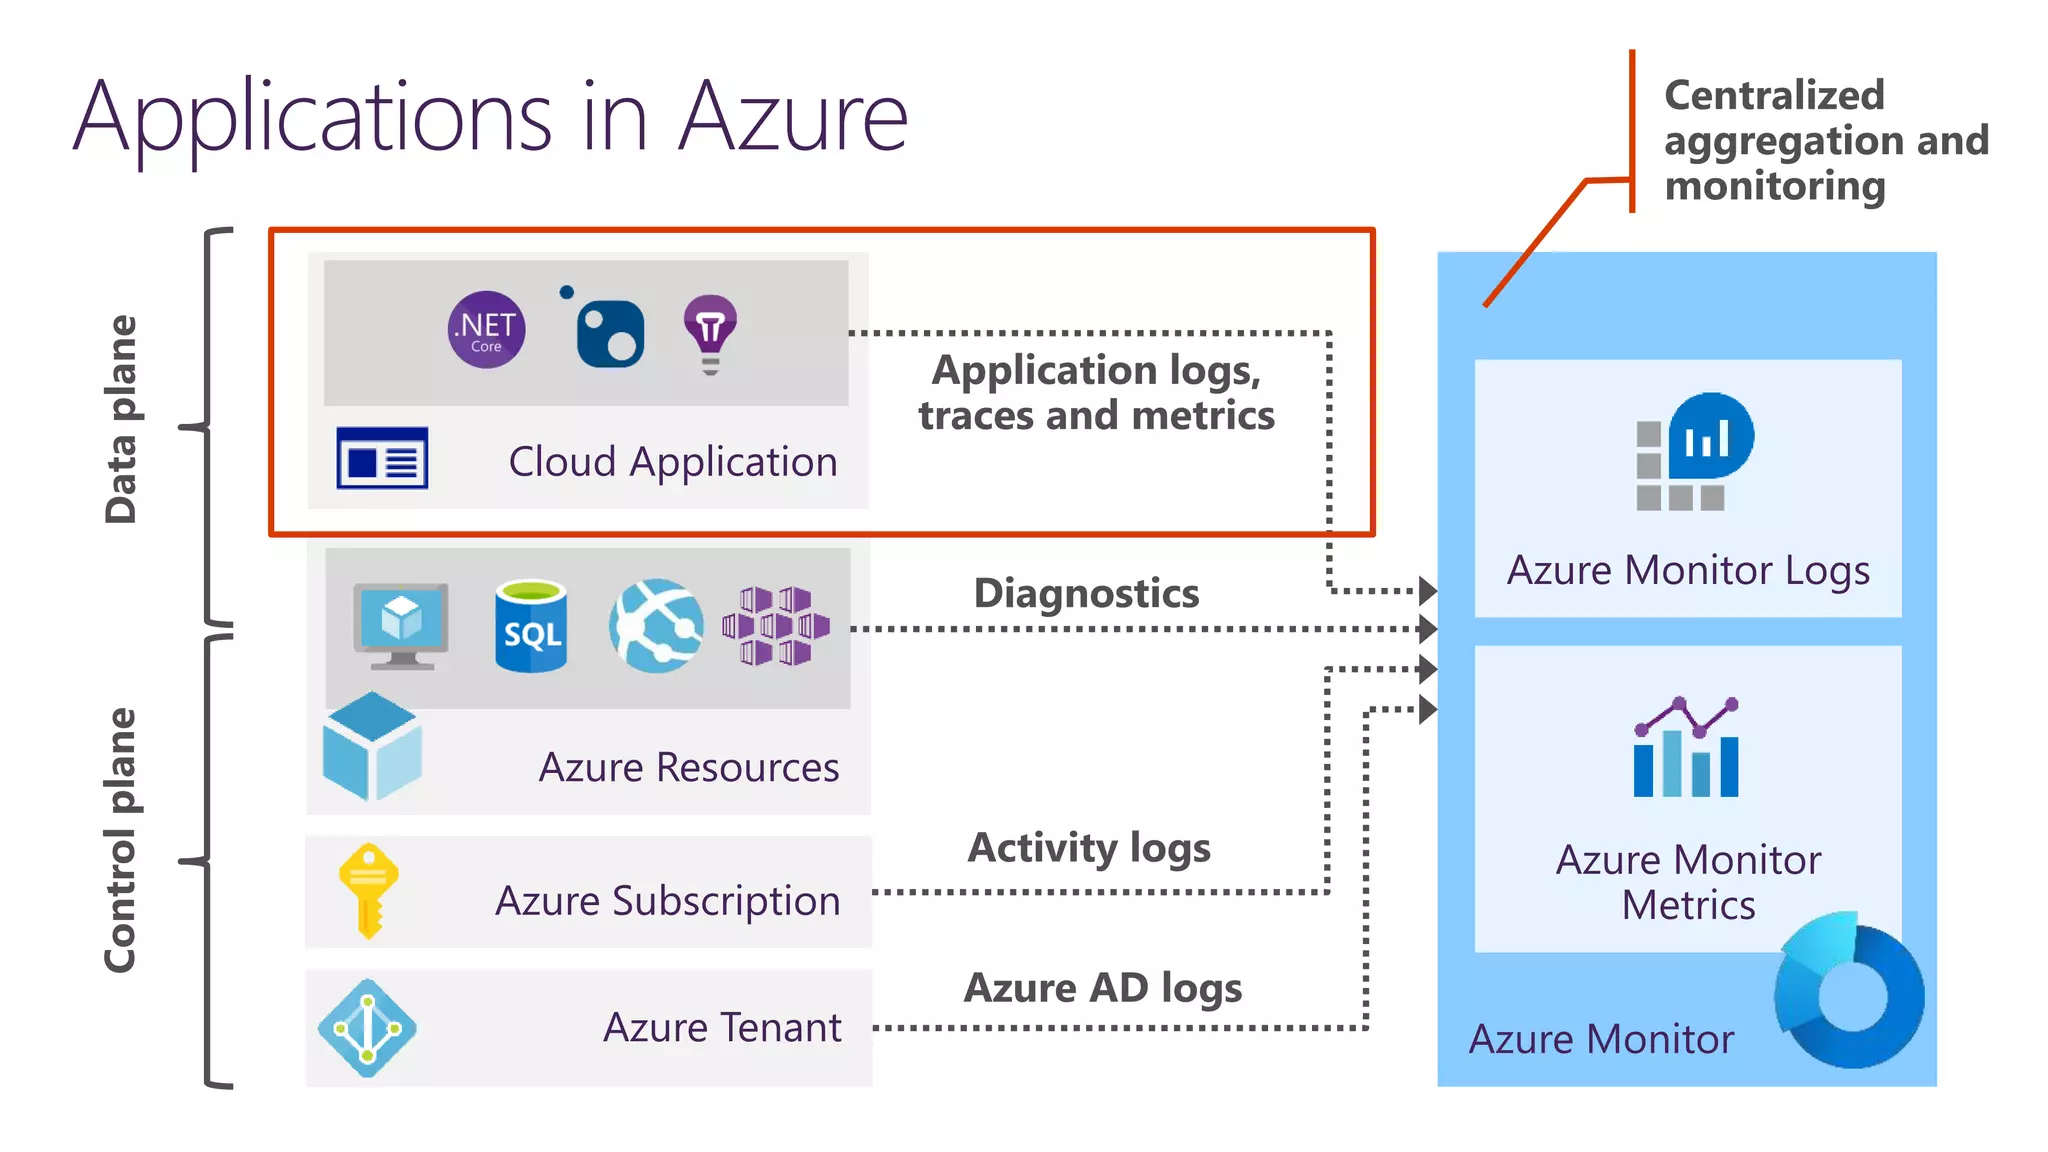
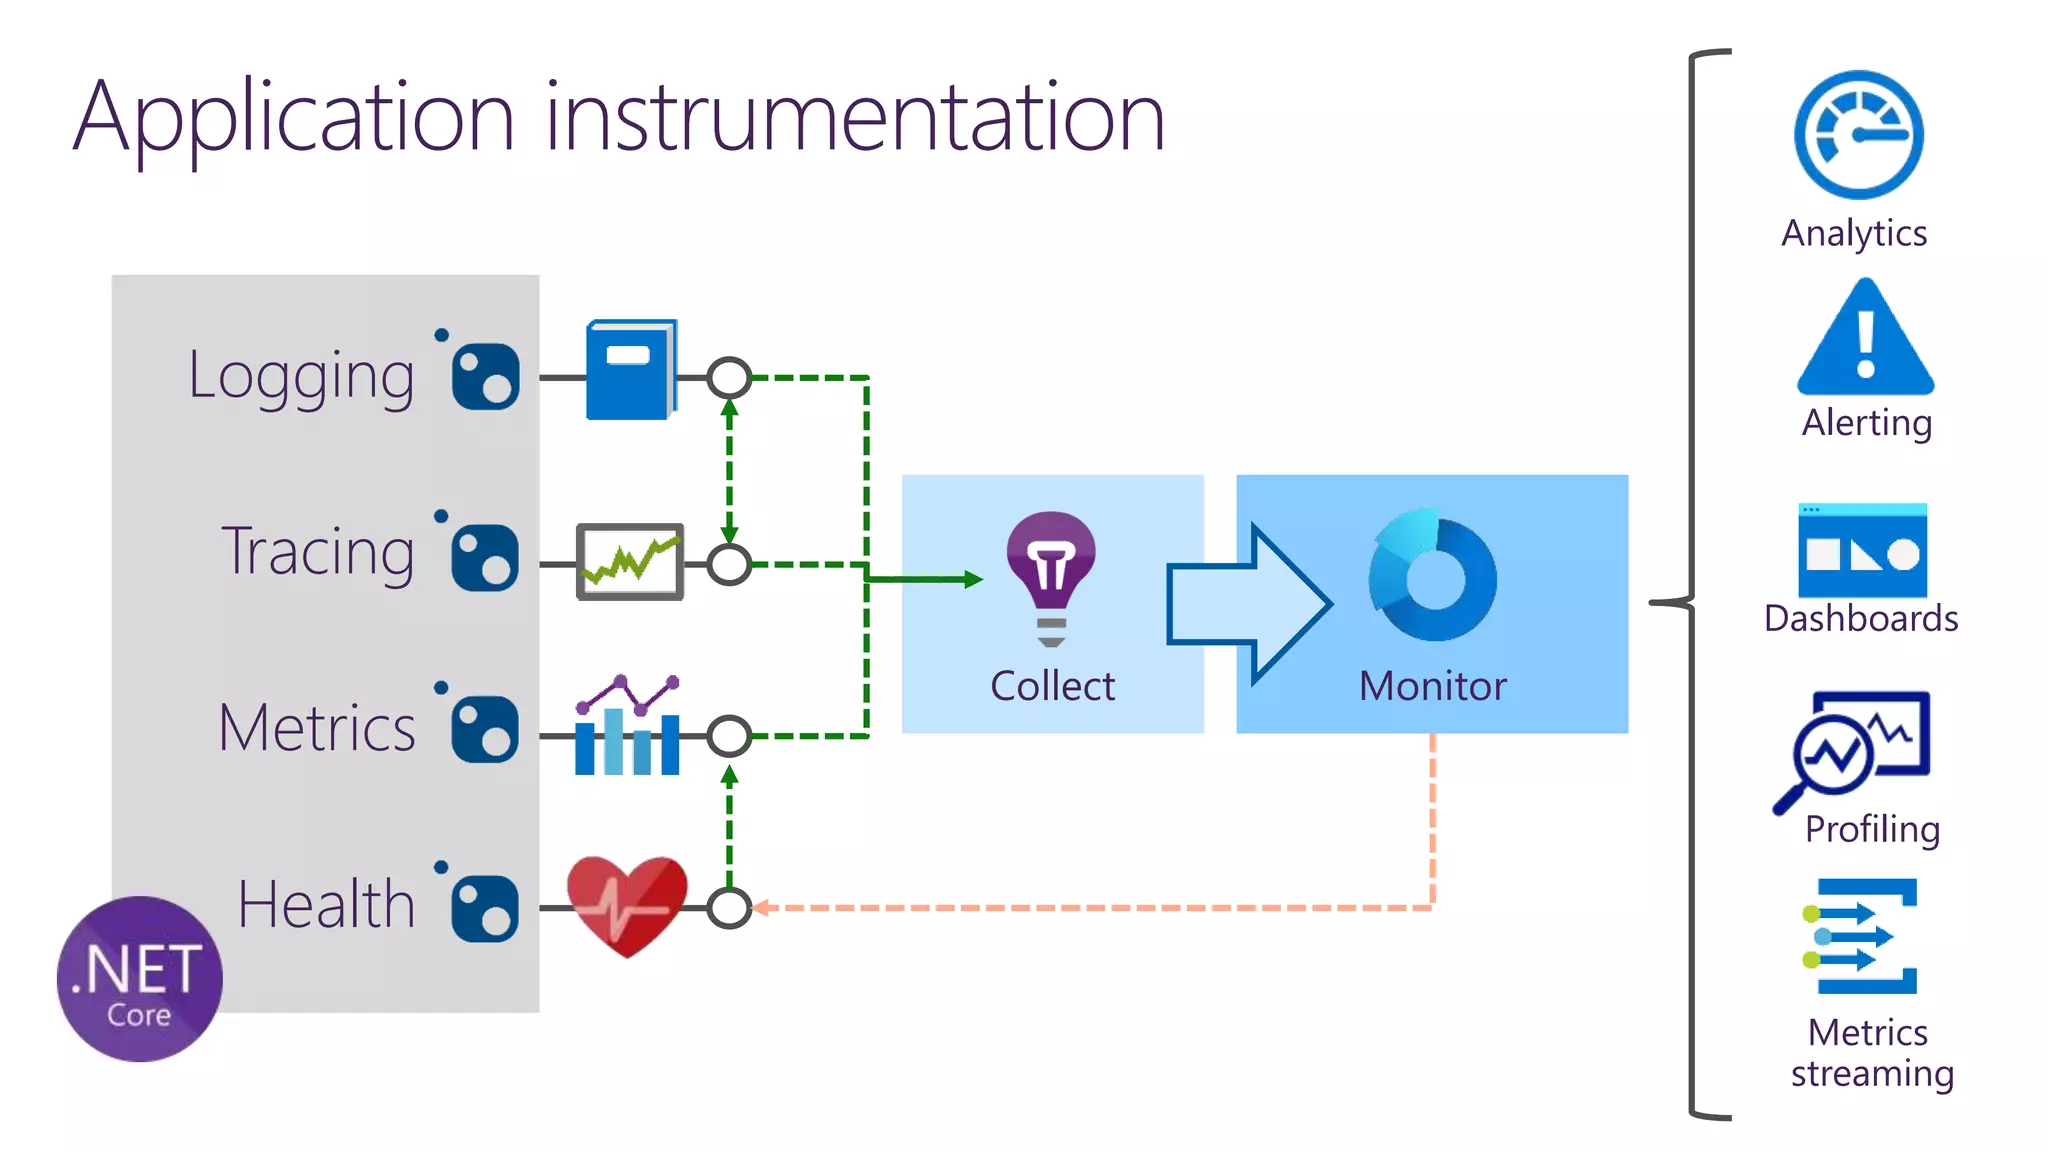
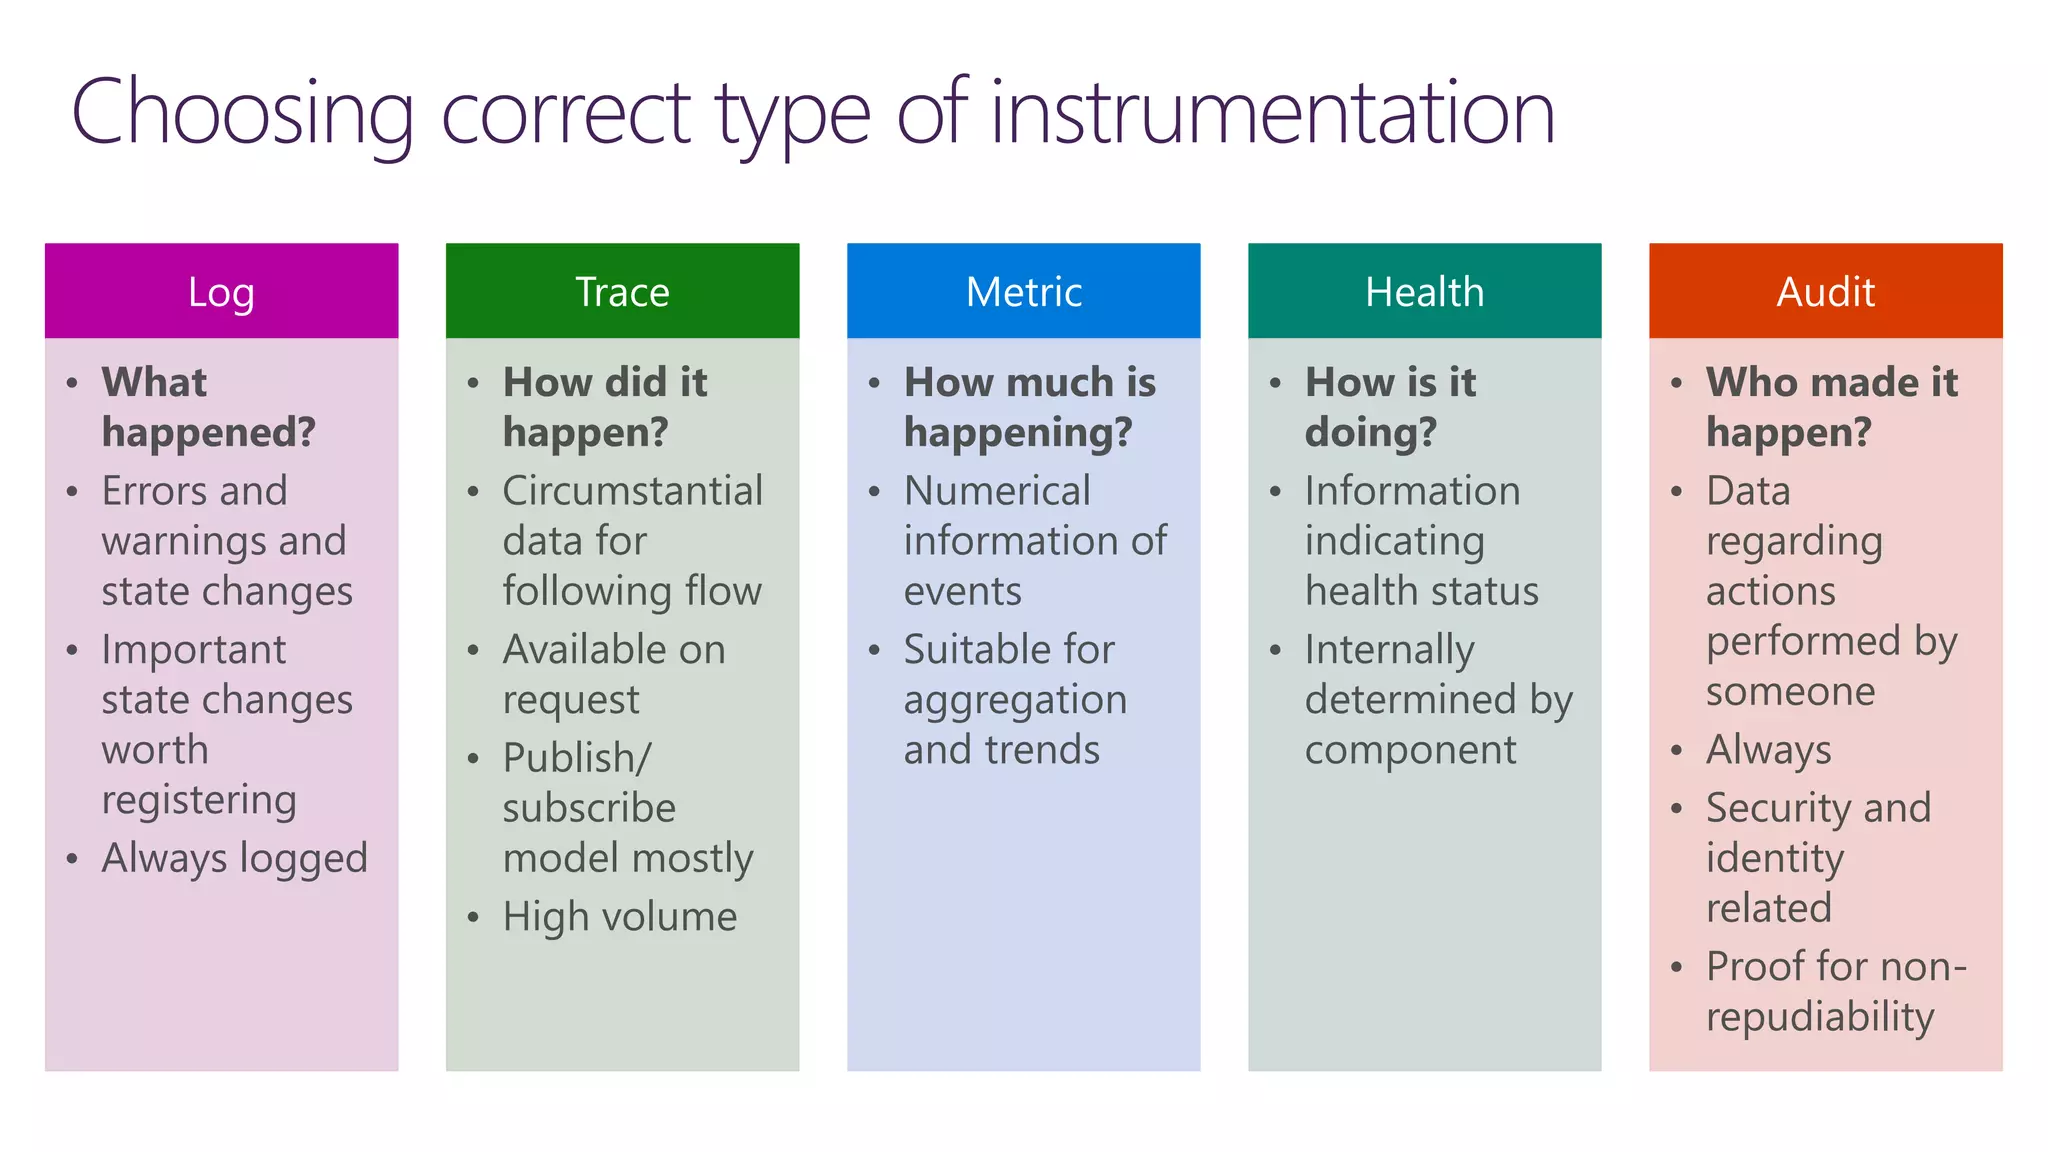
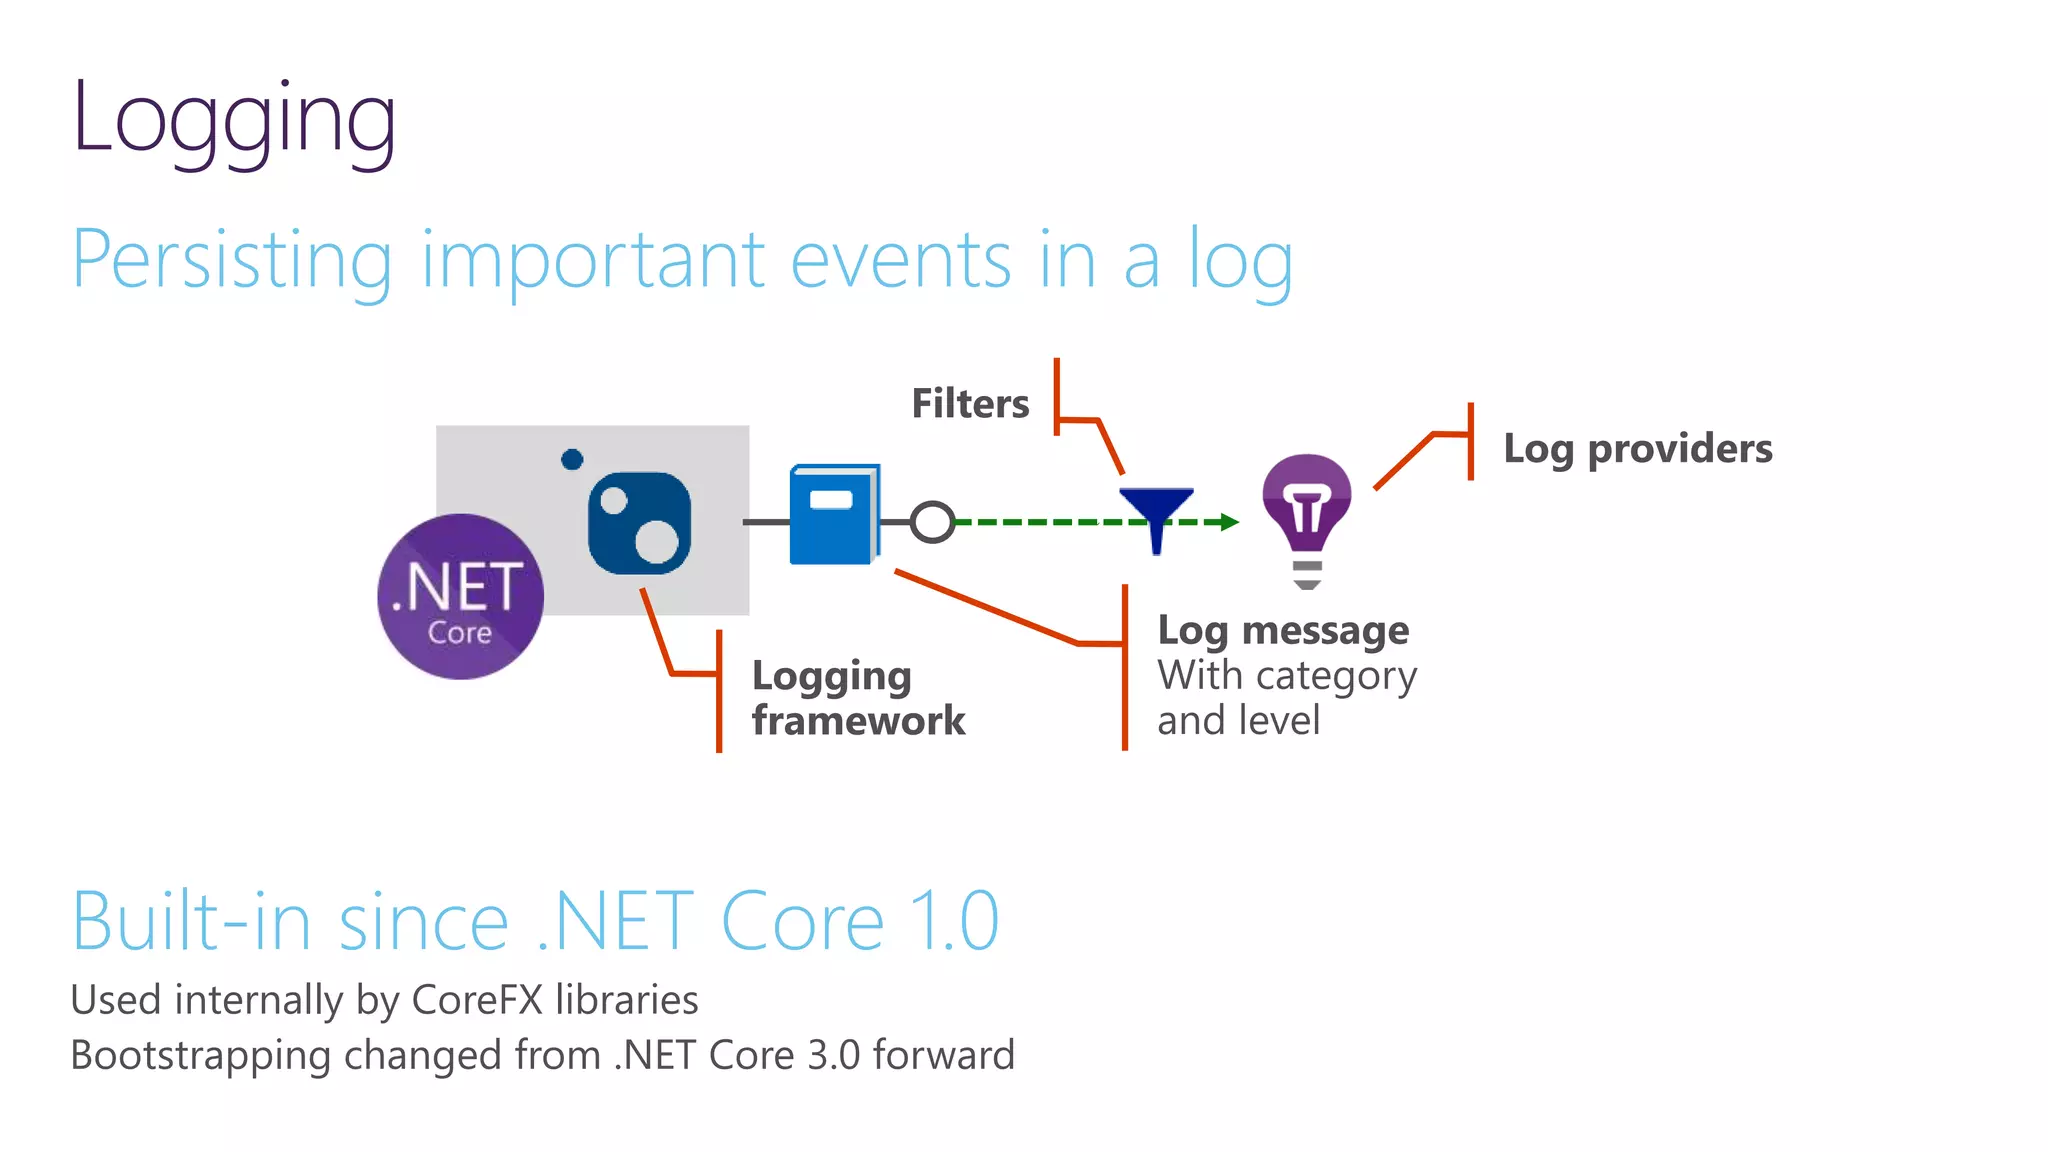
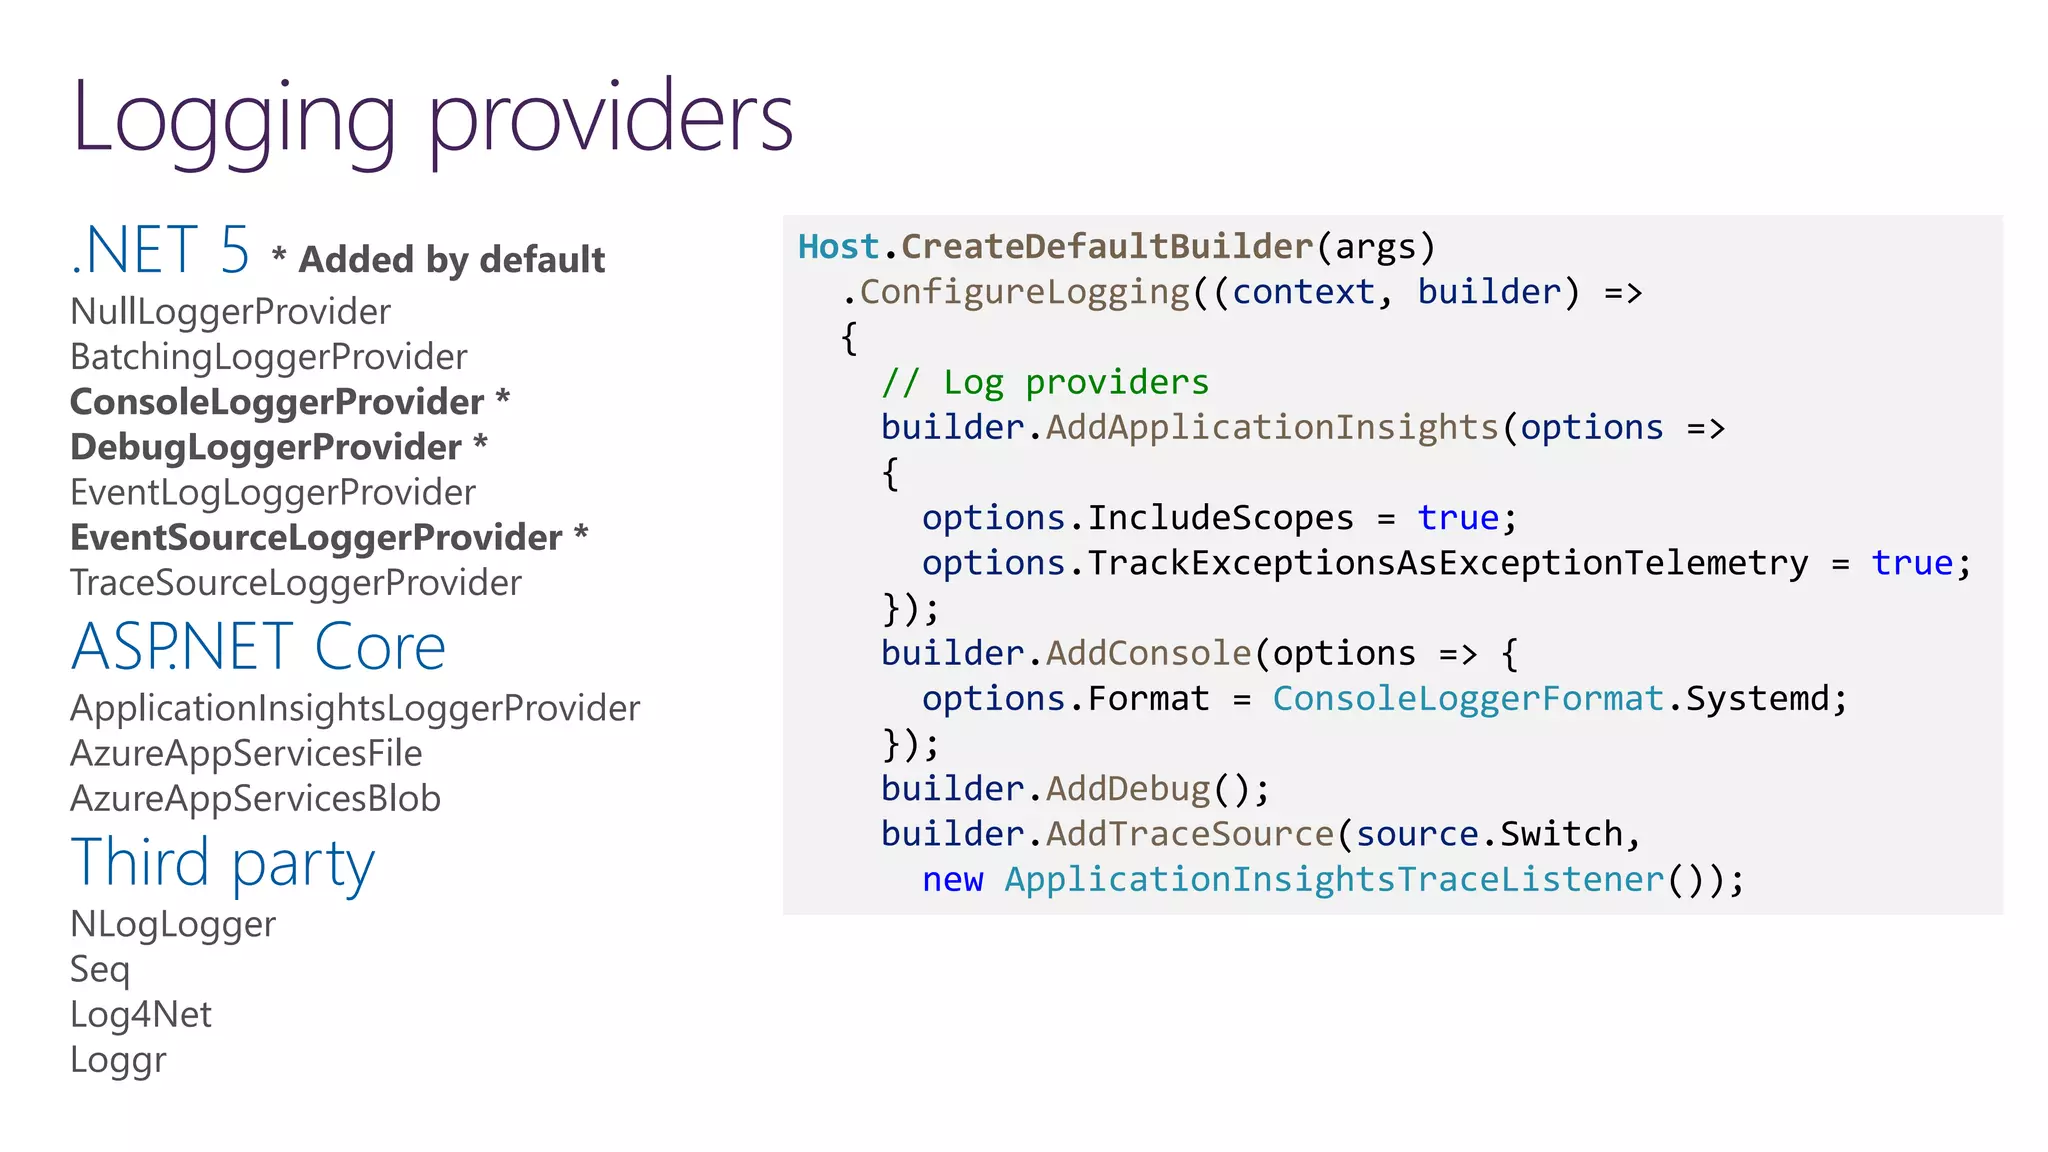
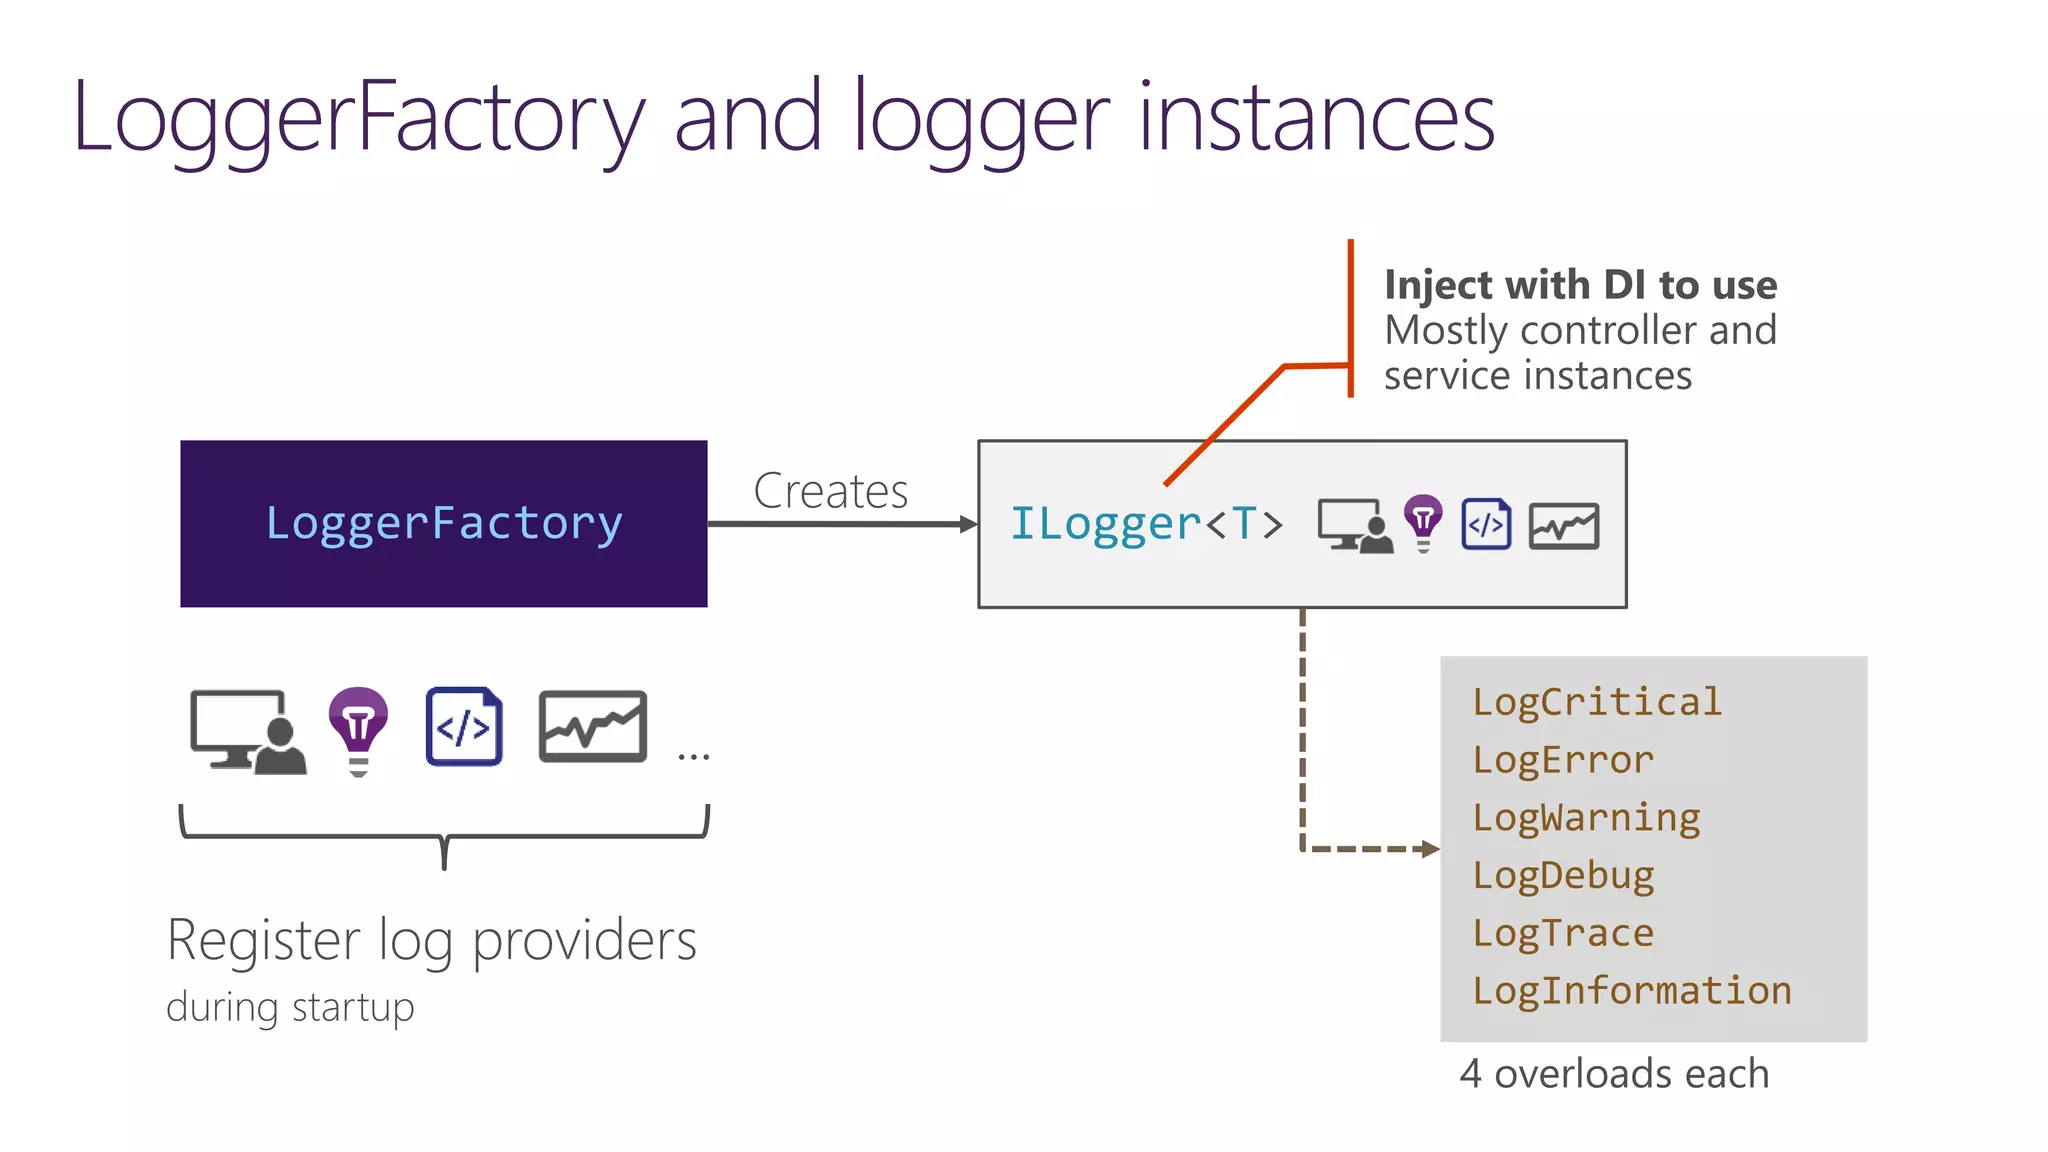
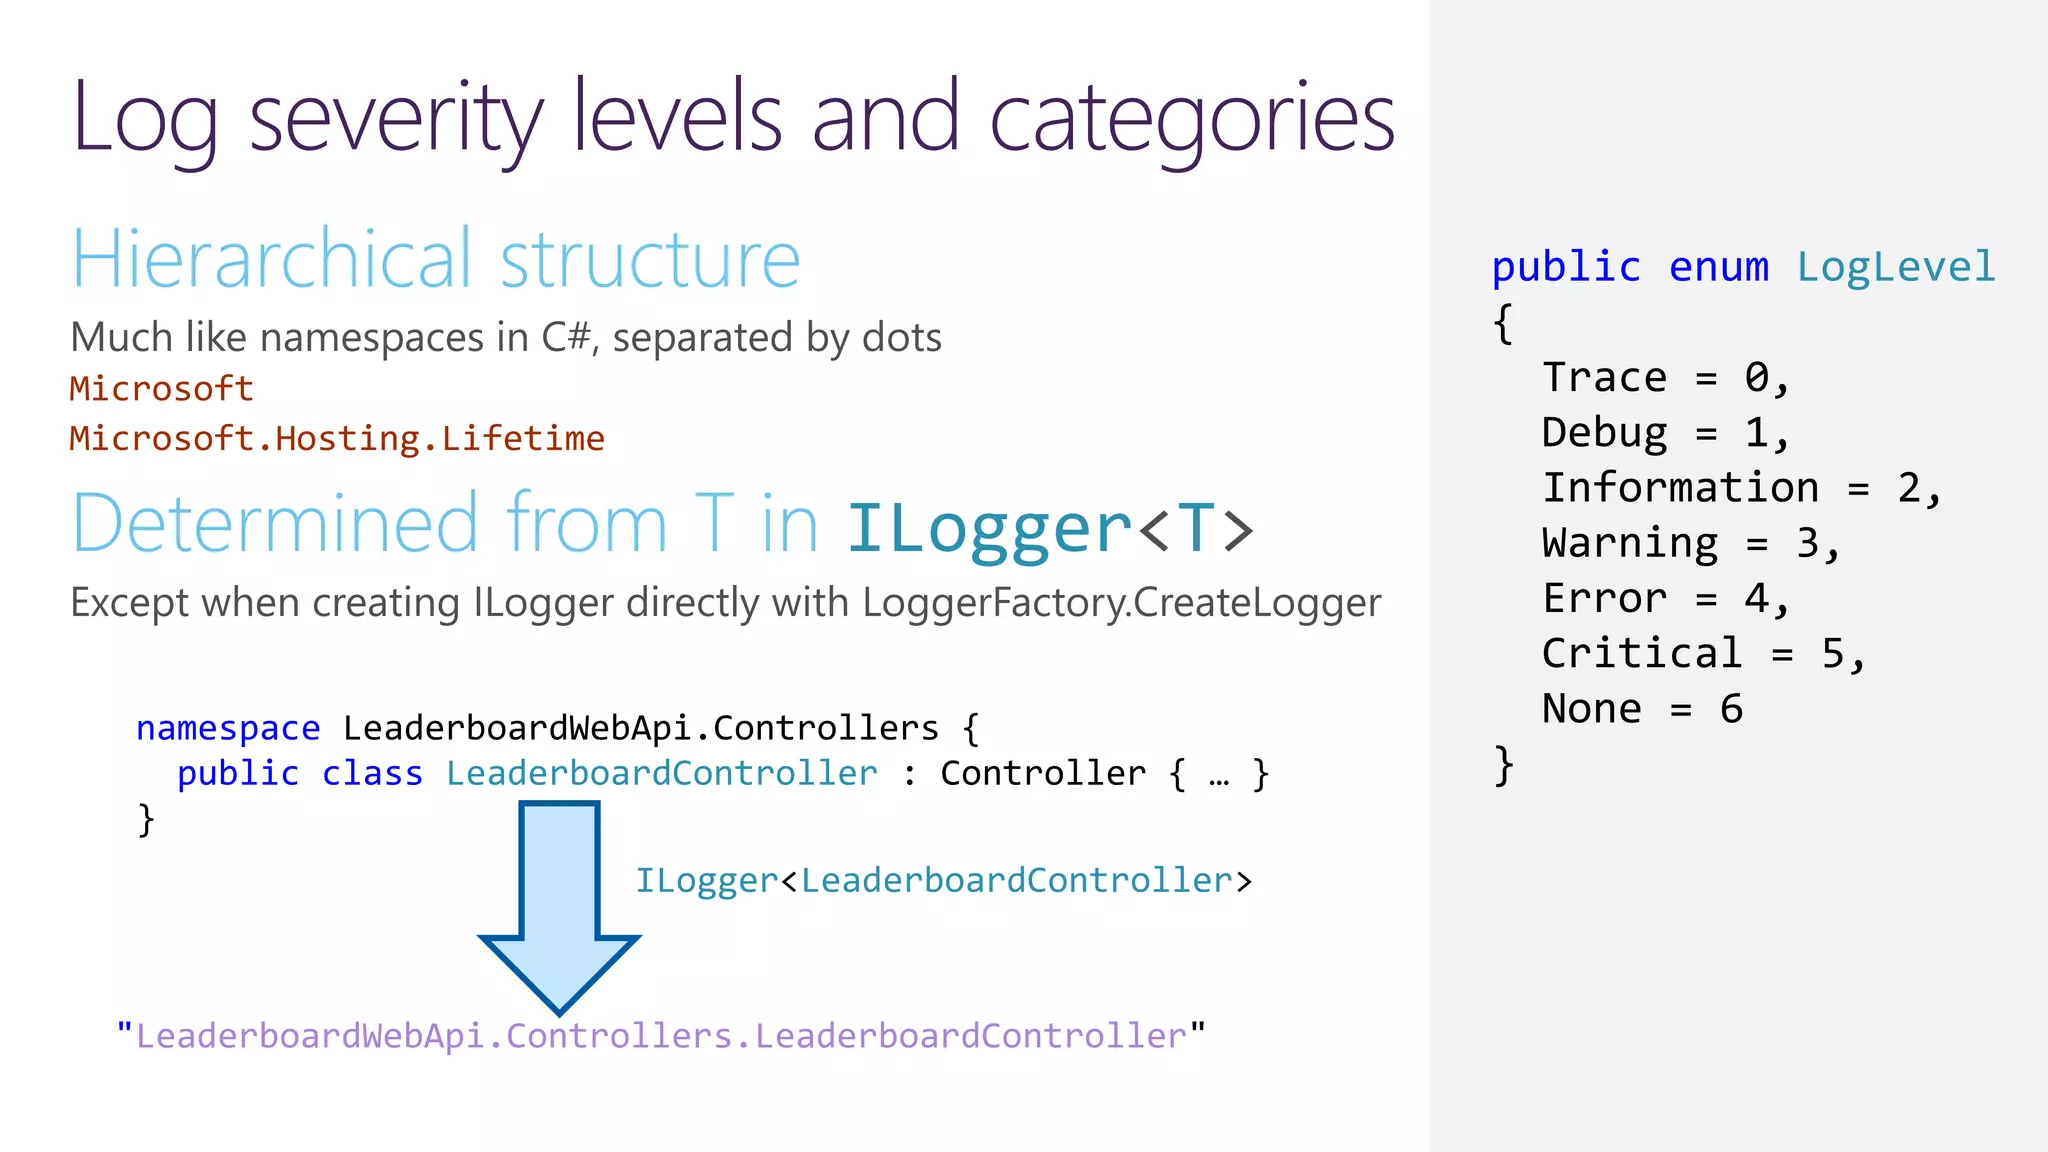
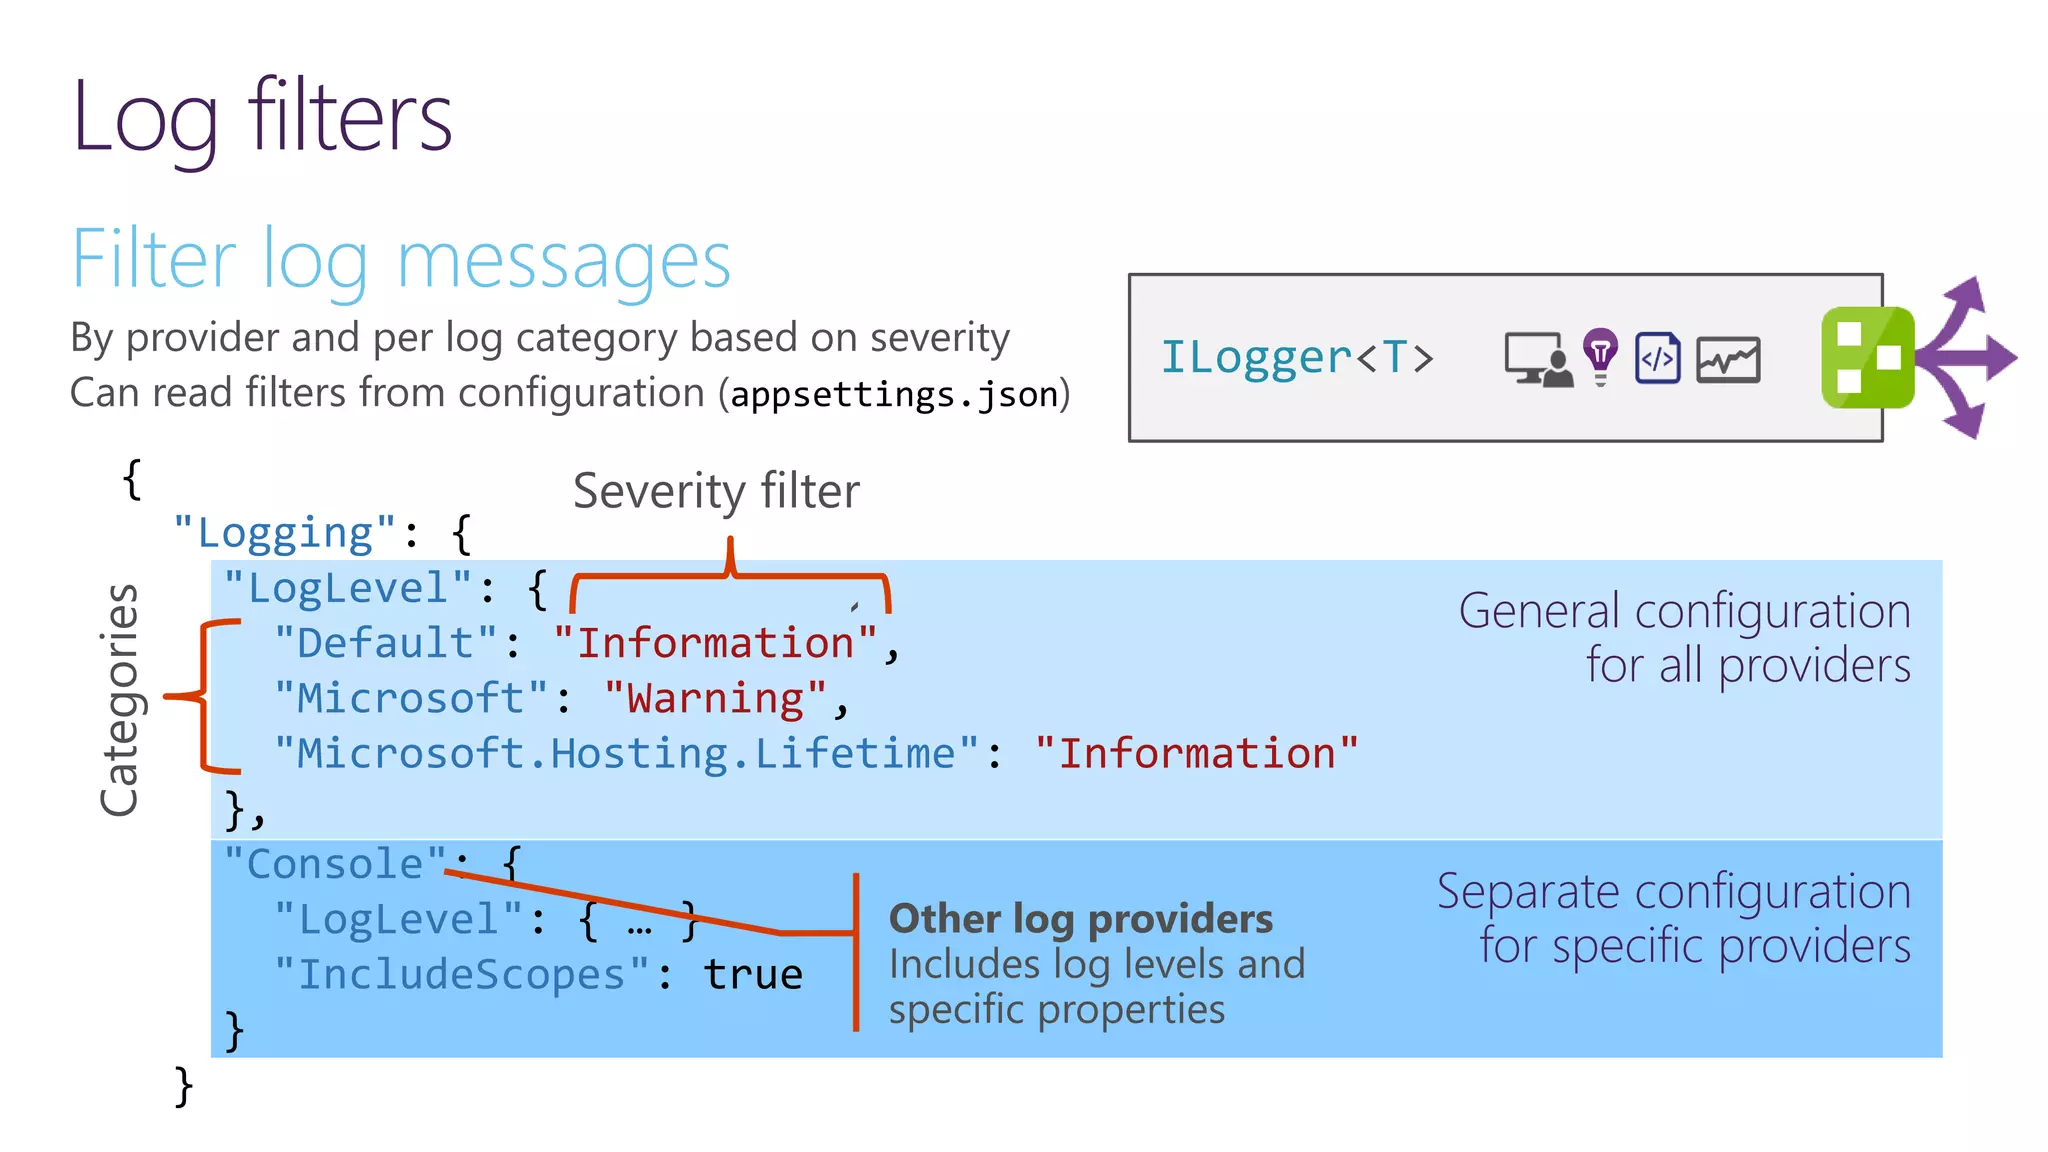
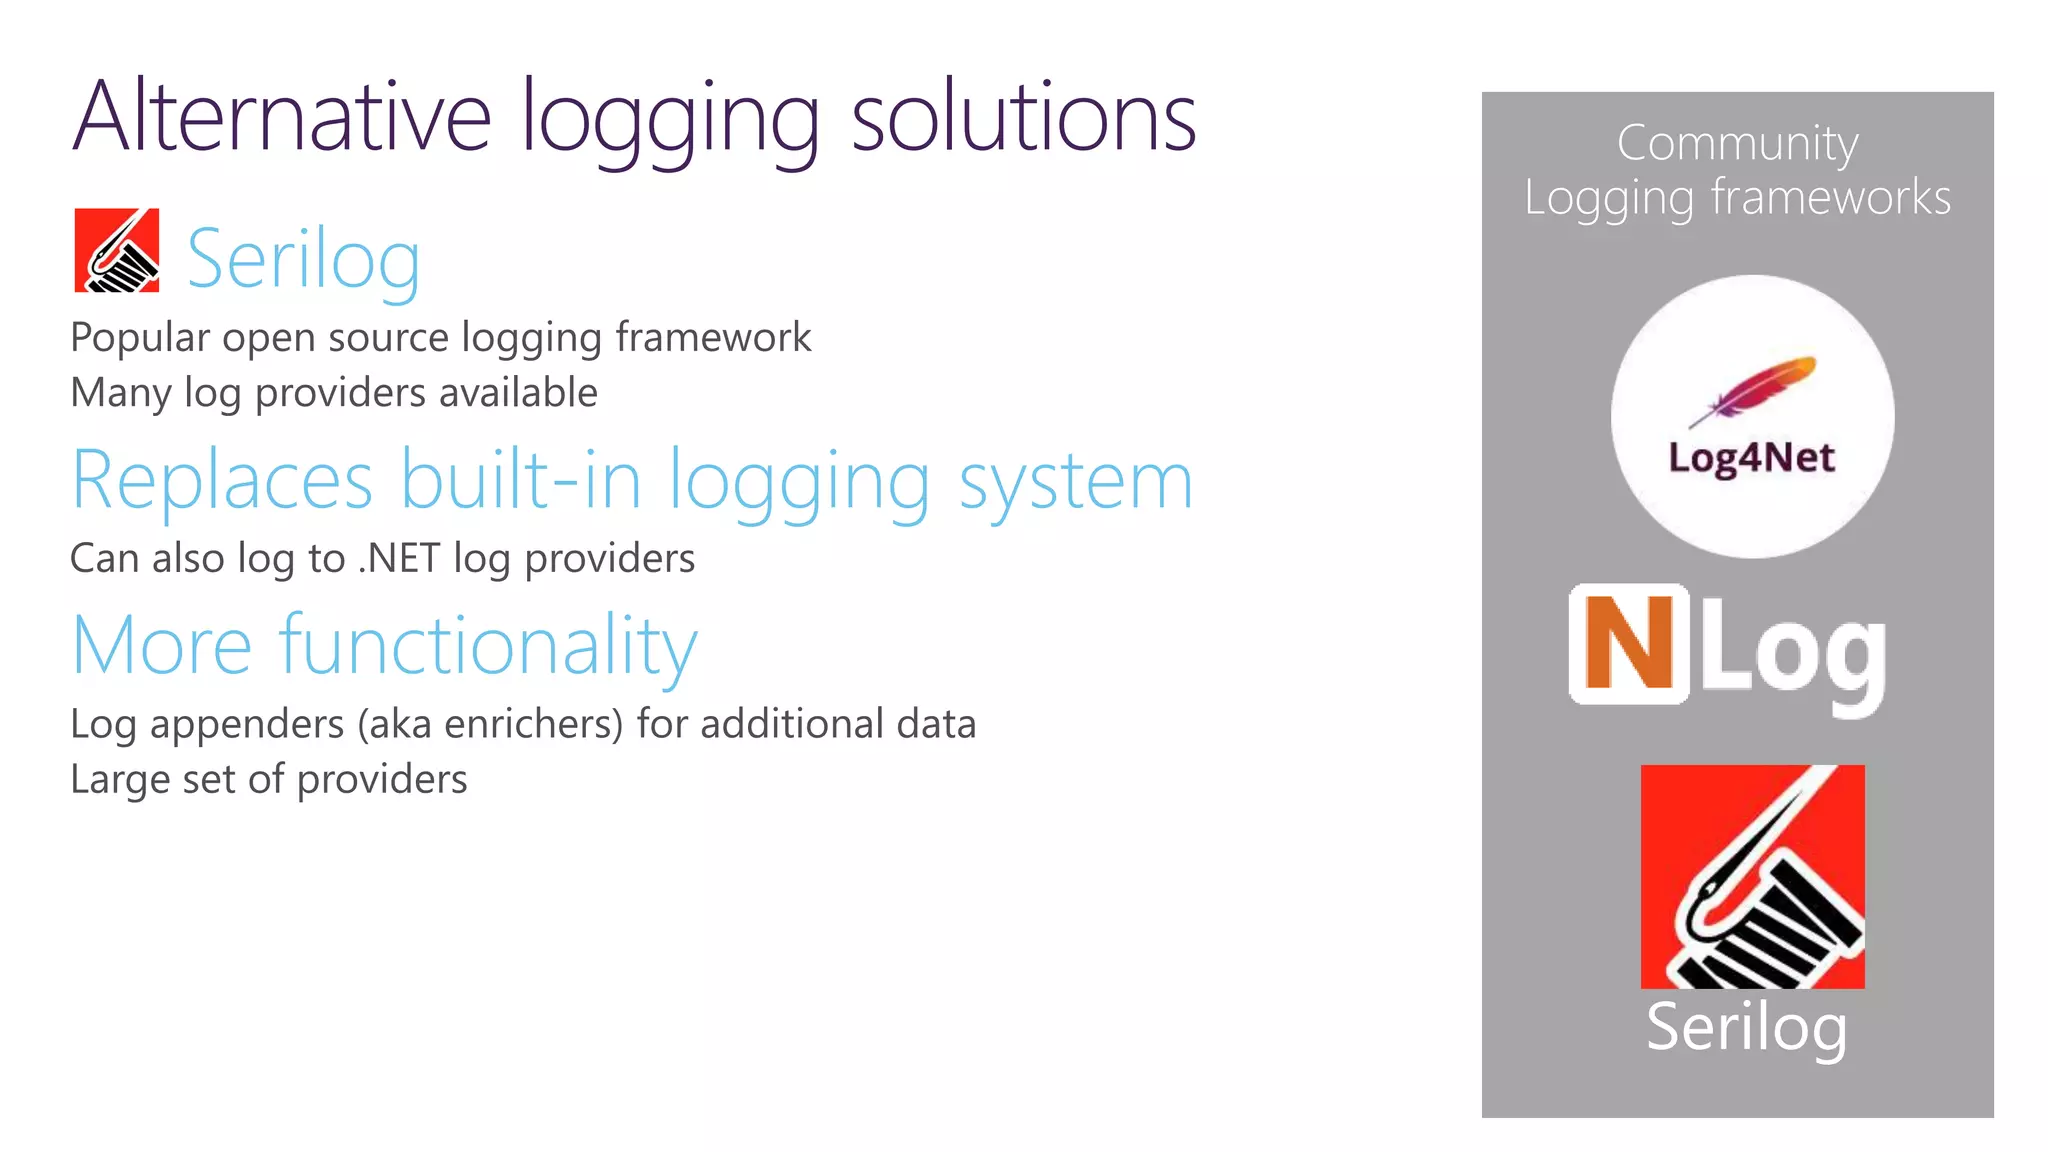
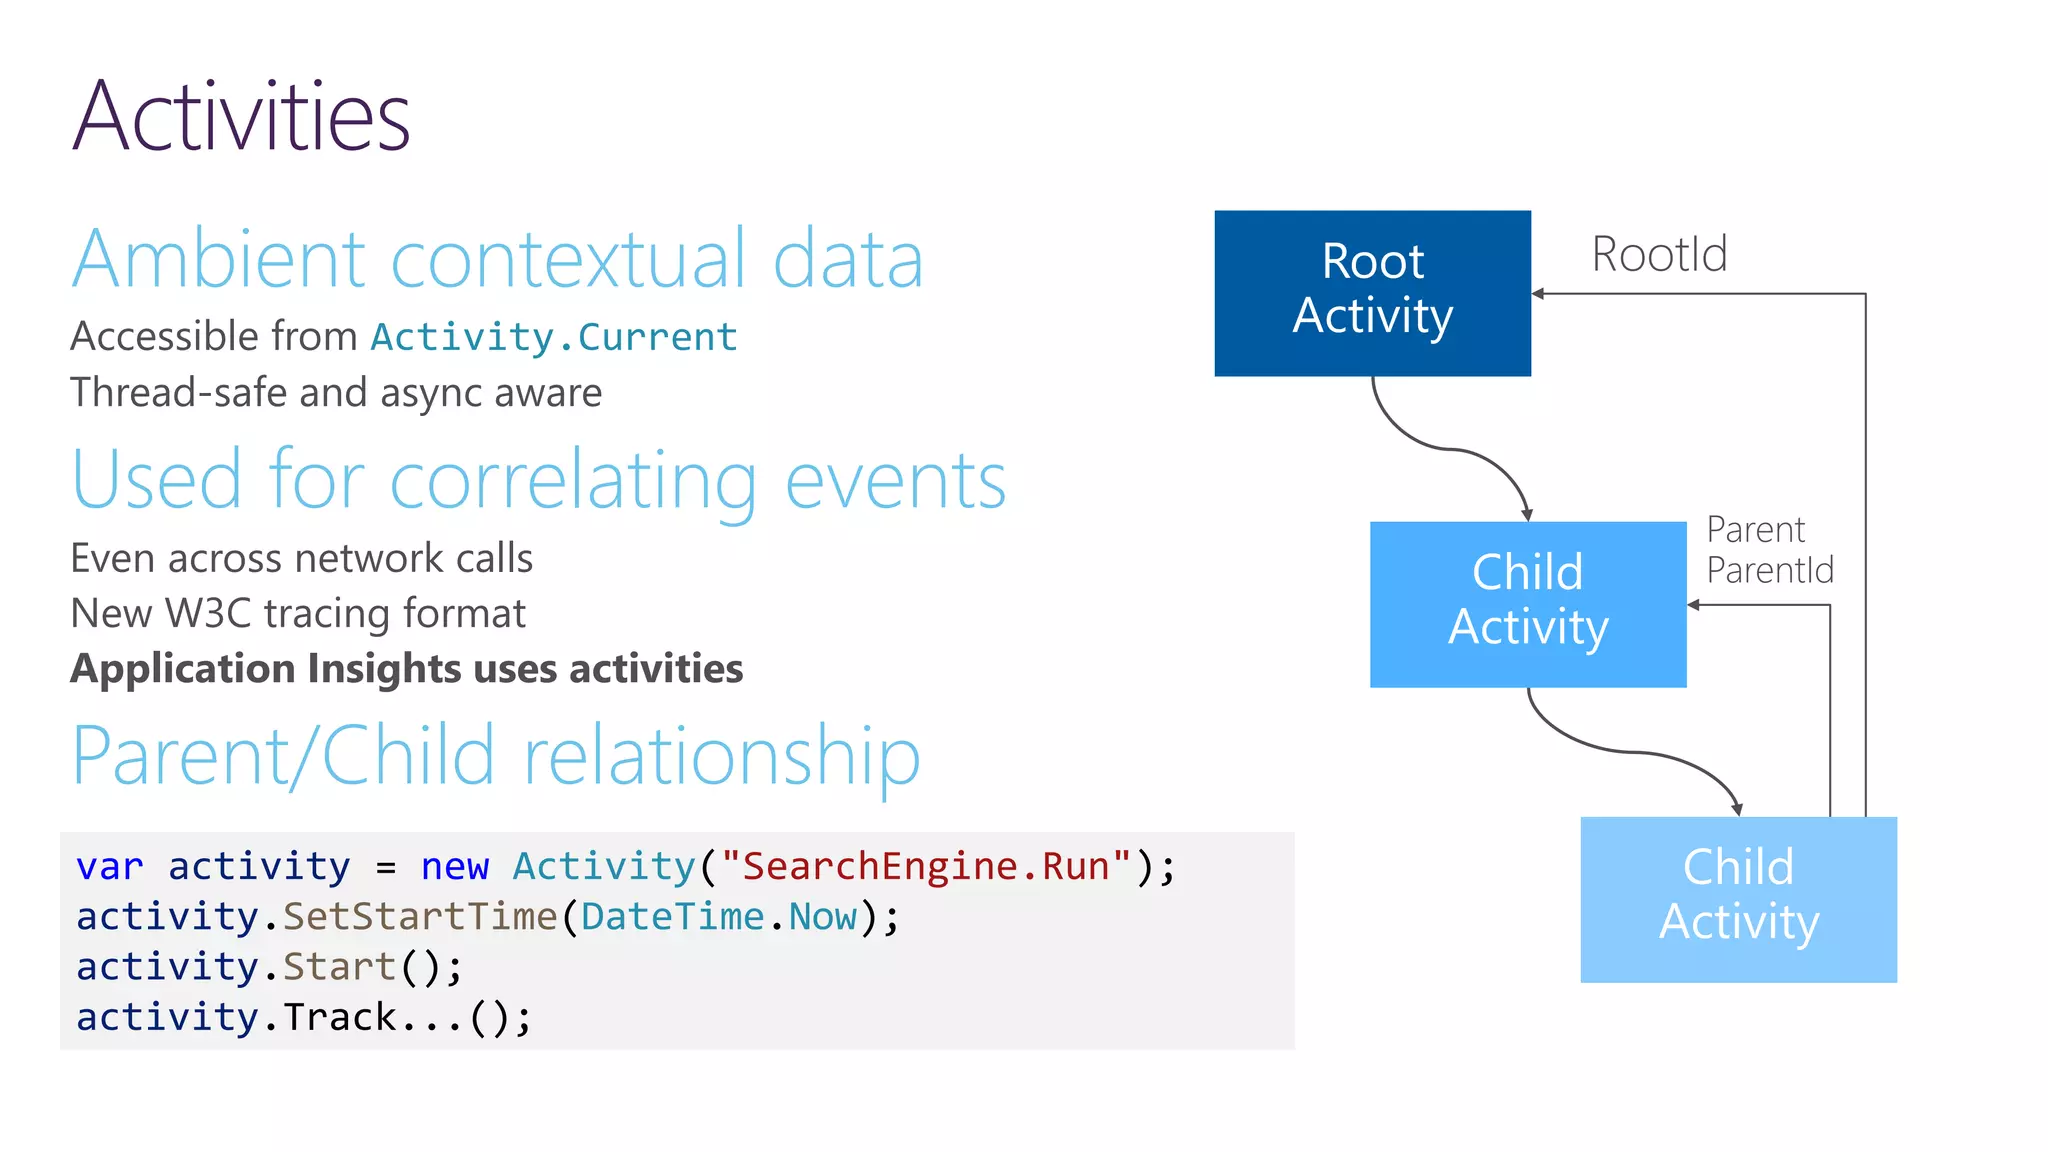
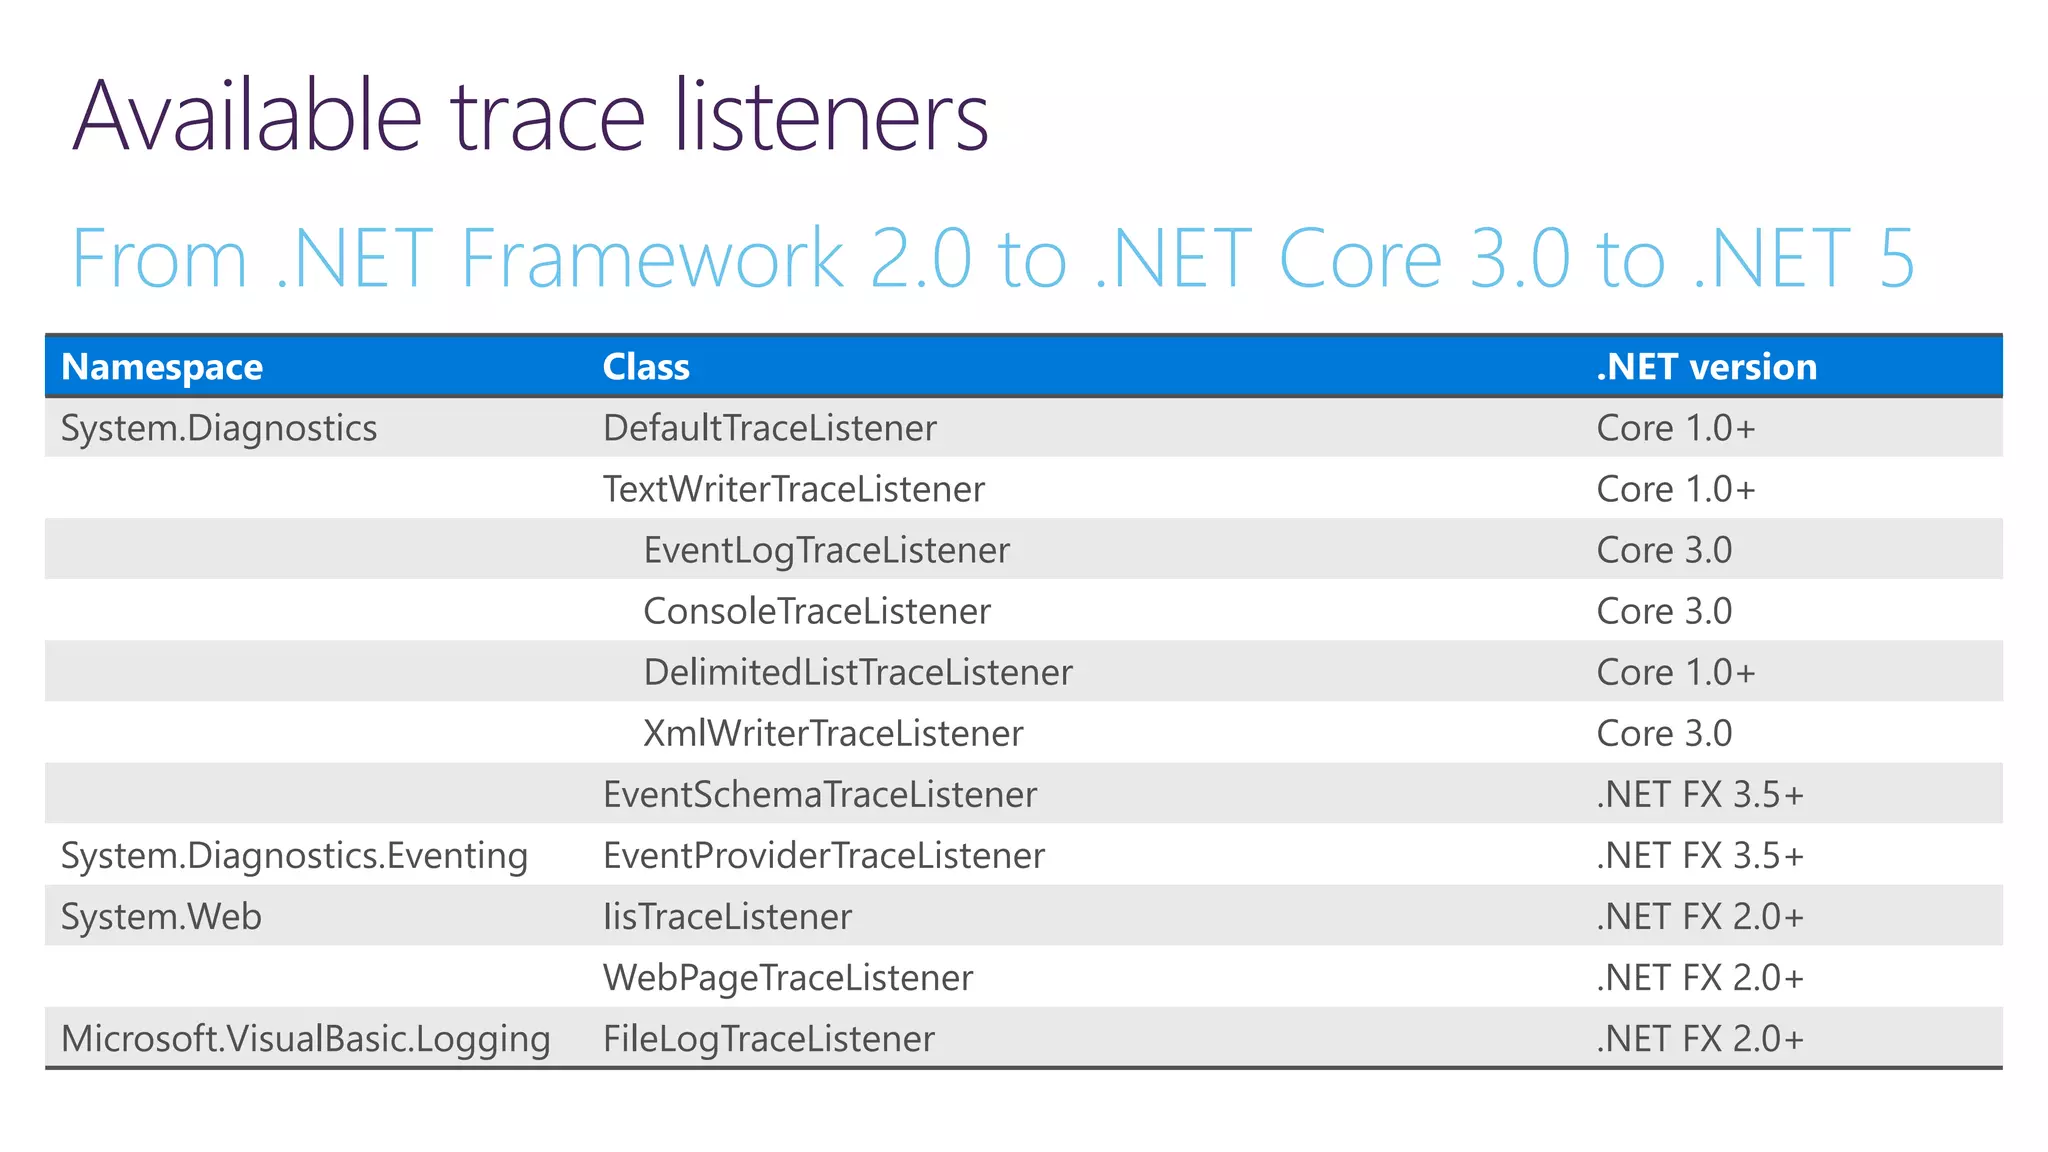
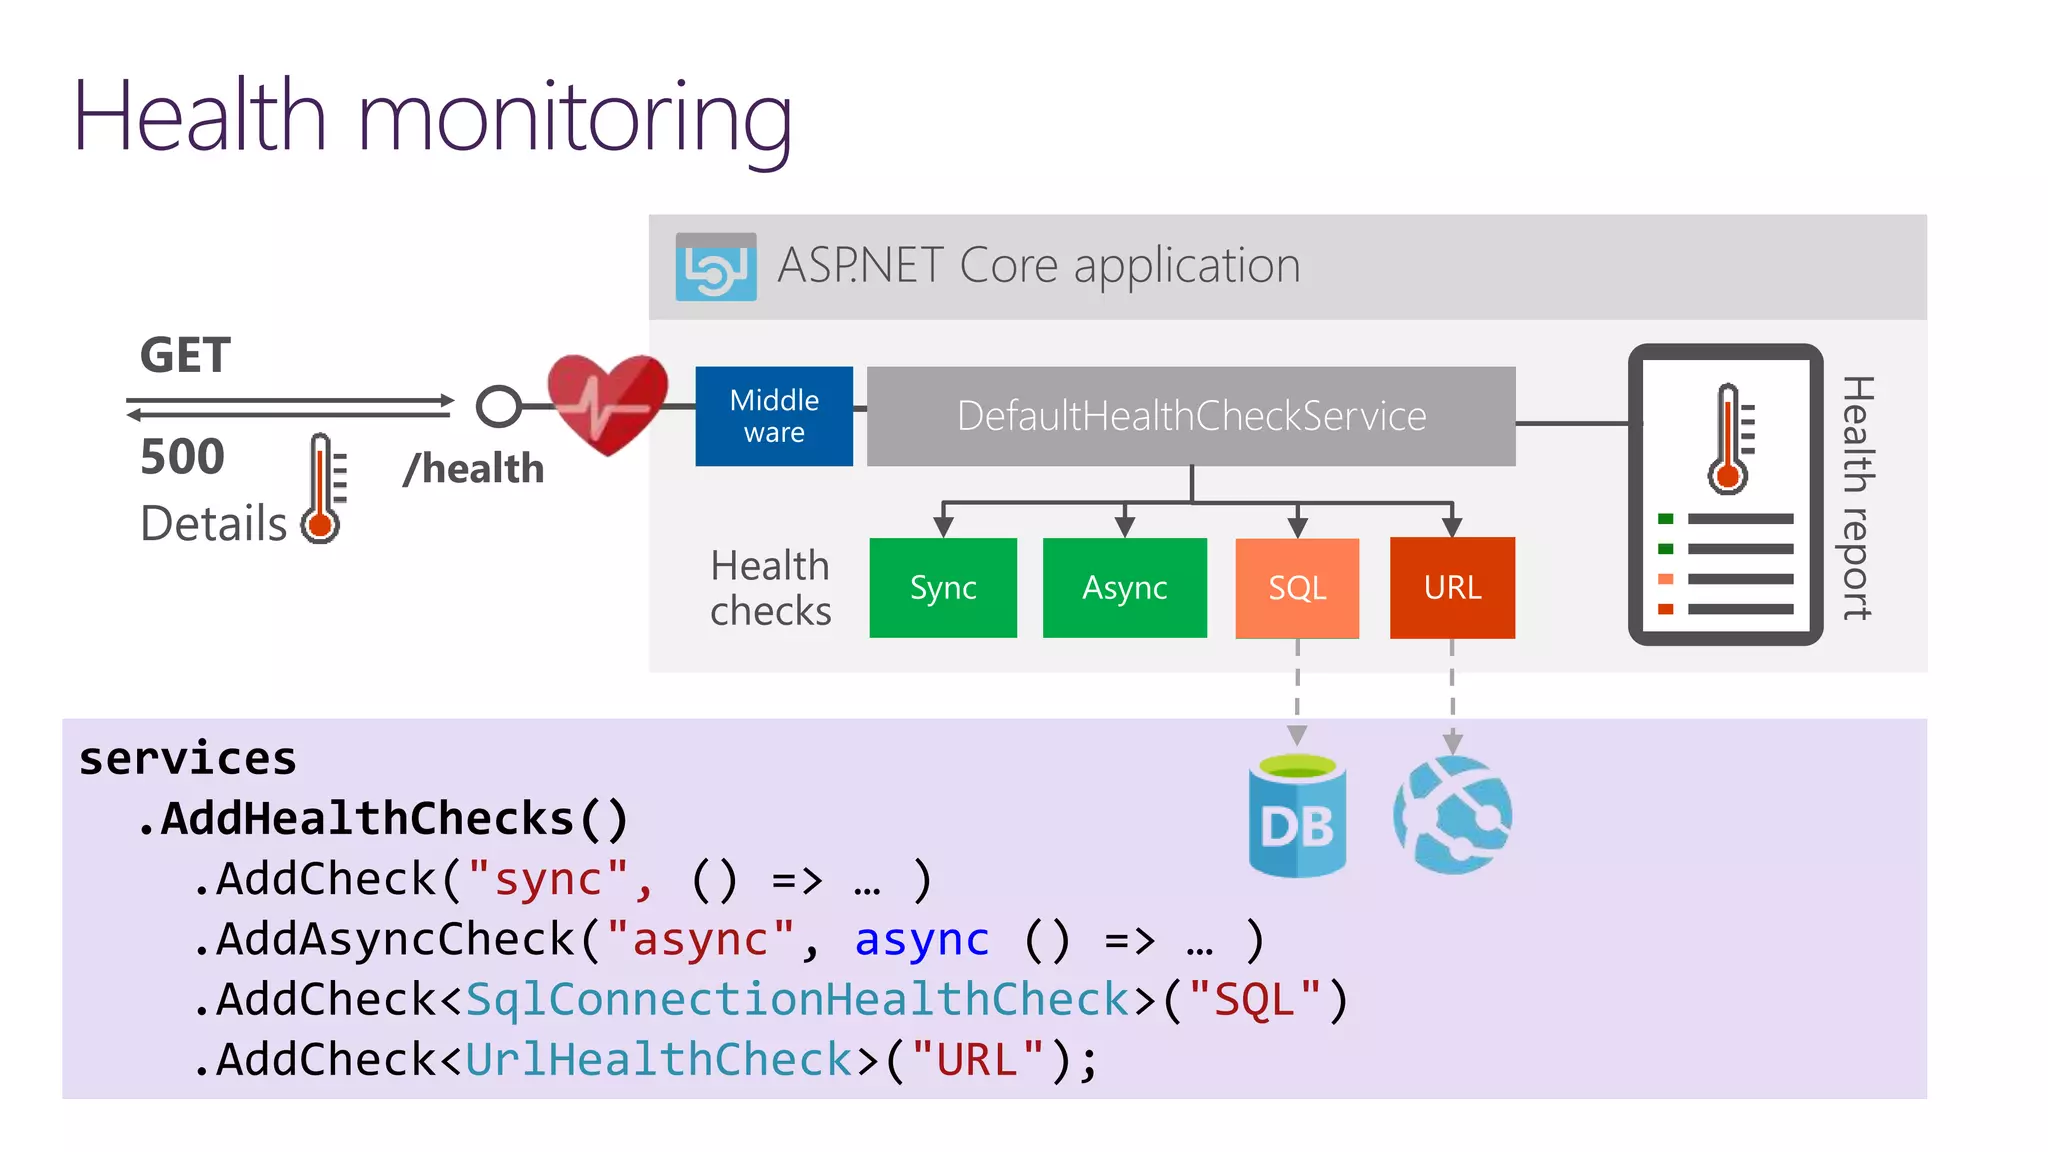
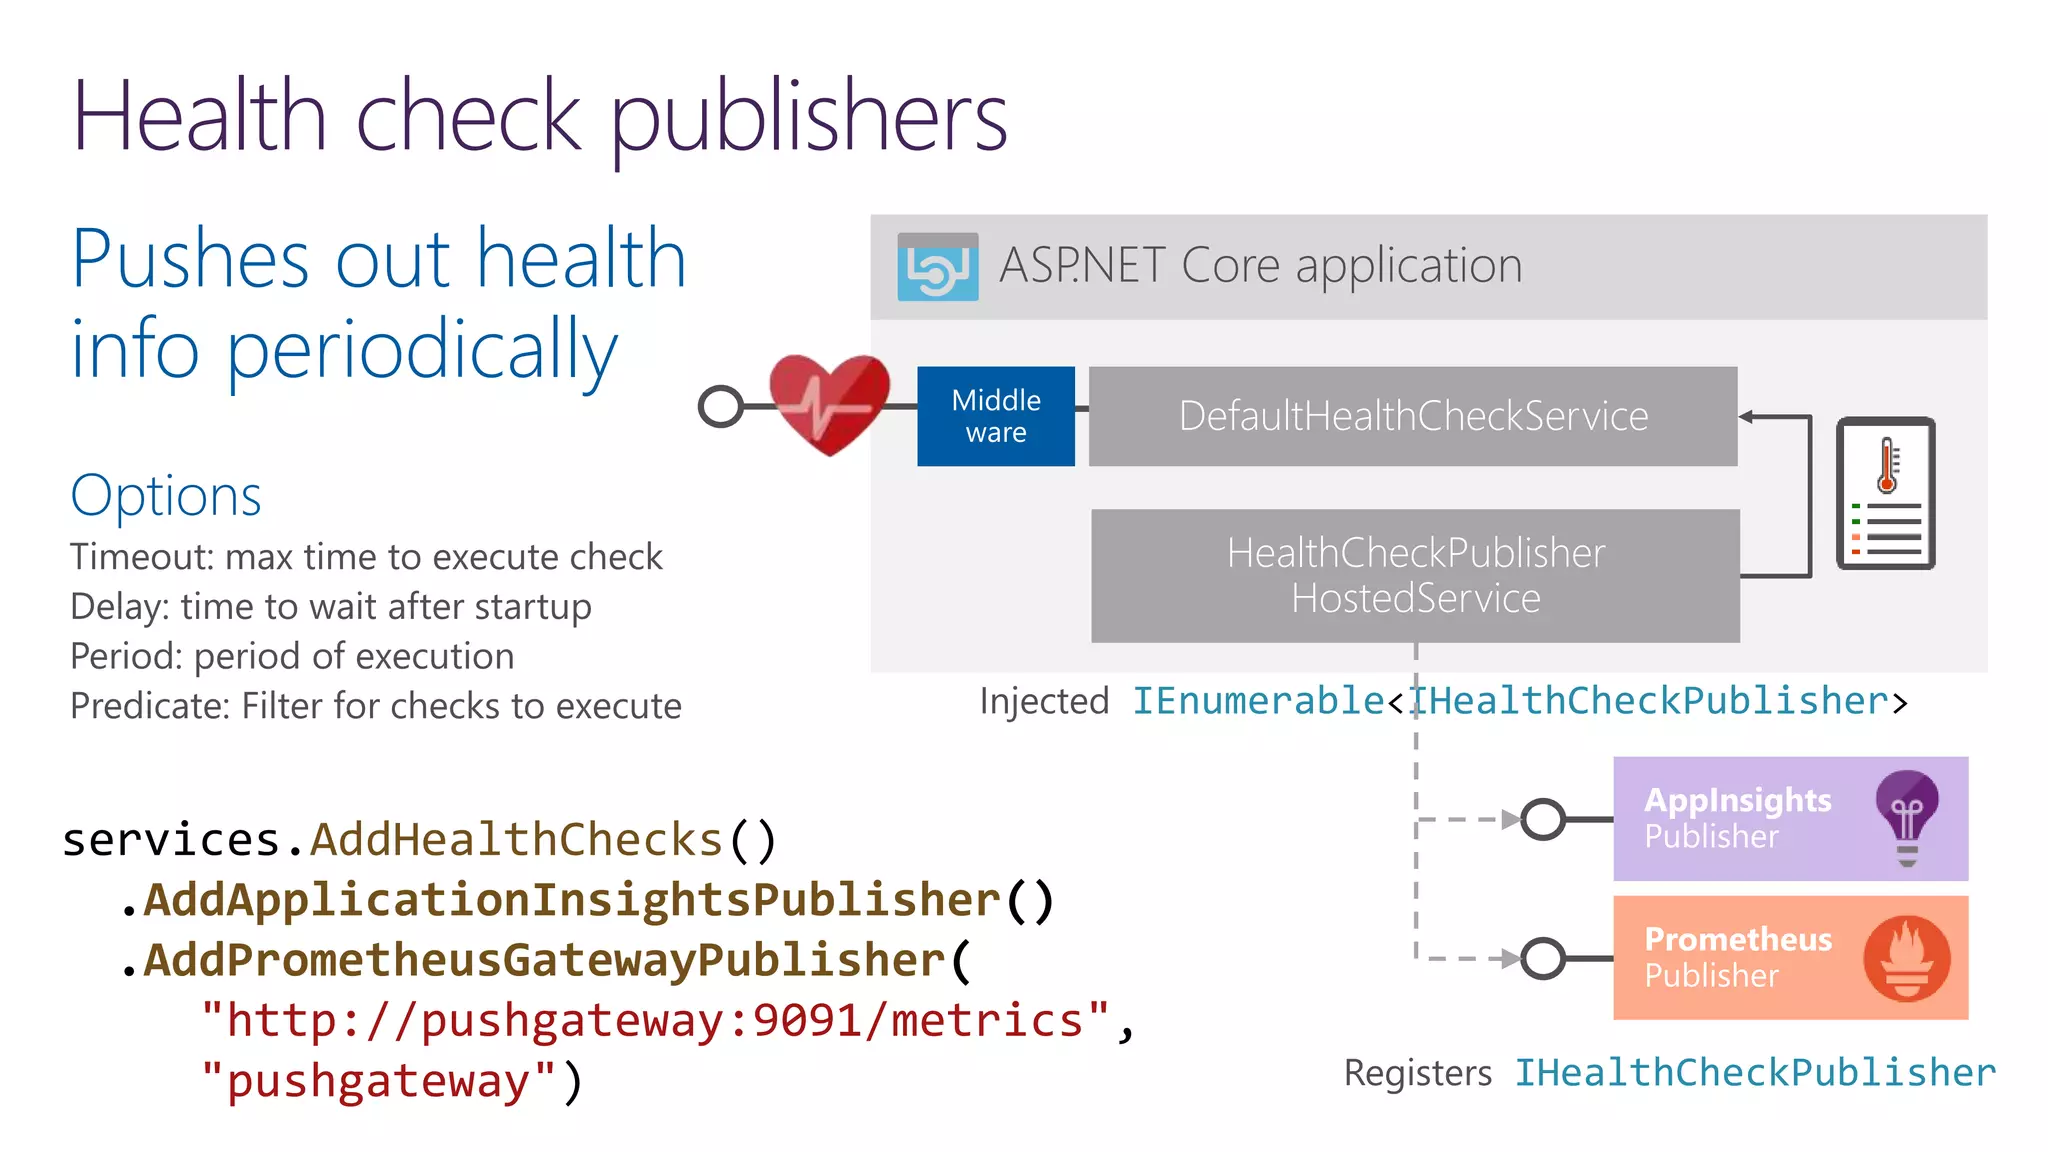
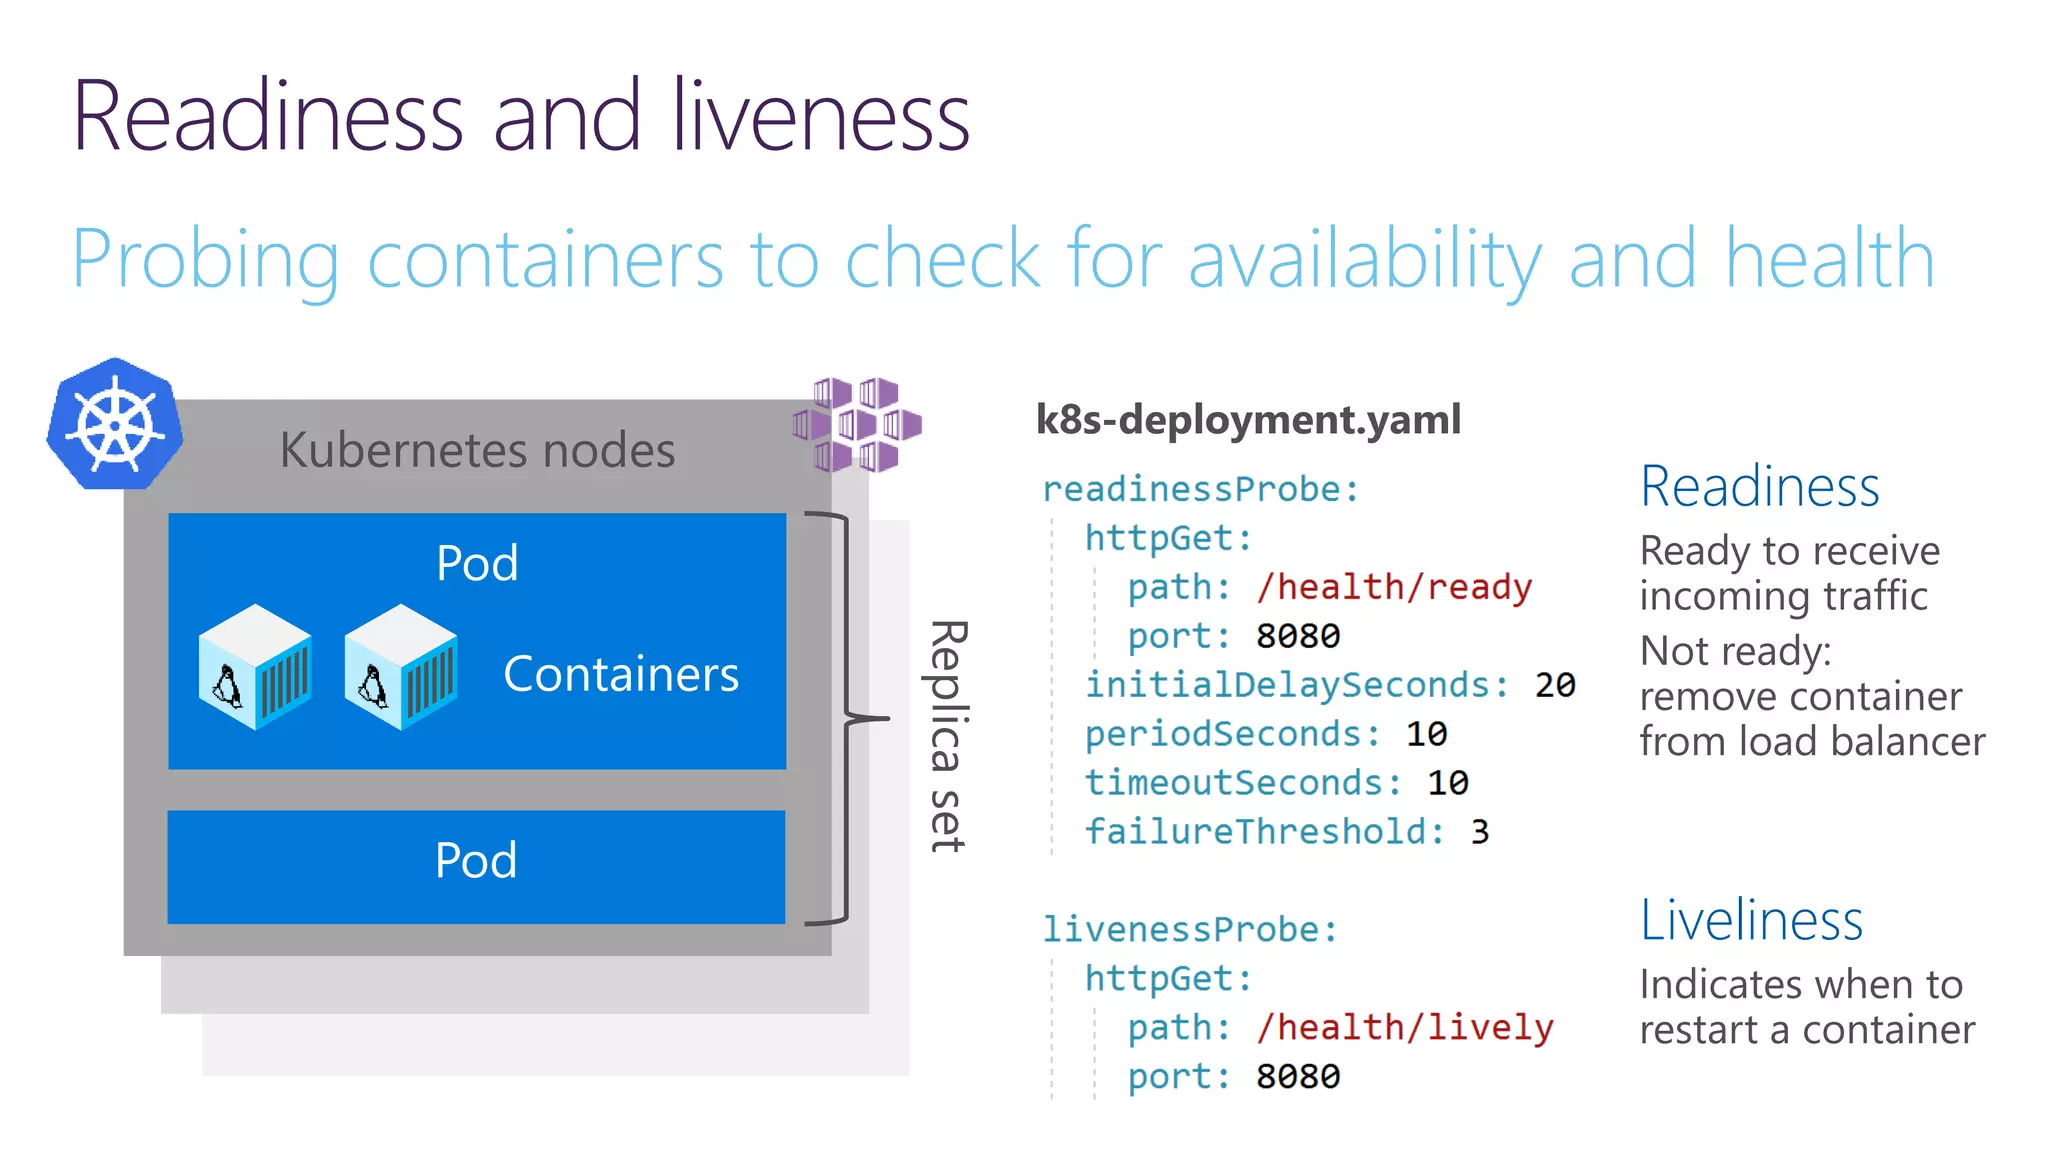
The document discusses instrumentation in .NET 5 and Azure, including logging, tracing, metrics, and health checks. It provides an overview of these concepts and how they can be implemented using built-in .NET APIs and services like Application Insights. The document also discusses how instrumentation data can be collected and correlated to monitor application and cloud resource performance.