This paper addresses self-propagating malware, particularly internet worms, and proposes a novel solution to limit their spread based on observed connection failure rates. It identifies flaws in previous measuring methods, particularly the use of ICMP messages that are often blocked, and introduces a double-bitmap data structure for more efficient and accurate measurement of these failure rates. The findings illustrate that this method not only requires minimal memory but also allows for tuning the accuracy of connection failure measurements.
![David C. Wyld et al. (Eds) : NETCOM, NCS, WiMoNe, CSEIT, SPM - 2015 pp. 99–114, 2015. © CS & IT-CSCP 2015 DOI : 10.5121/csit.2015.51609 LIMITING SELF-PROPAGATING MALWARE BASED ON CONNECTION FAILURE BEHAVIOR Yian Zhou1 , You Zhou1 , Shigang Chen1 and O. Patrick Kreidl2 1 Department of Computer & Information Science & Engineering, University of Florida, Gainesville, FL, USA 32611 yian,youzhou,sgchen@cise.ufl.edu 2 Department of Electrical Engineering, University of North Florida, Jacksonville, FL, USA 32224 patrick.kreidl@unf.edu ABSTRACT Self-propagating malware (e.g., an Internet worm) exploits security loopholes in software to infect servers and then use them to scan the Internet for more vulnerable servers. While the mechanisms of worm infection and their propagation models are well understood, defense against worms remains an open problem. One branch of defense research investigates the behavioral difference between worm-infected hosts and normal hosts to set them apart. One particular observation is that a worm-infected host, which scans the Internet with randomly selected addresses, has a much higher connection-failure rate than a normal host. Rate-limit algorithms have been proposed to control the spread of worms by traffic shaping based on connection failure rate. However, these rate-limit algorithms can work properly only if it is possible to measure failure rates of individual hosts efficiently and accurately. This paper points out a serious problem in the prior method and proposes a new solution based on a highly efficient double-bitmap data structure, which places only a small memory footprint on the routers, while providing good measurement of connection failure rates whose accuracy can be tuned by system parameters. KEYWORDS Self-propagating Malware, Connection Failure Behavior, Rate Limitation, Shared Bitmap 1. INTRODUCTION Self-propagating malware (e.g., an Internet worm) exploits security loopholes in server software. It infects vulnerable servers and then uses them to scan the Internet for more vulnerable servers [1 - 3]. In the past two decades, we have witnessed a continuous stream of new worms raging across the Internet [4 - 7], sometimes infecting tens of thousands or even millions of computers and causing widespread service disruption or network congestion. The mechanisms of worm propagation have been well understood [8 - 11], and various propagation models were developed [12 - 15] to demonstrate analytically the properties of how worms spread among hosts across](https://image.slidesharecdn.com/csit54709-160108090527/75/Limiting-Self-Propagating-Malware-Based-on-Connection-Failure-Behavior-1-2048.jpg)
![100 Computer Science & Information Technology (CS & IT) networks. Significant efforts have also been made to mitigate worms, with varying degrees of success and limitations. Worms remain a serious threat to the Internet. Patching defects in software is the most common defense measure, not only to worms but also to other types of malware. However, it is a race for who (good guys or bad guys) will find the security defects first. Software is vulnerable and its hosts are subject to infection before the security problems are identified and patched. Moreover, not all users will patch their systems timely, leaving a window of vulnerability to the adversary that will try to exploit every opportunity. Moore et al. investigated worm containment technologies such as address blacklisting and content filtering, and such systems must interdict nearly all Internet paths in order to be successful [13]. Williamson proposed to modify the network stack to bound the rate of connection requests made to distinct destinations [16]. To be effective, it requires a majority of all Internet hosts are upgraded to the new network stack, which is difficult to realize. Similar Internet-wide upgrades are assumed by other host-based solutions in the literature, each employing intrusion detection and automatic control techniques whose supporting models must be calibrated for the specific machine that they will reside upon [17 - 20]. Avoiding the requirement of coordinated effort across the whole Internet, the distributed anti- worm architecture (DAW) [21] was designed for deployment on the edge routers of an Internet service provider (ISP) under a single administrative control. DAW observes a behavioral difference between worm-infected hosts and normal hosts: as an infected host scans random addresses for vulnerable hosts, it makes connection attempts but most will fail, whereas normal users's connection attempts to their familiar servers are mostly successful. By observing the failed connections made by the hosts, the edge routers are able to separate out hosts with large failure rates and contain the propagation of the worms. With a basic rate-limit algorithm, a temporal rate-limit algorithm and a spatial rate-limit algorithm, DAW offers the flexibility of tightly restricting the worm's scanning activity, while allowing the normal hosts to make successful connections at any rate. However, for rate limit to work properly, we must be able to measure the connection failure rates of individual hosts accurately and efficiently. This paper points out that using Internet Control Message Protocol (ICMP) messages for this purpose [21] is flawed as they are widely blocked on today's Internet, and the total number of message packets in this big data [22] [23] [30] [31] and cloud computing [36 - 39] era is enormous. This paper designs a new measurement method that solves the problem with a highly efficient data structure based on bitmaps, which keeps record of connection attempts and results (success or fail) in bits, from which we can recover the connection failure rates, while removing the duplicate connection failures (which may cause bias against normal hosts). Our double-bitmap solution is highly efficient for online per-packet operations, and the simulation results show that not only does the data structure place a small memory footprint on the routers, but also it provides good measurement of connection failure rates whose accuracy can be tuned by system parameters. The rest of the paper is organized as follows: Section 2 gives the propagation model of random- scanning worms and reviews the rate-limit algorithms based on connection failure rates. Section 3 explains the problem causing inaccurate failure rate measurement and provides a novel solution with double bitmaps. Section 4 presents simulation results. Section 5 draws the conclusion.](https://image.slidesharecdn.com/csit54709-160108090527/75/Limiting-Self-Propagating-Malware-Based-on-Connection-Failure-Behavior-2-2048.jpg)
![Computer Science & Information Technology (CS & IT) 101 2. BACKGROUND 2.1 Propagation of Random-scanning Worms This paper considers a type of common worms that replicates through random scanning of the Internet for vulnerable hosts. Their propagation can be roughly characterized by the classical simple epidemic model [26 - 28]: ( ) ( )(1 ( )), ( ) di t i t i t d t β= − (1) where ( )i t is the percentage of vulnerable hosts that are infected with respect to time t , and β is the rate at which a worm-infected host detects other vulnerable hosts. More specifically, it has been derived [27] that the derivative formula of worm propagation is ( ) ( )(1 ( )), di t V r i t i t dt N = − (2) where r is the rate at which an infected host scans the address space, N is the size of the address space, and V is the total number of vulnerable hosts. Solving the equation, the percentage of vulnerable hosts that are infected over time is ( ) ( ) ( ) . 1 V r t T N V r t T N e i t e − − = + Let v be the number of initially infected hosts at time 0. Because (0) /i v V= , ln N v T r V V v = − ⋅ − . Solving this logistic growth equation for t , we know the time it takes for a percentage ( / )v Vα ≥ of all vulnerable hosts to be infected is ( ) (ln ln( )). 1 N v t r V V v α α α = − ⋅ − − (3) It is clear that ( )t α is inversely proportional to the scanning rate r , which is the number of random addresses that an infected host attempts to contact (for finding and then infecting vulnerable hosts) in a certain measurement period. If we can limit the rate of worm scanning, we can slow down their propagation, buying time for system administrators across the Internet to take actions. 2.2. Behavior-based Rate-Limit Algorithms In order to perform rate-limit, we need to identify hosts that are likely to be worm-infected. One way to do so is observing different behaviors exhibited from infected hosts and normal hosts. One important behavioral observation was made by [21], which argues that infected hosts have](https://image.slidesharecdn.com/csit54709-160108090527/75/Limiting-Self-Propagating-Malware-Based-on-Connection-Failure-Behavior-3-2048.jpg)
![102 Computer Science & Information Technology (CS & IT) much larger failure rates in their initiated Transfer Contorl Protocol (TCP) connections than normal hosts. We can then apply rate limits to hosts with connection failure rates beyond a threshold and thus restrict the speed at which worms are spread to other vulnerable hosts. (Same as our work, the paper [21] studies worms that spread via TCP, which accounts for the majority of Internet traffic.) Below we briefly describe the host behavior difference in connection failure rate, which is defined as the number of failed TCP connection attempts made by a source host during a certain measurement period, where each attempt corresponds to a SYN packet and each SYN-ACK signals a successful attempt, while the absence of a SYN-ACK means a failure. • Suppose a worm is designed to attack a software vulnerability in a certain version of web servers from a certain vendor. Consider an arbitrary infected host. Let N be the total number of possible IP addresses and N′ be the number of addresses held by web servers, which listen to port 80. N N′ = because web servers only account for a small fraction of the accessible Internet. As the infected host picks a random IP address and sends a SYN packet to initiate a TCP connection to port 80 of that address, the connection only has a chance of /N N′ to be successful. It has a chance of 1 / 1N N− ′ ≈ to fail. The experiment in [21] shows that only 0.4% of all connections made to random addresses at TCP port 80 are successful. Together with a high scanning rate, the connection failure rate of an infect host will be high. Moreover, the measured connection failure rate is an approximation of the host's scanning rate. • The connection failure rate of a normal host is generally low because a typical user accesses pre-configured servers (such as mail server and DNS server) that are known to be up for most of the time. An exception is web browsing, where the domain names of web servers are used, which again lead to successful connections for most of the time according to our experiences. Cases when the domain names are mistyped, it result in DNS lookup failure and no connection attempts will be made --- consequently no connection failure will occur. By measuring the connection failure rates of individual hosts, the paper [21] proposes to limit the rate at which connection attempts are made by any host whose failure rate exceeds a certain threshold. By limiting the rate of connection attempts, it reduces the host's connection failure rate back under the threshold. An array of rate-limit algorithms were proposed. The basic algorithm rate-limits individual hosts with excessive failure rates. The temporal rate-limit algorithm can tolerate temporary high failure rates of normal hosts but make sure the long-term average failure rates are kept low. The spatial rate-limit algorithm can tolerate some hosts' high failure rates but make sure that the average failure rates in a network are kept low. An important component that complements the rate-limit algorithms is the measurement of connection failure rates of individual hosts. This component is however not adequately addressed by [21]. As we will point out in the next section, its simple method does not provide accurate measurement on today's Internet. We will provide a new method that can efficiently solve this important problem with a novel data structure of double bitmaps.](https://image.slidesharecdn.com/csit54709-160108090527/75/Limiting-Self-Propagating-Malware-Based-on-Connection-Failure-Behavior-4-2048.jpg)
![Computer Science & Information Technology (CS & IT) 103 3. A DOUBLE-BITMAP SOLUTION FOR LIMITING WORM PROPAGATION In this section, we explain the problem that causes inaccurate measurement of connection failure rates and provide a new measurement solution that can work with existing rate-limit algorithms to limit worm propagation. 3.1. Failure Replies and the Problem of Blocked ICMP Messages We first review the method of measuring the connection failure rates in [21]. After a source host sends a SYN packet to a destination host, the connection request fails if the destination host does not exist or does not listen on the port that the SYN is sent to. In the former case, an ICMP host- unreachable packet is returned to the source host; in the latter case, a TCP RESET packet is returned. The ICMP host-unreachable or TCP RESET packet is defined as a failure reply. The connection failure rate of a host s is measured as the rate of failure replies that are sent to s . The rationale behind this method [21] is that the rate of failure replies sent back to the source host should be close to the rate of failed connections initiated by the host. The underlying assumption is that, for each failed connection, a failure reply (either an ICMP host-unreachable packet or a TCP RESET packet) is for sure to be sent back to the source host. However, this assumption may not be realistic. Today, many firewalls and domain gateways are configured to suppress failure replies. In particular, many organizations block outbound ICMP host-unreachable packets because attacks routinely use ICMP as a reconnaissance tool. When the ICMP host-unreachable packets are blocked, the rate of failure replies sent back to a source host will be essentially much lower than the rate of failed connections that the host has initiated. In other words, a potential worm-affected host may initiate many failed connections, but only a handful of failure replies will be sent back to it. Under these circumstances, the connection failure rate measured by failure replies will be far lower than the actual failure rate, which in turn misleads the rate-limit algorithms and makes them less effective. To make the problem more complicated, when we measure the connection failure rates of individual hosts, all failed connections made from the same source host to the same destination host in each measurement period should be treated as duplicates and thus counted only once. We use an example to illustrate the reason: Suppose the mail server of a host is down and the email reader is configured to automatically attempt to connect to the server after each timeout period (e.g., one minute). In this case, a normal host will generate a lot of failed connections to the same destination, pushing its connection failure rate much higher than the usual value (when the server is not down) and falsely triggering the rate-limit algorithms to restrict the host's access to the Internet. Therefore, when we measure the connection failure rate of a source host, we want to remove the duplicates to the same destination and measure the rate of failed connections to distinct destinations. 3.2 SYN/SYN-ACK Solution and Problems of Duplicate Failures and Memory Consumption We cannot use failure replies to measure the connection failure rates. Another simple solution is to use SYN and SYN-ACK packets. Each TCP connection begins with a SYN packet from the source host. If a SYN-ACK packet is received, we count the connection as a successful one; otherwise, we count it as a failed connection. (Technically speaking, a third packet of ACK from](https://image.slidesharecdn.com/csit54709-160108090527/75/Limiting-Self-Propagating-Malware-Based-on-Connection-Failure-Behavior-5-2048.jpg)
![104 Computer Science & Information Technology (CS & IT) the source to the destination completes the establishing of the connection. For our anti-worm purpose, however, the returned SYN-ACK already shows that the destination host is reachable and listens to the port, which thus does not signal worm behavior --- random scanning likely hits unreachable hosts or hosts not listening to the port.) Using SYN and SYN-ACK packets, a naive solution is for each edge router to maintain two counters, sk and rk , for each encountered source address, where sk is the rate of SYN packets sent by the source (i.e., the number of SYN packets sent during a measurement period), and rk is the rate of SYN-ACK packets received by the source (i.e., the number of SYN-ACKs received during a measurement period). The connection failure rate k is simply s rk k− . This simple solution is memory efficient, as it only requires 64 bits per source host for failure rate measurement, assuming each counter takes 32 bits. However, this solution cannot address the problem of duplicate failures. As discussed in Section 3.1, when we measure the connection failure rate of a source host, we want to remove the duplicates to the same destination in the same measurement period, because measuring duplicate failures may cause bias against normal hosts. Maintaining two counters alone cannot achieve the goal of removing duplicate failures. An alternative solution is to have the edge router store a list of distinct destination addresses for each source host. However, such per-source information consumes a large amount of memory. Suppose each address costs 32 bits. The memory required to store each source host's address list will grow linearly with the rate of distinct destination hosts that the source host initiates connection requests to. For example, the main gateway at our campus observes an average of more than 10 million distinct source-destination pairs per day. If the edge router keeps per-source address list, it will cost more than 320 megabits of memory, which soon exhausts the small on- die SRAM memory space of the edge router. Therefore, this solution is not feasible either. The major goal of this paper is to accurately measure the connection failure rates with a small memory. However, tradeoffs must be made between measurement accuracy and memory consumption under the requirement of duplicate failure removal. Existing research uncovered the advantages of using Bloom filters [28] [29] or bitmaps [24] [25] [32 - 35] [40] to compress the connection information in limited memory space and automatically filter duplicates, which can be adopted to measure the connection failure rates. For example, the edge router can maintain two bitmaps for each source host, and map each SYN/SYN-ACK packet of the host into a bit in the host's corresponding bitmap, from which the rate of SYN/SYN-ACK packets of each host can be recovered. However, the measurement accuracy depends on setting the bitmap size for each source host properly in advance. In practice, it is difficult to pre-determine the values as different source hosts may initiate connection requests at unpredictable and different rates, which limits the practicability of this solution as well. 3.3. Double Bitmaps In order to address the problems of duplicate failures and memory consumption, instead of using per-source address lists or bitmaps, we incorporate two shared bitmaps to store the SYN/SYN- ACK information of all source hosts. Our double-bitmap solution includes two phases: in the first phase, the edge router keeps recoding the SYN/SYN-ACK packets of all source hosts through setting bits in the bitmaps; in the second phase, the network management center will recover the connection failure rates from the two bitmaps based on maximum likelihood estimation (MLE),](https://image.slidesharecdn.com/csit54709-160108090527/75/Limiting-Self-Propagating-Malware-Based-on-Connection-Failure-Behavior-6-2048.jpg)
![Computer Science & Information Technology (CS & IT) 105 and notify the edge router to apply rate limit algorithms to limit the connection attempts made by any host whose failure rate exceeds some threshold. Below we will explain the two phases, and then mathematically derive an estimator to calculate the connection failure rate. 3.3.1. Phase I: SYN / SYN-ACK Encoding In our solution, each edge router maintains two bitmaps sB and rB , which encode the distinct SYN packets and SYN-ACK packets of all source hosts within its network, respectively. Let sm and rm be the number of bits in sB and rB correspondingly. Below we will explain how an edge router encodes the distinct SYN packet information into sB , which can later be used to estimate the SYN sending rate sk for each source host. The way for the edge router to encode the distinct SYN-ACK packet information into rB is quite similar, which we omit. For each source host src , the edge router randomly selects sl ( sm= ) bits from the bitmap sB to form a logical bitmap src , which is denoted as ( )LB src . The indices of the selected bits are ( [0])H src R⊕ , ( [1])H src R⊕ , L , ( [ 1])sH src R l⊕ − , where ⊕ is bitwise XOR, ( )H L is a hash function whose range is [0, )sm , and R is an integer array storing randomly chosen constants to arbitrarily alter the hash result. Similarly, the logical bitmap can be constructed from sB for any other hosts. Essentially, we embed the bitmaps of all possible hosts in sB . The bit- sharing relationship is dynamically determined on the fly as each new host src′ will be allocated a logical bitmap ( )LB src′ from sB to store its SYN packet information. Given above notations and data structures, the online coding works as follows. At the beginning of each measurement period, all bits in sB are reset to zeros. Suppose a SYN packet signatured with a ,src dst host address pair is routed by the edge router. The router will randomly select a bit from the logical bitmap ( )LB src based on src and dst , and set this bit in sB to be one. The index of the bit to be set for this SYN packet is given as follows: ( [ ( )mod ]).sH src R H dst K l⊕ ⊕ The second hash, ( )H dst K⊕ , ensures that the bit is pseudo-randomly selected from ( )LB src , and the private key K is introduced to prevent the hash collision attacks. Therefore, the overall effect to store the SYN packet information is : [ ( [ ( )mod ])] 1.sB H src R H dst K l⊕ ⊕ = Similarly, the edge router only needs to set a bit in the bitmap rB to be one for each SYN-ACK packet using the same mechanism. Note that in our solution, to store a SYN/SYN-ACK packet, the router only performs two hash operations and sets a single bit in its bitmap, which is quite efficient. In addition, duplicates of SYN and SYN-ACK information with same ,src dst](https://image.slidesharecdn.com/csit54709-160108090527/75/Limiting-Self-Propagating-Malware-Based-on-Connection-Failure-Behavior-7-2048.jpg)
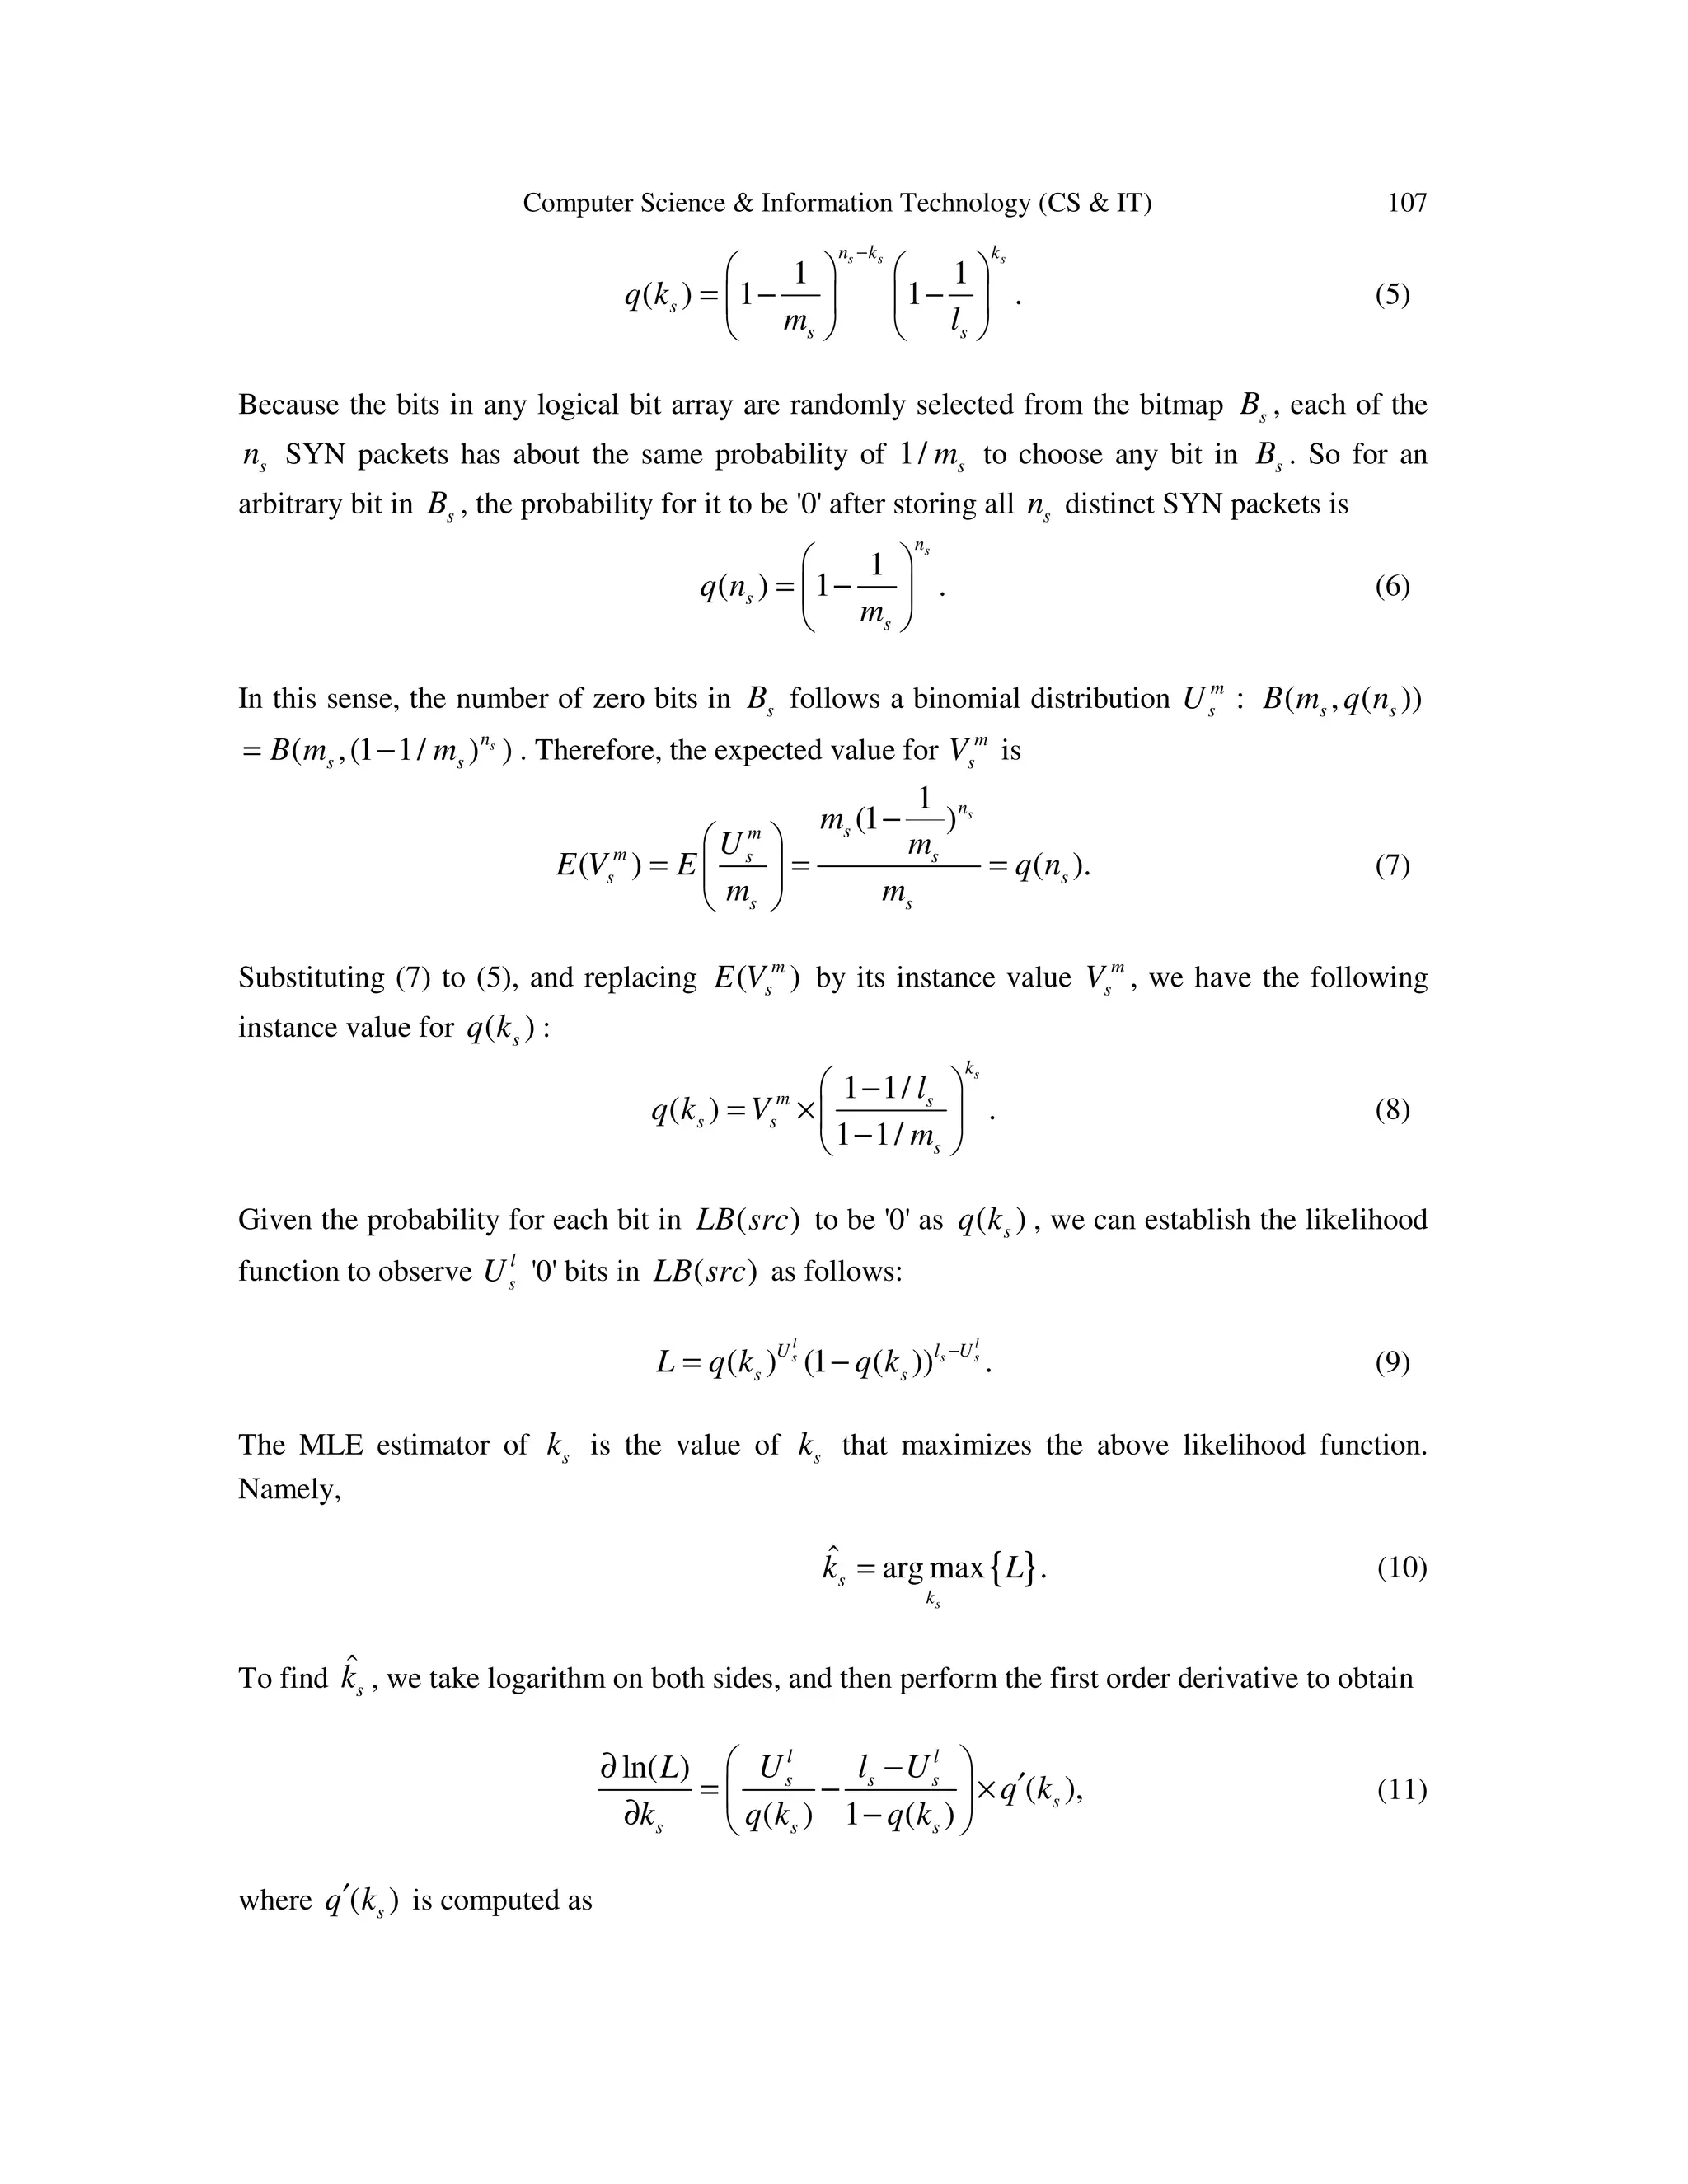
![106 Computer Science & Information Technology (CS & IT) signature will mark the same bit in the shared bitmaps such that the duplicate information is filtered as desired. 3.3.2. Phase II: Failure Rate Measurement At the end of each measurement period, the edge router will send the two bitmaps sB and rB to the network management center (NMC), which will estimate connection failure rate k for each source host src based on sB and rB , and notify the edge router to apply rate limit algorithms to limit the connection attempts made by any host whose failure rate exceeds some threshold. Since rate-limit algorithms have been fully studied in [21], we will focus on the measurement of connection failure rates based on the bitmaps. The measurement process is described in the following. First, the NMC extracts the logical bitmaps ( )LB src and ( )LB src′ of each source host src from the two bitmaps sB and rB , respectively. Second, the NMC counts the number of zeros in ( )LB src , ( )LB src′ , sB and rB , which are denoted by l sU , l rU , m sU , and m rU , respectively. Then the NMC divides them by the corresponding bitmap size sl , rl , sm , and rm , and calculates the fraction of bits whose values are zeros in ( )LB src , ( )LB src′ , sB and rB correspondingly. That is, /l l s s sV U l= , /l l r r rV U l= , /m m s s sV U m= , and /m m r r rV U m= . Finally, the NMC uses the following formula to estimate connection failure rate k for source host src : ln ln ln lnˆ 1 1 1 1 ln(1 ) ln(1 ) ln(1 ) ln(1 ) l m l m s s r r s s r r V V V V k l m l m − − = − − − − − − − (4) 3.3.3. Derivation of the MLE estimator Now we follow the standard MLE method to get the MLE estimators ˆ sk and ˆ rk of sk and rk , respectively, and then derive ˆk given by (4). Since the way to derive the MLE estimator for sk and rk is quite similar, we will only derive the MLE estimator formula for ˆ sk , and directly give the result for ˆ rk . To derive ˆ sk , we first analyze the probability ( )sq k for an arbitrary bit in ( )LB src to be '0', and use ( )sq k to establish the likelihood function L to observer l sU '0' bits in ( )LB src . Finally, maximizing L with respect to sk will lead to the MLE estimator, ˆ sk . Note that sk is the actual rate of distinct SYN packets sent by a source host src , and sn is the rate of distinct SYN packets sent by all hosts within the router's network. Consider an arbitrary bit b in ( )LB src . A SYN packet sent by src has a probability of 1/ sl to set b to '1', and a SYN packet sent by any other host has a probability of 1/ sm to set b to '1'. Hence, the probability ( )sq k for bit b to remain '0' at the end of the measurement period is](https://image.slidesharecdn.com/csit54709-160108090527/75/Limiting-Self-Propagating-Malware-Based-on-Connection-Failure-Behavior-8-2048.jpg)
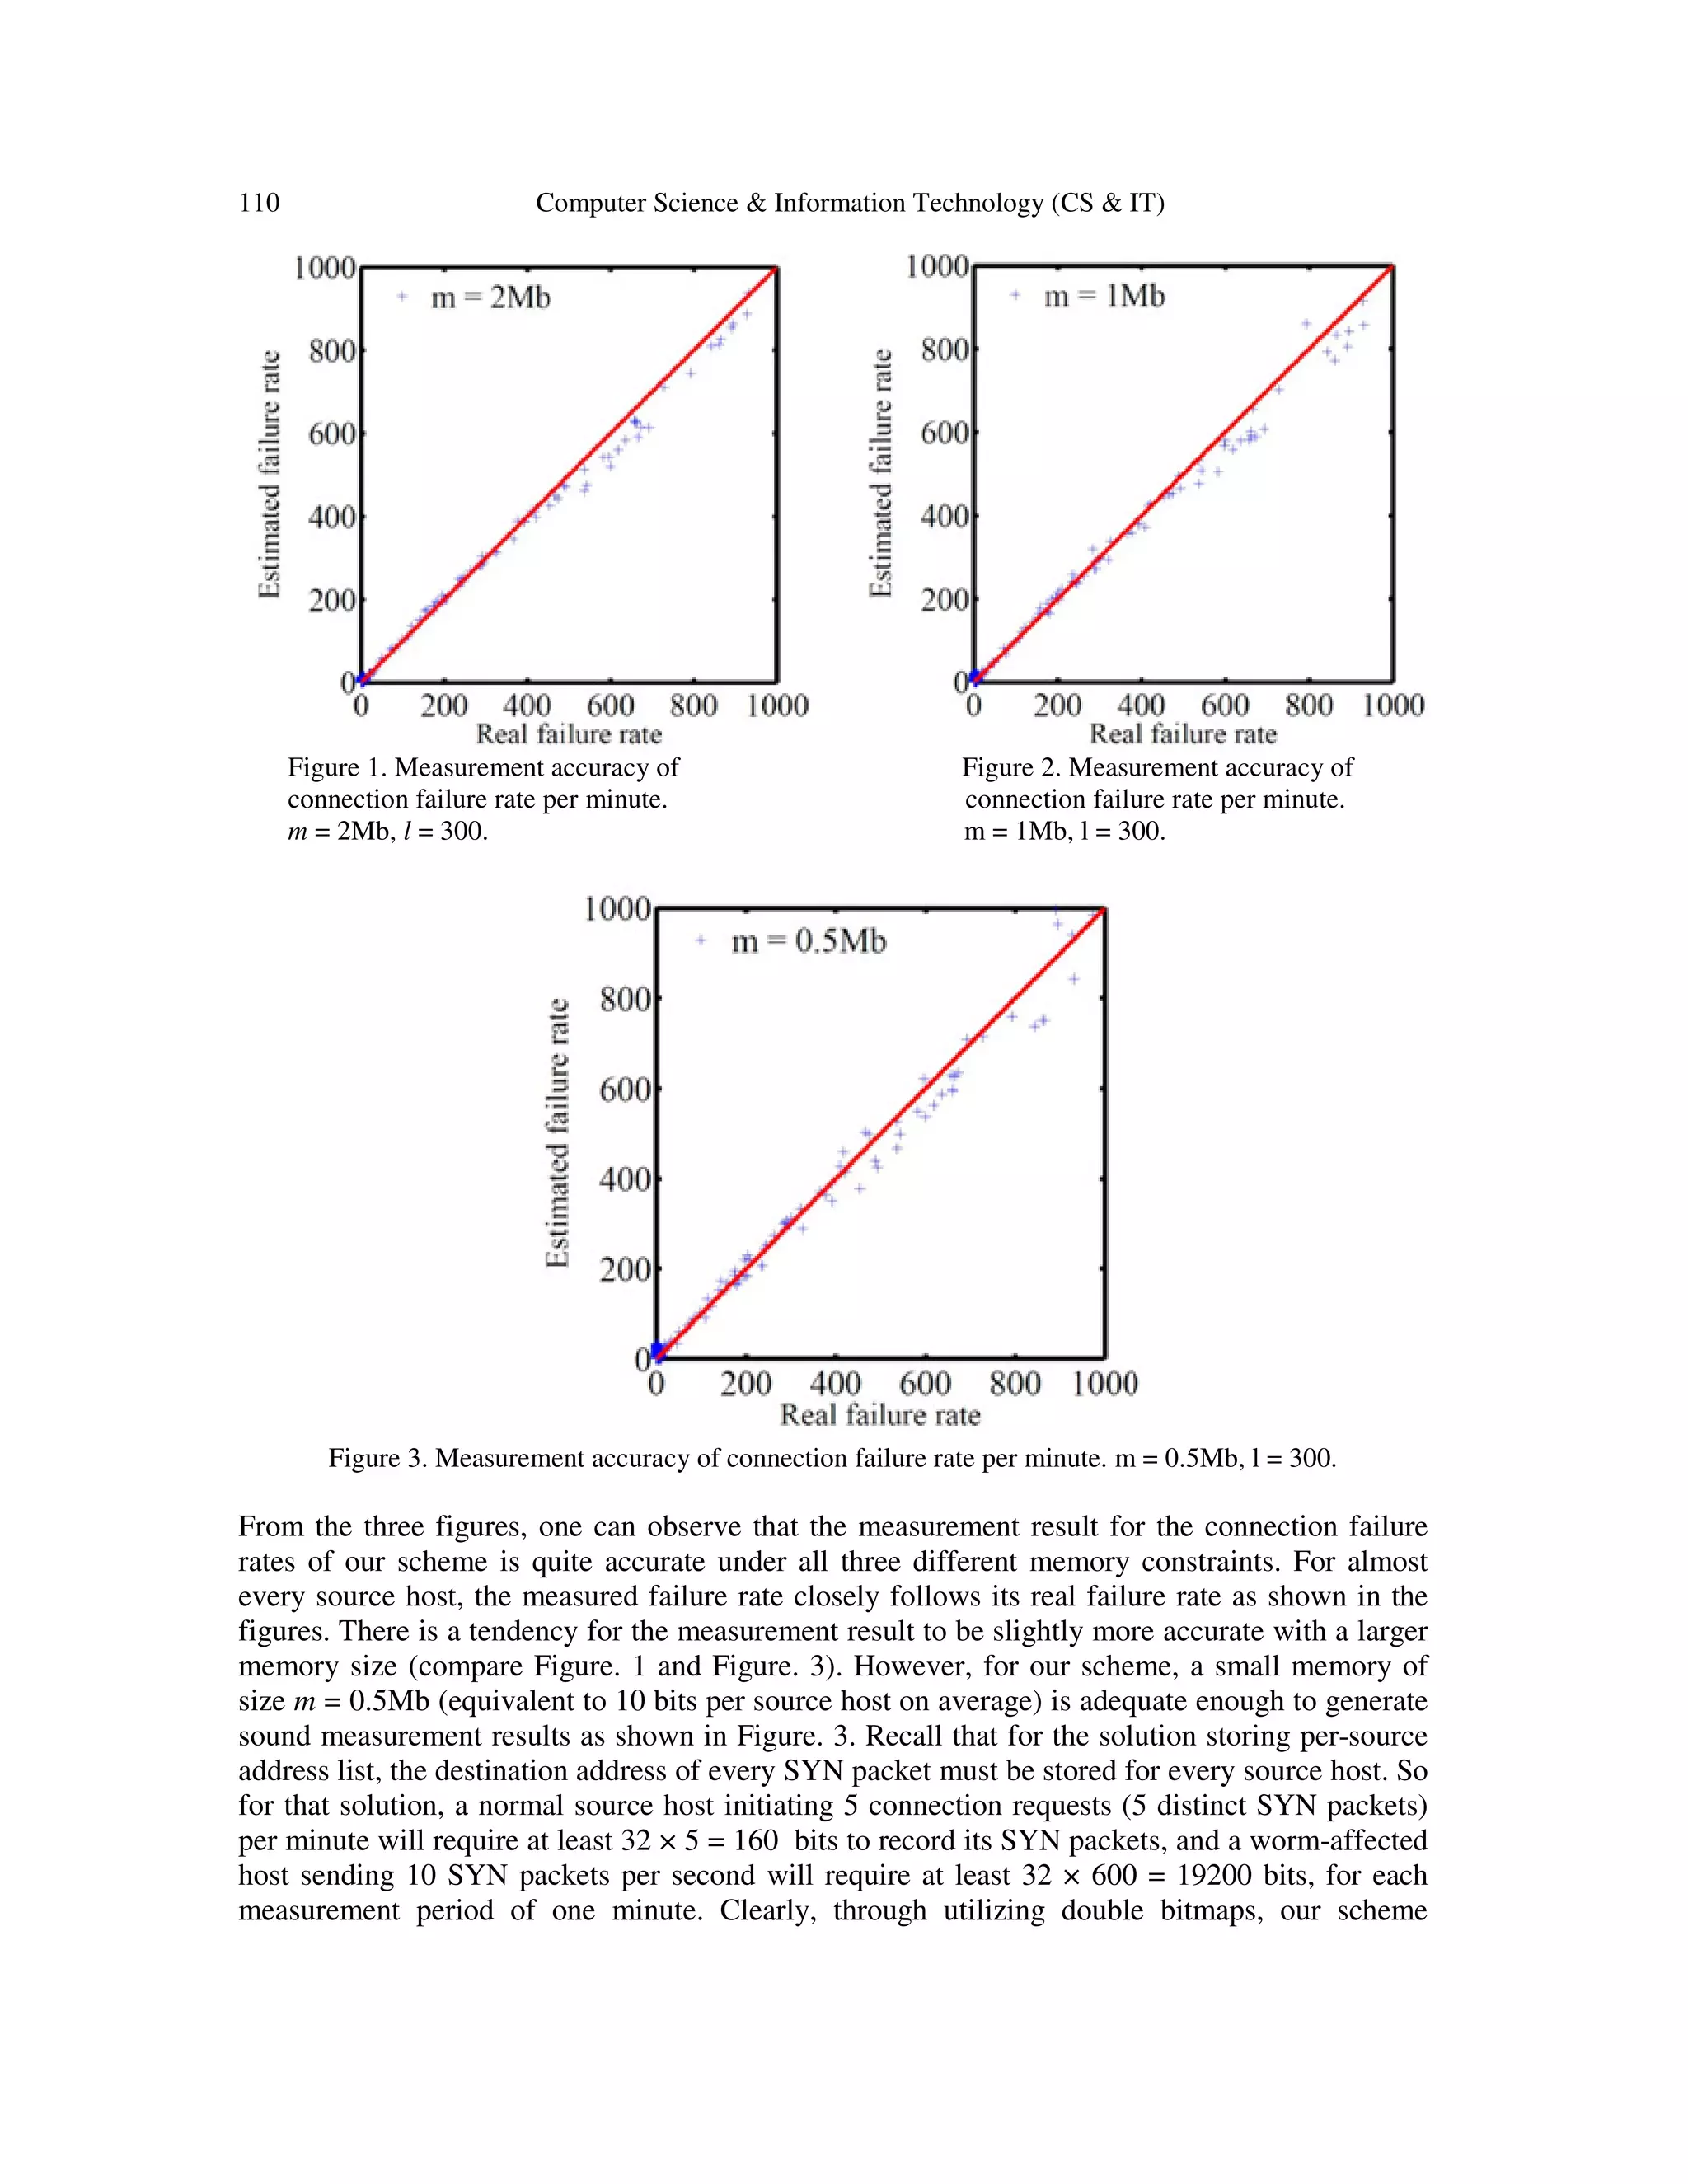
![Computer Science & Information Technology (CS & IT) 109 our simulations, we purposely allocate memory with small sizes to encode the information of distinct SYN and SYN-ACK packets for all source hosts, such that the average memory size for each source host will be ranging from 10 bits to 40 bits only. As we explained in Section 3.2, the solution with per-source address lists or bitmaps will not work with this small memory size. Therefore, our solution outperforms in the aspect of greatly reducing the required online memory footprint for connection failure rate measurement while achieving duplicate failure removal. 4.1. Simulation Setup Our simulations are conducted under the following setups. We simulate 50,000 distinct source hosts as normal hosts, and 100 distinct source hosts as worm-affected hosts. For the normal hosts, they will send distinct SYN packets to different destination hosts, with a rate following an exponential distribution whose mean is 5 distinct SYN packets per minute. For each distinct SYN packet that a normal host sends out, a corresponding SYN-ACK packet will be sent back to the host with a probability, which follows a uniform distribution in the range of [0.8, 1.0]. As for the worm-affected hosts, we simulate their aggressive scanning behavior by having them send distinct SYN packets to different destination hosts with a higher rate, which follows another exponential distribution whose mean is 10 distinct SYN packets per second. Since the worm- affected hosts will randomly scan the whole destination space, their failure rate is expected to be very high as we explained earlier. Therefore, in our simulations, no SYN-ACK packets will be sent back to them. Suppose each measurement period is 1 minute. Then each normal host will send 5 distinct SYN packets and receive 4.5 distinct SYN-ACK packets on average, and each worm-affected host will send 600 distinct SYN packets and 0 SYN-ACK packet on average, during each measurement period. In our simulations, all the SYN and SYN-ACK packets are processed by a single simulated edge router and a simulated network management center according to our two-phase measurement scheme. First of all, the SYN and SYN-ACK packets are encoded into two m-bit bitmaps sB and rB of the edge router, respectively, as described in Section 3.3.1 (Phase I: SYN/SYN-ACK Encoding). After all packets are encoded into the two bitmaps sB and rB , the edge router will send sB and rB to the network management center, which will estimate the connection failure rate of each source host based on sB and rB offline, as described in Section 3.3.2 (Phase II: Failure Rate Measurement). 4.2. Simulation Results We conduct three sets of simulations with three different sizes of memory allocated for the bitmaps sB and rB , s rm m m= = = 0.5Mb, 1Mb, and 2Mb, to observe the measurement accuracy under different memory constraints. The sizes of the logical bitmaps for each host is set to be 300s rl l l= = = . Figure. 1-3 present the simulation results when the allocated memory m equals 2Mb, 1Mb, and 0.5Mb, respectively. Since there are a total of 50,100 source hosts, the average memory consumption per source host will be about 40 bits, 20 bits, and 10 bits, accordingly. In each figure, each point represents a source host, with its x-coordinate showing the actual connection failure rate k (per minute) and y-coordinate showing the estimated connection failure rate ˆk (per minute) measured by our scheme. The equality line y = x is also drawn for reference. Clearly, the closer a point is to the quality line, the better the measurement result.](https://image.slidesharecdn.com/csit54709-160108090527/75/Limiting-Self-Propagating-Malware-Based-on-Connection-Failure-Behavior-11-2048.jpg)
![Computer Science & Information Technology (CS & IT) 111 outperforms the solution storing address lists, because it can work well with a much more strict memory constraint. 5. CONCLUSION This paper proposes a new method of measuring connection failure rates of individual hosts, using a novel data structure based on double bitmaps. It addresses an important problem in rate- limiting worm propagation, where inaccurate failure rates will affect the performance of rate- limit algorithms. The past method relies on ICMP host-unreachable messages, which are however widely blocked on today's Internet. The new method makes the measurement based on SYN and SYN-ACK packets, which is more reliable and accurate. Its bitmap design helps significantly to reduce the memory footprint on the routers and eliminates the duplicate connection failures (another problem of the previous method). ACKNOWLEDGEMENTS This work is supported in part by a grant from Florida Cybersecurity Center. REFERENCES [1] M. Barwise, “What is an internet worm?,” http://www.bbc.co.uk/webwise/guides/internet-worms, 2010. [2] D. M. Kienzle and M. C. Elder, “Recent Worms: A Survey and Trends,” Proc. of ACM Workshop on Rapid Malcode, pp. 1-10, 2003. [3] J. Rochlis and M. Eichin, “With Microscope and Tweezers: The Worm from MIT's Perspective,” Communication of the ACM, vol. 32, no. 6, pp. 689-698, 1989. [4] J. Maniscalchi, “Worm Evolution,” http://www.digitalthreat.net/2009/05/worm-evolution/, 2009. [5] Computer Emergency Response Team, “CERT Advisory CA-2001-26 Nimda Worm,” http://www.cert.org/advisories/CA-2001-26.html, 2001. [6] Computer Emergency Response Team, “CERT Advisory CA-2003-04 MS-SQL Server Worm,” http://www.cert.org/advisories/CA-2003-04.html, 2003. [7] Computer Emergency Response Team, “CERT Alert Conficker Worm Targets Microsoft Windows Systems,” https://www.us-cert.gov/ncas/alerts/TA09-088A, 2013. [8] Z. Chen and C. Ji, “Measuring Network-Aware Worm Spreading Ability,” Proc. of IEEE INFOCOM, pp. 116-124, 2007. [9] Z. Li, L. Wang, Y. Chen, and Z. Fu, “Network-Based and Attack-Resilient Length Signature Generation for Zero-Day Polymorphic Worms,” Proc. of IEEE International Conference on Network Protocols (ICNP), pp. 164-173, 2007. [10] P. K. Manna, S. Chen, and S. Ranka, “Inside the Permutation-Scanning Worms: Propagation Modeling and Analysis,” IEEE/ACM Transactions on Networking, vol. 18, no. 3, pp. 858-870, 2010.](https://image.slidesharecdn.com/csit54709-160108090527/75/Limiting-Self-Propagating-Malware-Based-on-Connection-Failure-Behavior-13-2048.jpg)
![112 Computer Science & Information Technology (CS & IT) [11] S. Stafford and J. Li, “Behavior-Based Worm Detectors Compared,” Recent Advances in Intrusion Detection, pp. 38-57, 2010. [12] M. Liljenstam, Y. Yuan, B. Premore, and D. Nicol, “A Mixed Abstraction Level Simulation Model of Large-Scale Internet Worm Infestations,” Proc. of 10th IEEE/ACM Symposium on Modeling, Analysis and Simulation of Computer and Telecommunication Systems (MASCOTS), 2002. [13] D. Moore, C. Shannon, G. M. Voelker, and S. Savage, “Internet Quarantine: Requirements for Containing Self-Propagating Code,” Proc. of IEEE INFOCOM, 2003. [14] S. Staniford, V. Paxson, and N. Weaver, “How to Own the Internet in Your Spare Time,” Proc. of 11th USENIX Security Symposium, 2002. [15] C. C. Zou, W. Gong, and D. Towsley, “Code Red Worm Propagation Modeling and Analysis,” Proc. of ACM CCS, 2002. [16] M. M. Williamson, “Throttling Viruses: Restricting Propagation to Defeat Malicious Mobile Code,” Proc. of Annual Computer Security Application Conference, 2002. [17] R. Dantu, J. W. Cangussu, and S. Patwardhan, “Fast Worm Containment Using Feedback Control,” IEEE Transactions on Dependable and Secure Computing, vol. 4, no. 2, pp. 119-136, 2007. [18] O. P. Kreidl and T. M. Frazier, “Feedback Control Applied to Survivability: A Host-Based Autonomic Defense System,” IEEE Transactions on Reliability, vol. 53, no. 1, pp. 148-166, 2004. [19] X. Yan and Y. Zou, “Optimal Internet Worm Treatment Strategy Based on yhe Two-Factor Model,” ETRI journal, vol. 30, no. 1, pp. 81-88, 2008. [20] S. Zonouz, H. Khurana, W. H. Sanders, T. M. Yardley, et al., “RRE: A Game-Theoretic Intrusion Response and Recovery Engine,” IEEE Transactions on Parallel and Distributed Systems, vol. 25, no. 2, pp. 395-406, 2014. [21] S. Chen and Y. Tang, “DAW: A Distributed Antiworm System,” IEEE Transactions on Parallel and Distributed Systems, vol. 18, no. 7, pp. 893-906, 2007. [22] S. Sharma, U. S. Tim, J. Wong, S. Gadia, and S. Sharma, “A Brief Review on Leading Big Data Models,” Data Science Journal, vol. 13, pp. 138-157, 2014. [23] S. Sharma, R. Shandilya, S. Patnaik, and A. Mahapatra, “Leading NoSQL models for handling Big Data: a brief review,” International Journal of Business Information Systems, 2015. [24] Y. Zhou, Q. Xiao, Z. Mo, S. Chen, and Y. Yin, “Privacy-Preserving Point-to-Point Transportation Traffic Measurement through Bit Array Masking in Intelligent Cyber-physical Road Systems,” Proc. of IEEE International Conference on Cyber, Physical and Social Computing (CPSCom), pp. 826-833, 2013. [25] Y. Zhou, Z. Mo, Q. Xiao, S. Chen, and Y. Yin, “Privacy-Preserving Transportation Traffic Measurement in Intelligent Cyber-Physical Road Systems,” IEEE Transactions on Vehicluar Technologies, 2015. [26] H. W. Hethcote, “The Mathematics of Infectious Diseases,” SIAM Review, vol. 42, no. 4, pp. 599- 653, 2000.](https://image.slidesharecdn.com/csit54709-160108090527/75/Limiting-Self-Propagating-Malware-Based-on-Connection-Failure-Behavior-14-2048.jpg)
![Computer Science & Information Technology (CS & IT) 113 [27] C. C. Zou, W. Gong, and D. Towsley, “Slowing Down Internet Worms,” Proc. of IEEE International Conference on Distributed Computing Systems (ICDCS), pp. 312-319, 2004. [28] Y. Qiao, T. Li, and S. Chen, “Fast Bloom Filters and Their Generalization,” IEEE Transactions on Parallel and Distributed Systems, vol. 25, no. 1, pp. 93-103, 2014. [29] O. Rottenstreich, Y. Kanizo, and I. Keslassy, “The Variable-Increment Counting Bloom Filter,” IEEE/ACM Transactions on Networking, vol. 22, no. 4, pp. 1092-1105, 2014. [30] Y. Zhou, S. Chen, Z. Mo, and Q. Xiao, “Point-to-Point Traffic Volume Measurement through Variable-Length Bit Array Masking in Vehicular Cyber-Physical Systems,” Proc. of IEEE International Conference on Distributed Computing Systems (ICDCS), pp. 51-60, 2015. [31] Y. Zhou, S. Chen, Y. Zhou, M. Chen, and Q. Xiao, “Privacy-Preserving Multi-Point Traffic Volume Measurement through Vehicle to Infrastructure Communications,” IEEE Transactions on Vehicular Technologies, 2015. [32] S. Sharma, U. S. Tim, S. Gadia, R. Shandilya, and S. Peddoju, “Classification and Comparison of NoSQL Big Data Models,” International Journal of Big Data Intelligence (IJBDI), vol. 2, no. 3, 2015. [33] S. Sharma, “Evolution of as-a-Service Era in Cloud,” arXiv preprint arXiv:1507.00939, 2015. [34] T. Li and S. Chen, “Traffic Measurement on the Internet,” Springer Science & Business Media, 2012. [35] T. Li, S. Chen, and Y. Ling, “Per-Flow Traffic Measurement Through Randomized Counter Sharing,” IEEE/ACM Transactions on Networking, vol. 20, no. 5, pp. 1622-1634, 2012. [36] Z. Mo, Y. Zhou, S. Chen, and C. Xu, “Enabling Non-repudiable Data Possession Verification in Cloud Storage Systems,” Proc. of IEEE International Conference on Cloud Computing, pp. 232-239, 2014. [37] Z. Mo, Q. Xiao, Y. Zhou,and S. Chen, “On Deletion of Outsourced Data in Cloud Computing,” IEEE International Conference on Cloud Computing, pp. 344-351, 2014. [38] Z. Mo, Y. Zhou, and S. Chen, “A Dynamic Proof of Retrievability (PoR) Scheme with O(logn) Complexity,” Proc. of IEEE International Conference on Communications, pp. 912-916, 2012. [39] Z. Mo, Y. Zhou, and S. Chen, “An Efficient Dynamic Proof of Retrievability Scheme,” ZTE Communications, vol. 2, p. 008, 2013. [40] Q. Xiao, M. Chen, S. Chen, and Y. Zhou, “Temporally or Spatially Dispersed Joint RFID Estimation Using Snapshots of Variable Lengths,” Proc. of ACM Mobihoc, 2015. AUTHORS Yian Zhou received her B.S. degree in computer science and B.S. degree in economics from the Peking University of China in 2010, and is currently pursuing her Ph.D. degree in computer and information science and engineering at the University of Florida, Gainesville, FL, USA. Her advisor is Prof. Shigang Chen. Her research interests include traffic flow measurement, cyber-physical systems, big network data, security and privacy, and cloud computing.](https://image.slidesharecdn.com/csit54709-160108090527/75/Limiting-Self-Propagating-Malware-Based-on-Connection-Failure-Behavior-15-2048.jpg)