Download as PDF, PPTX
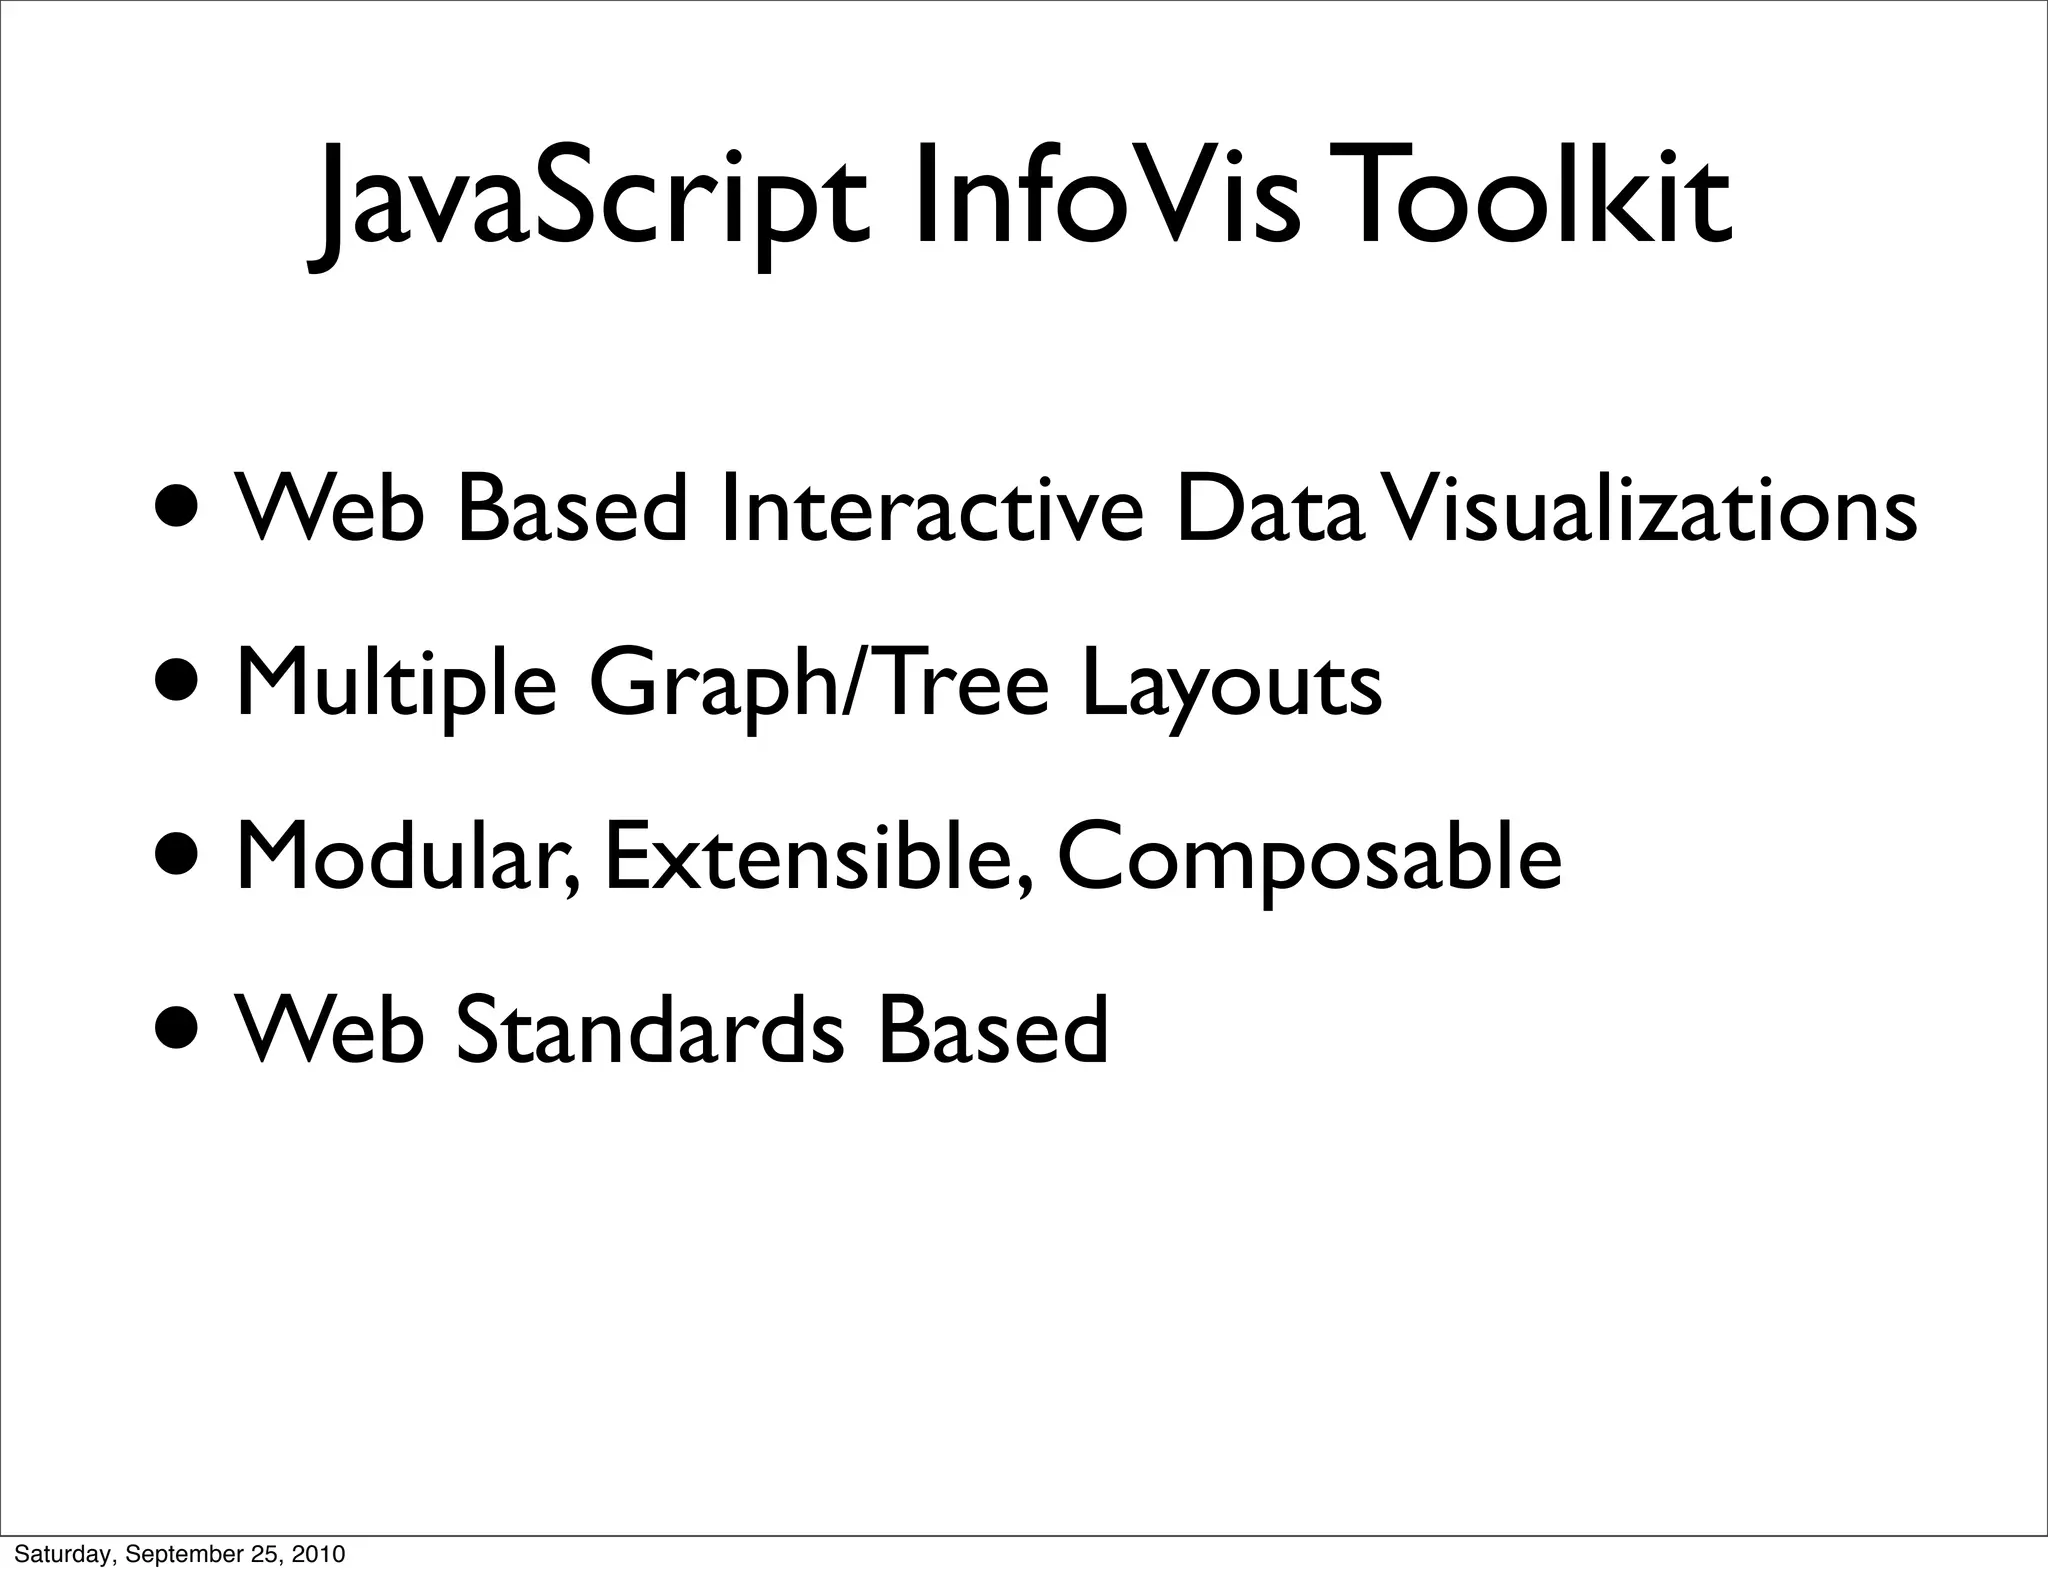
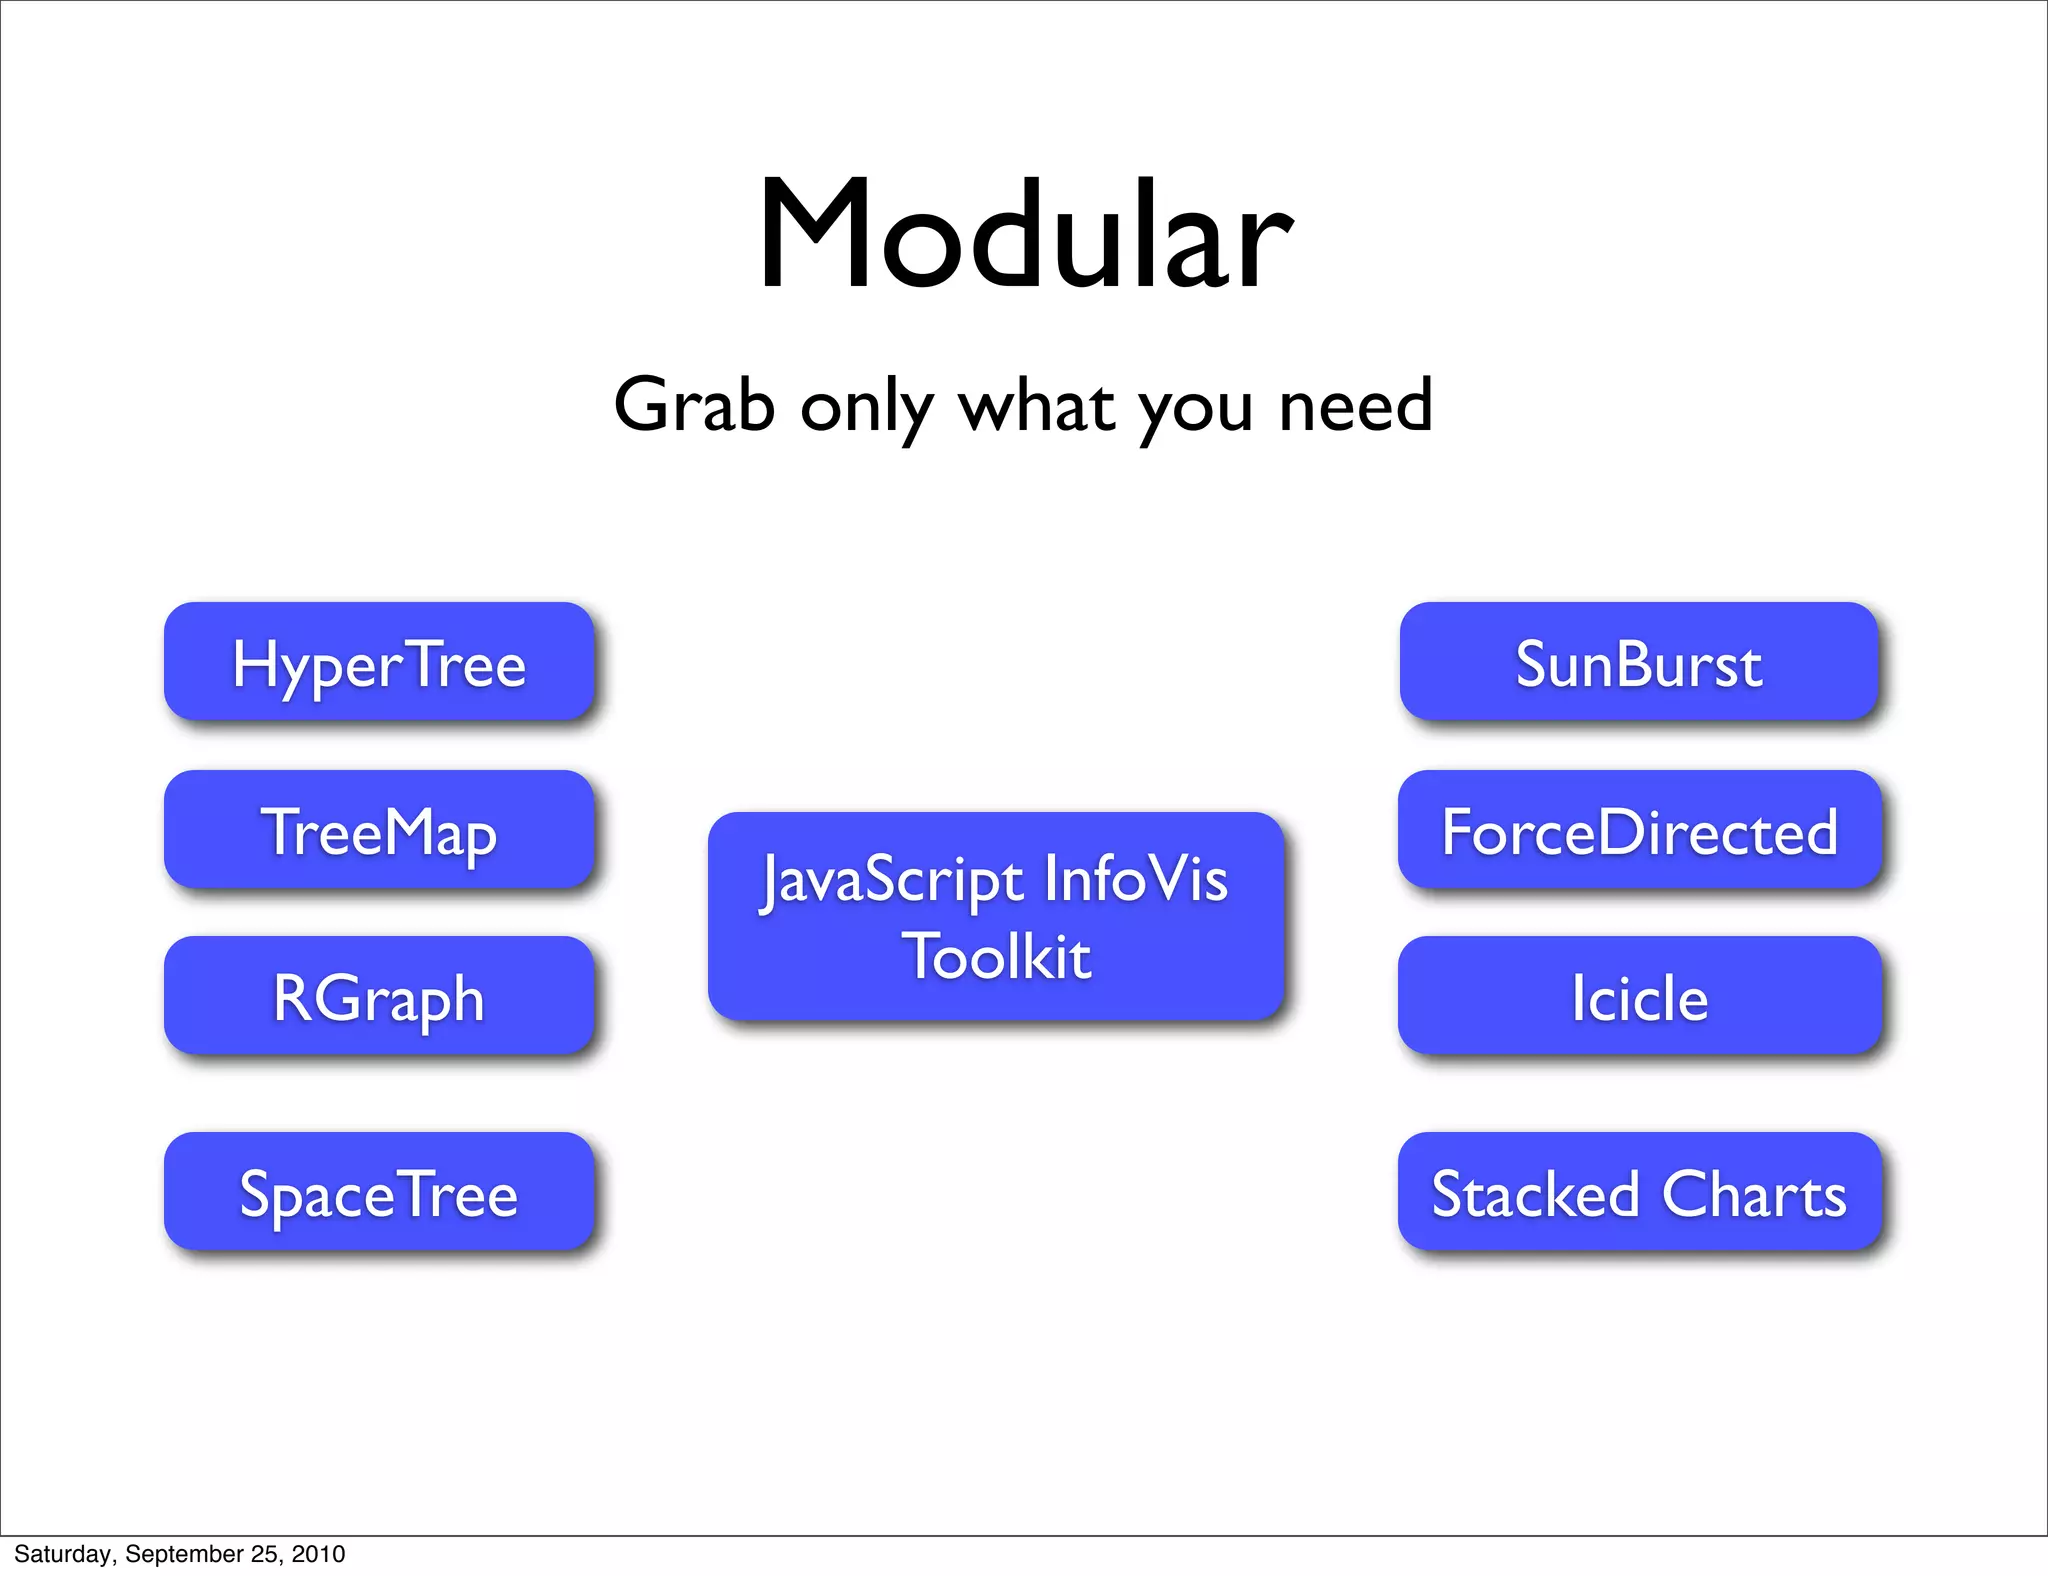
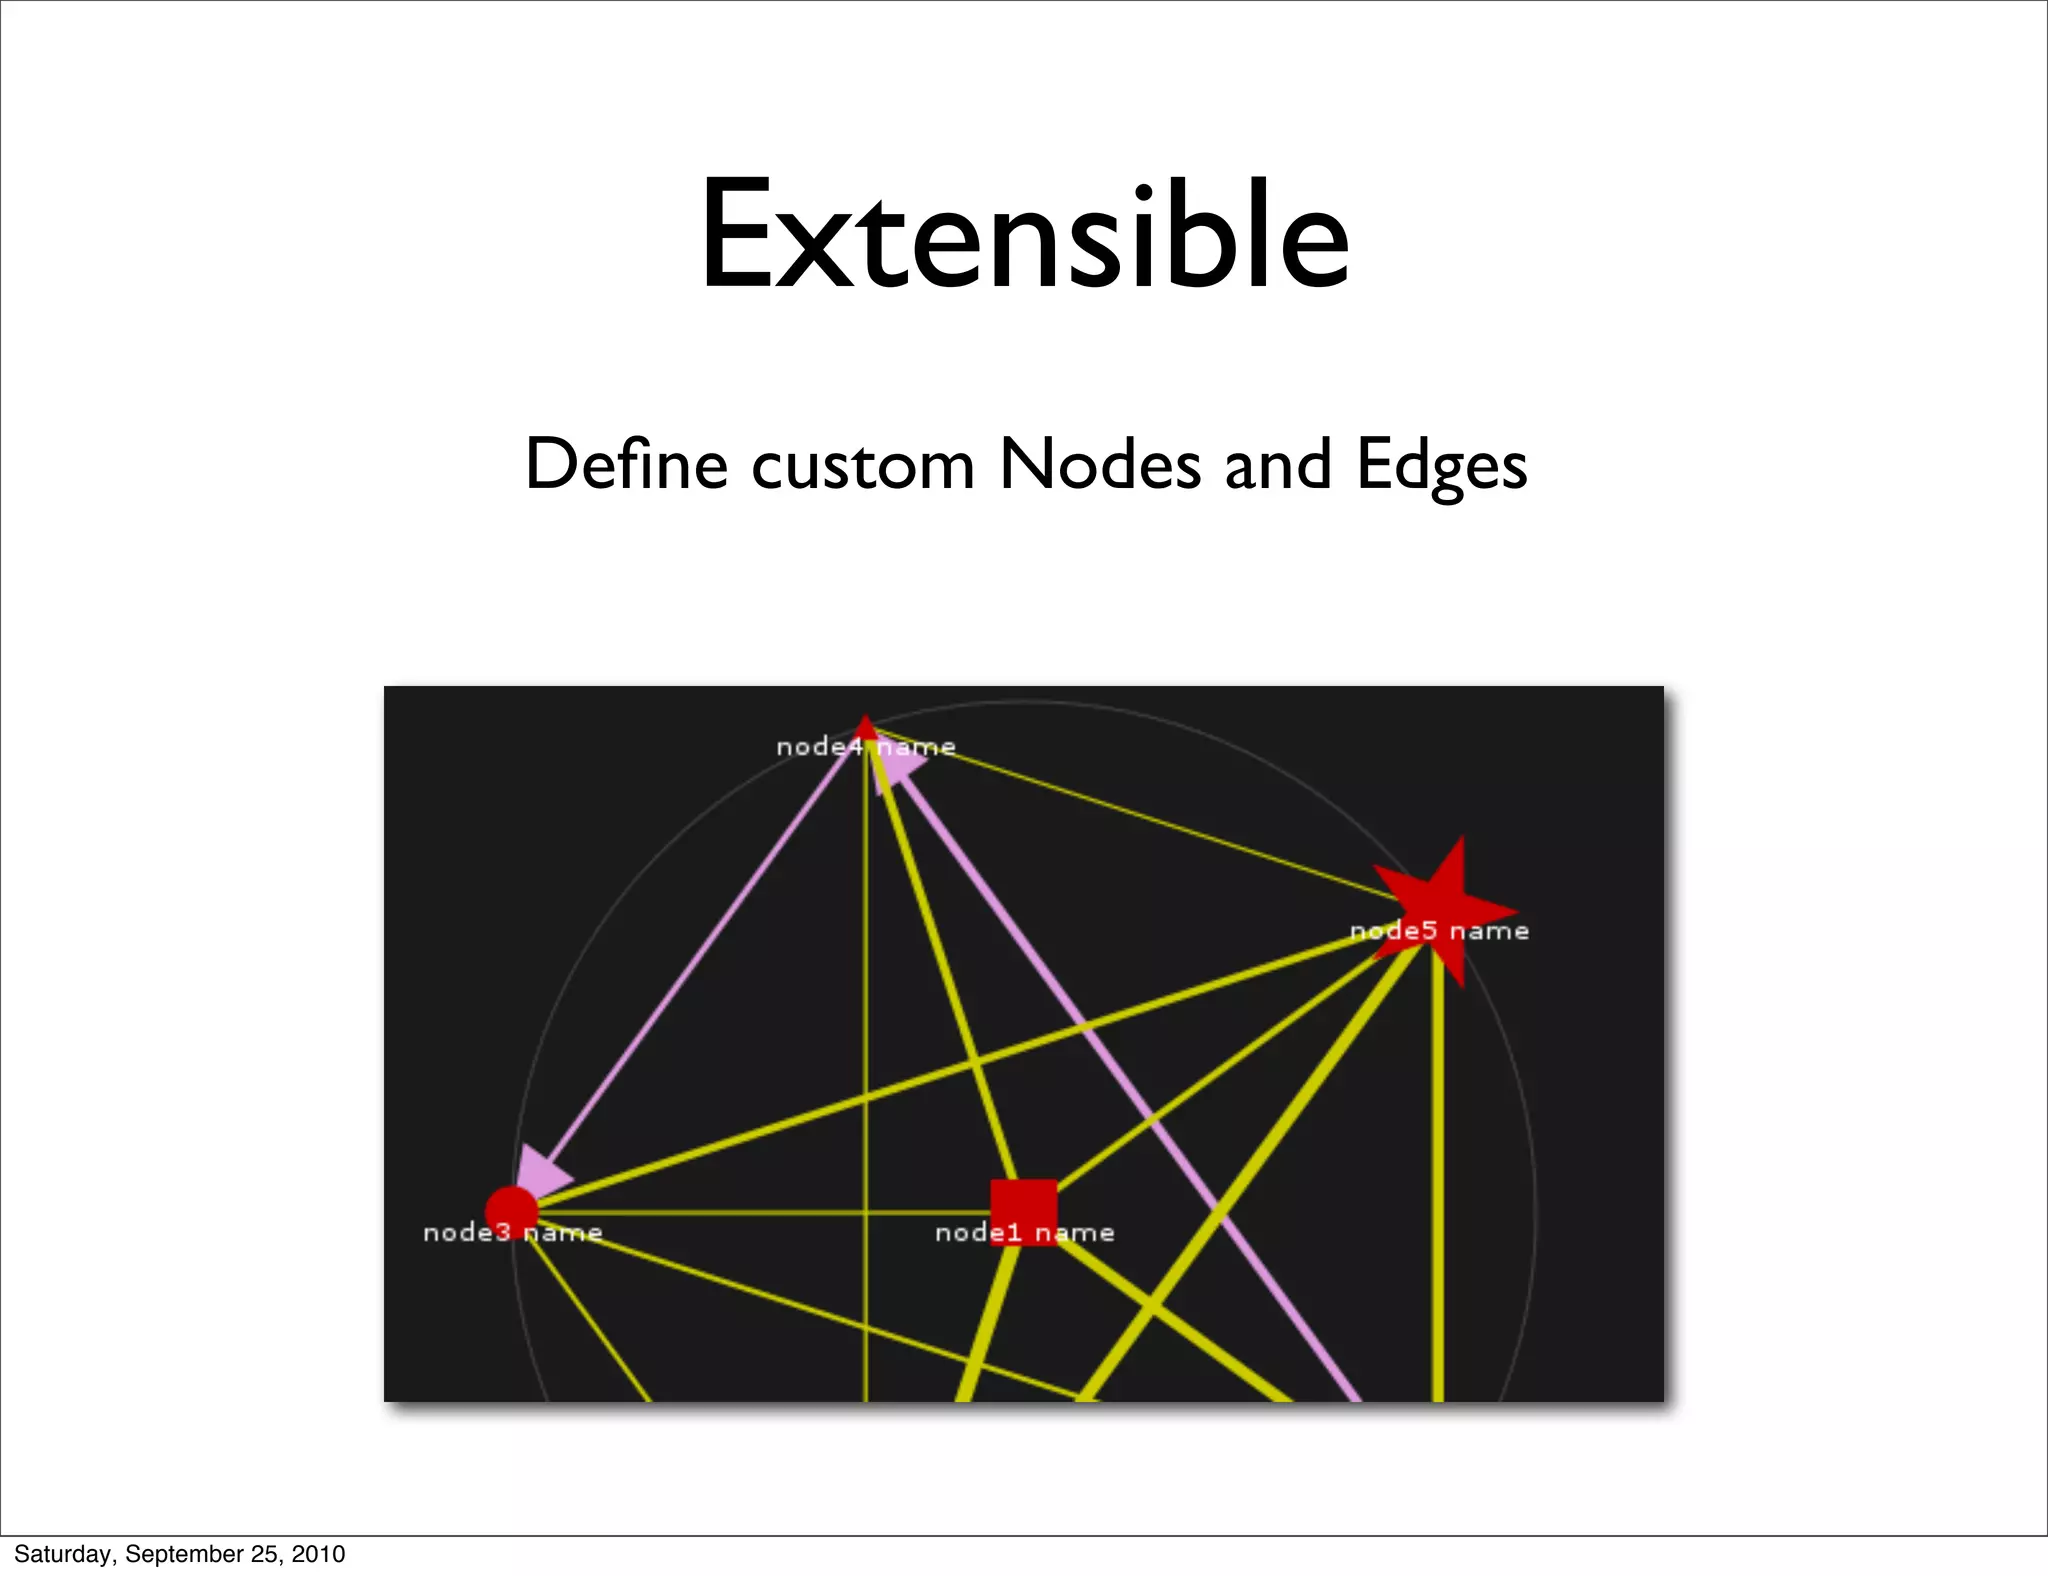
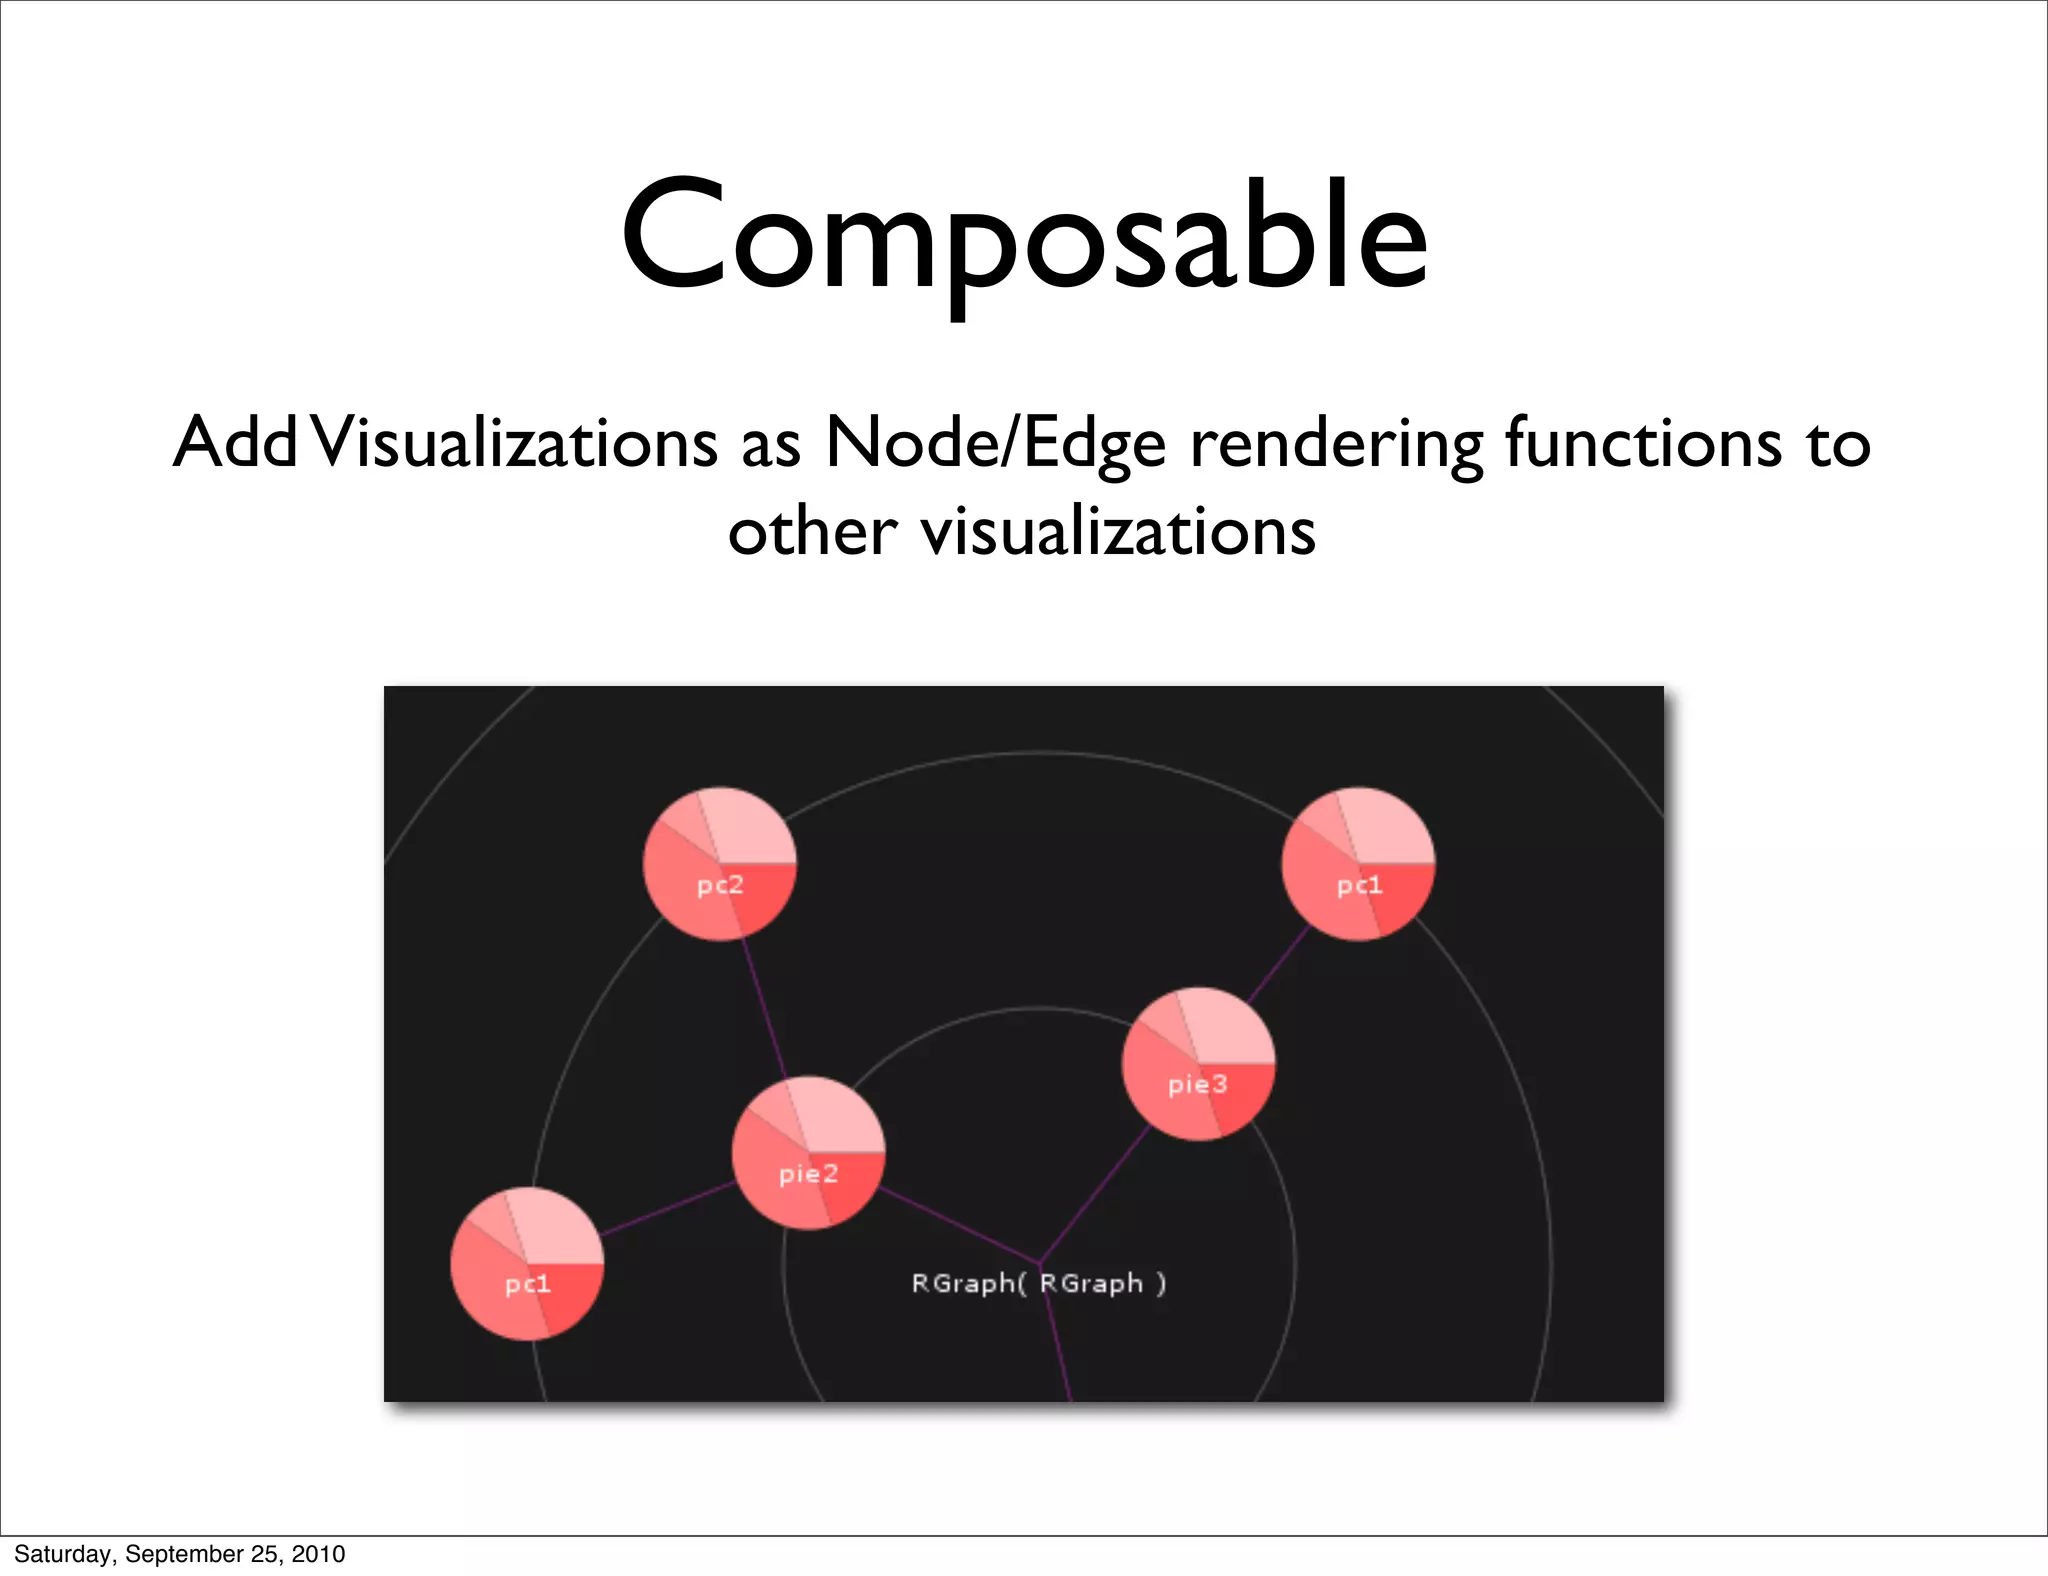
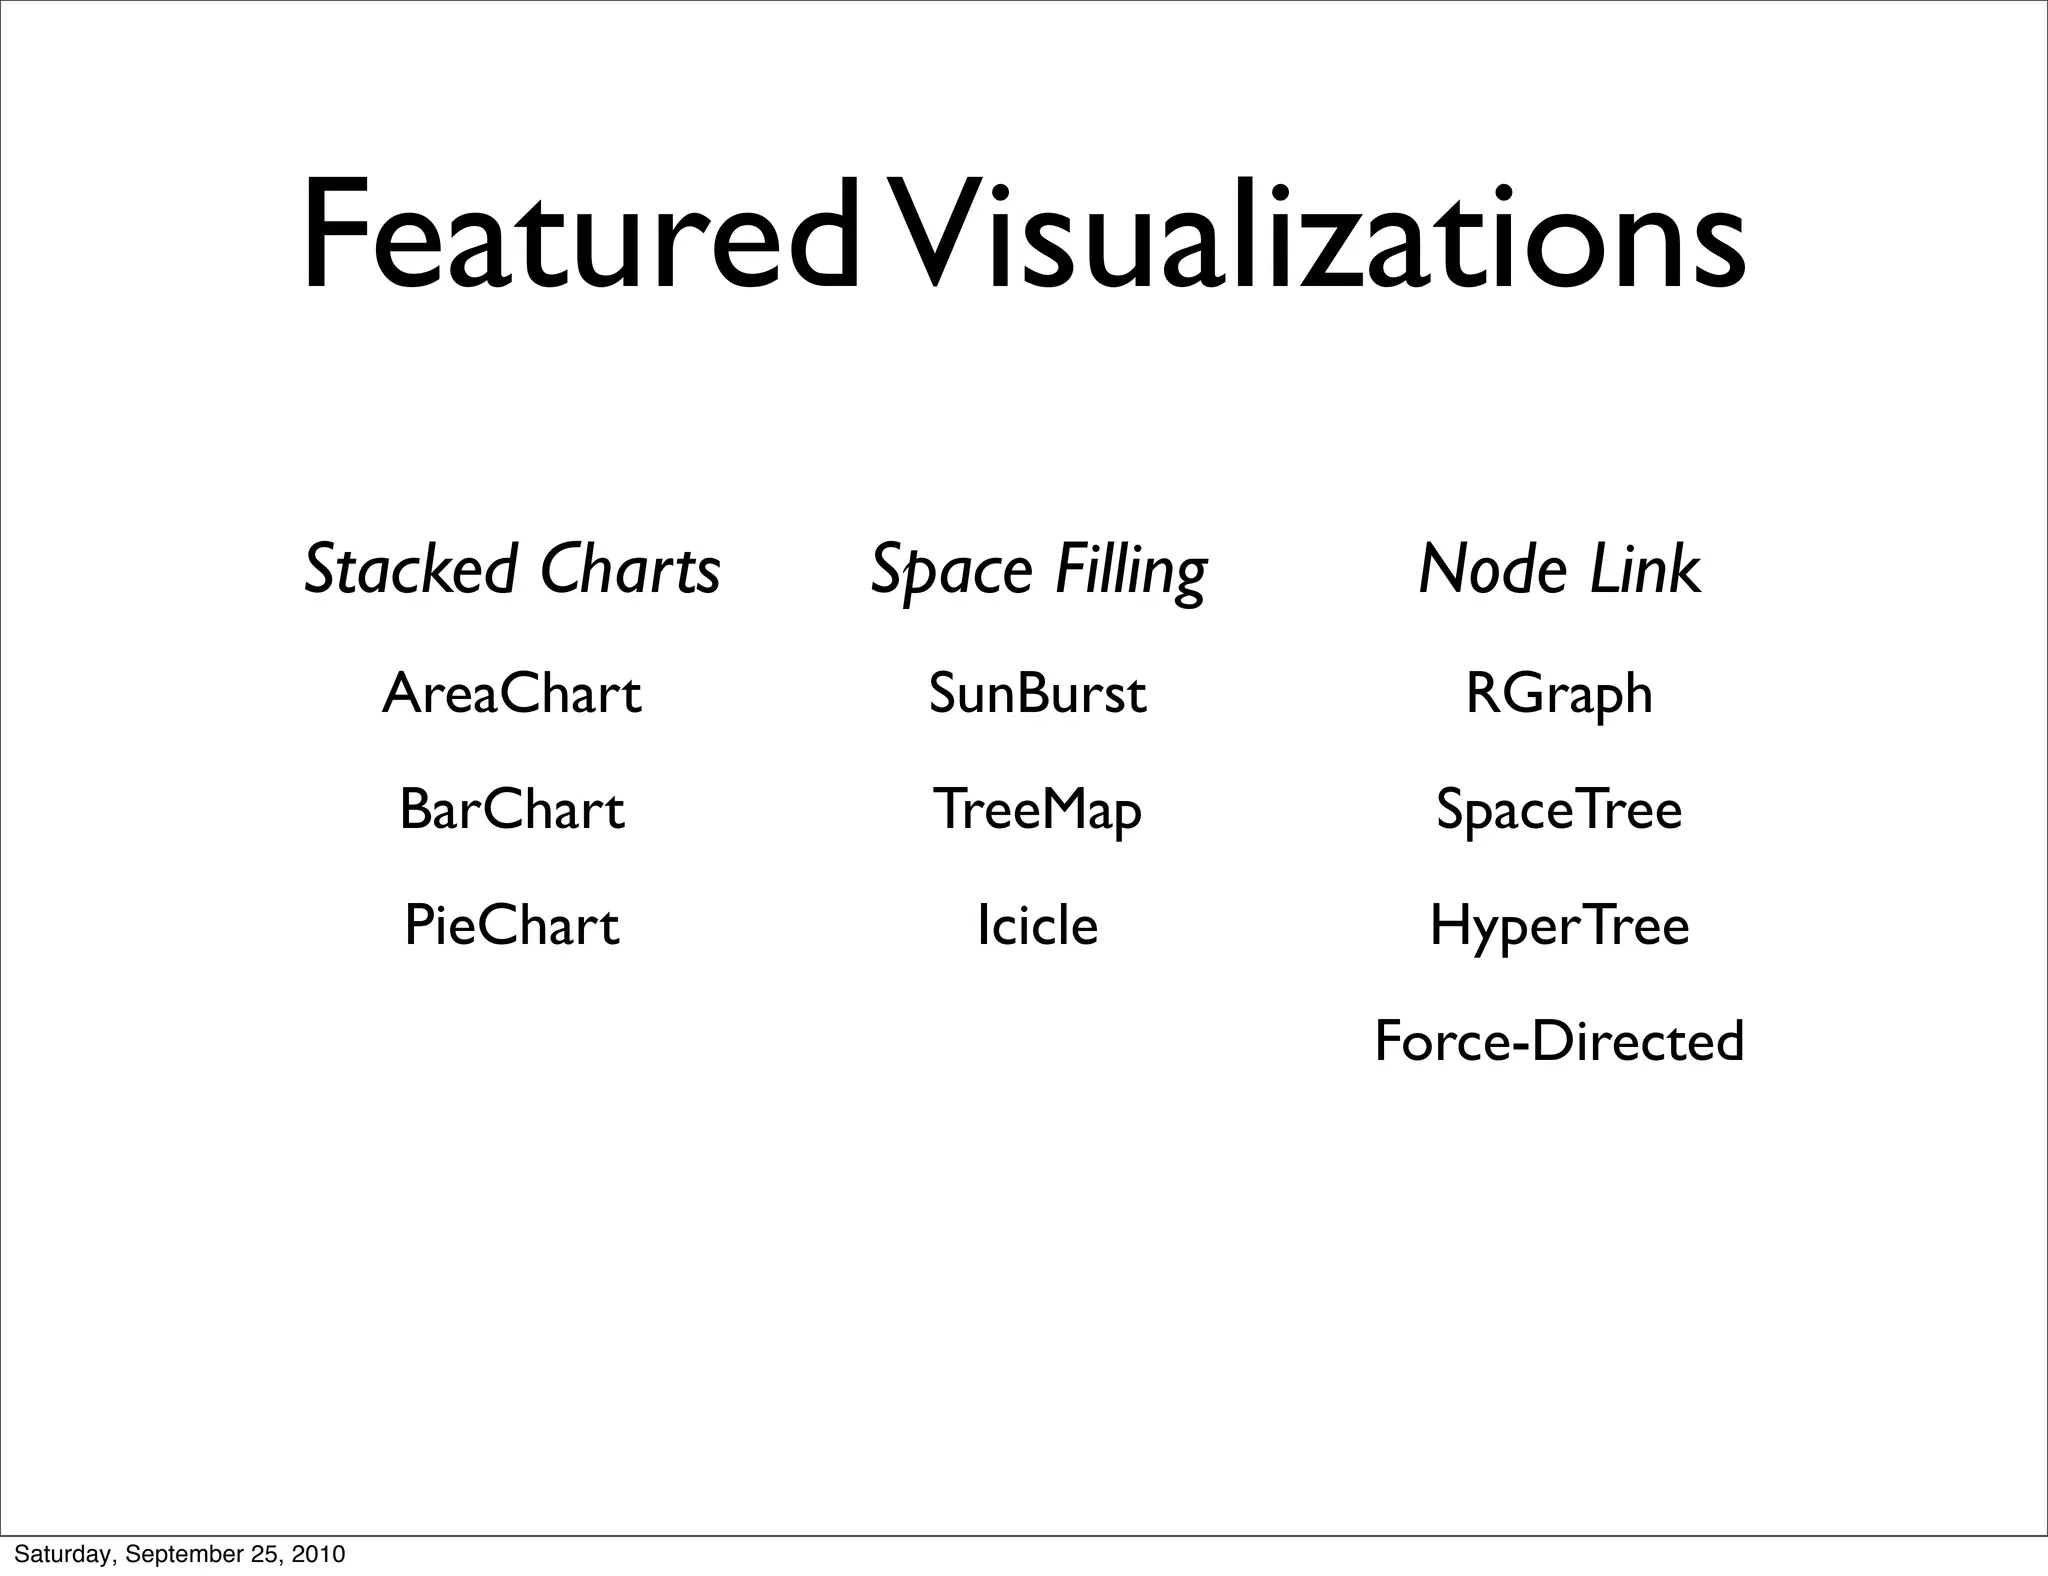
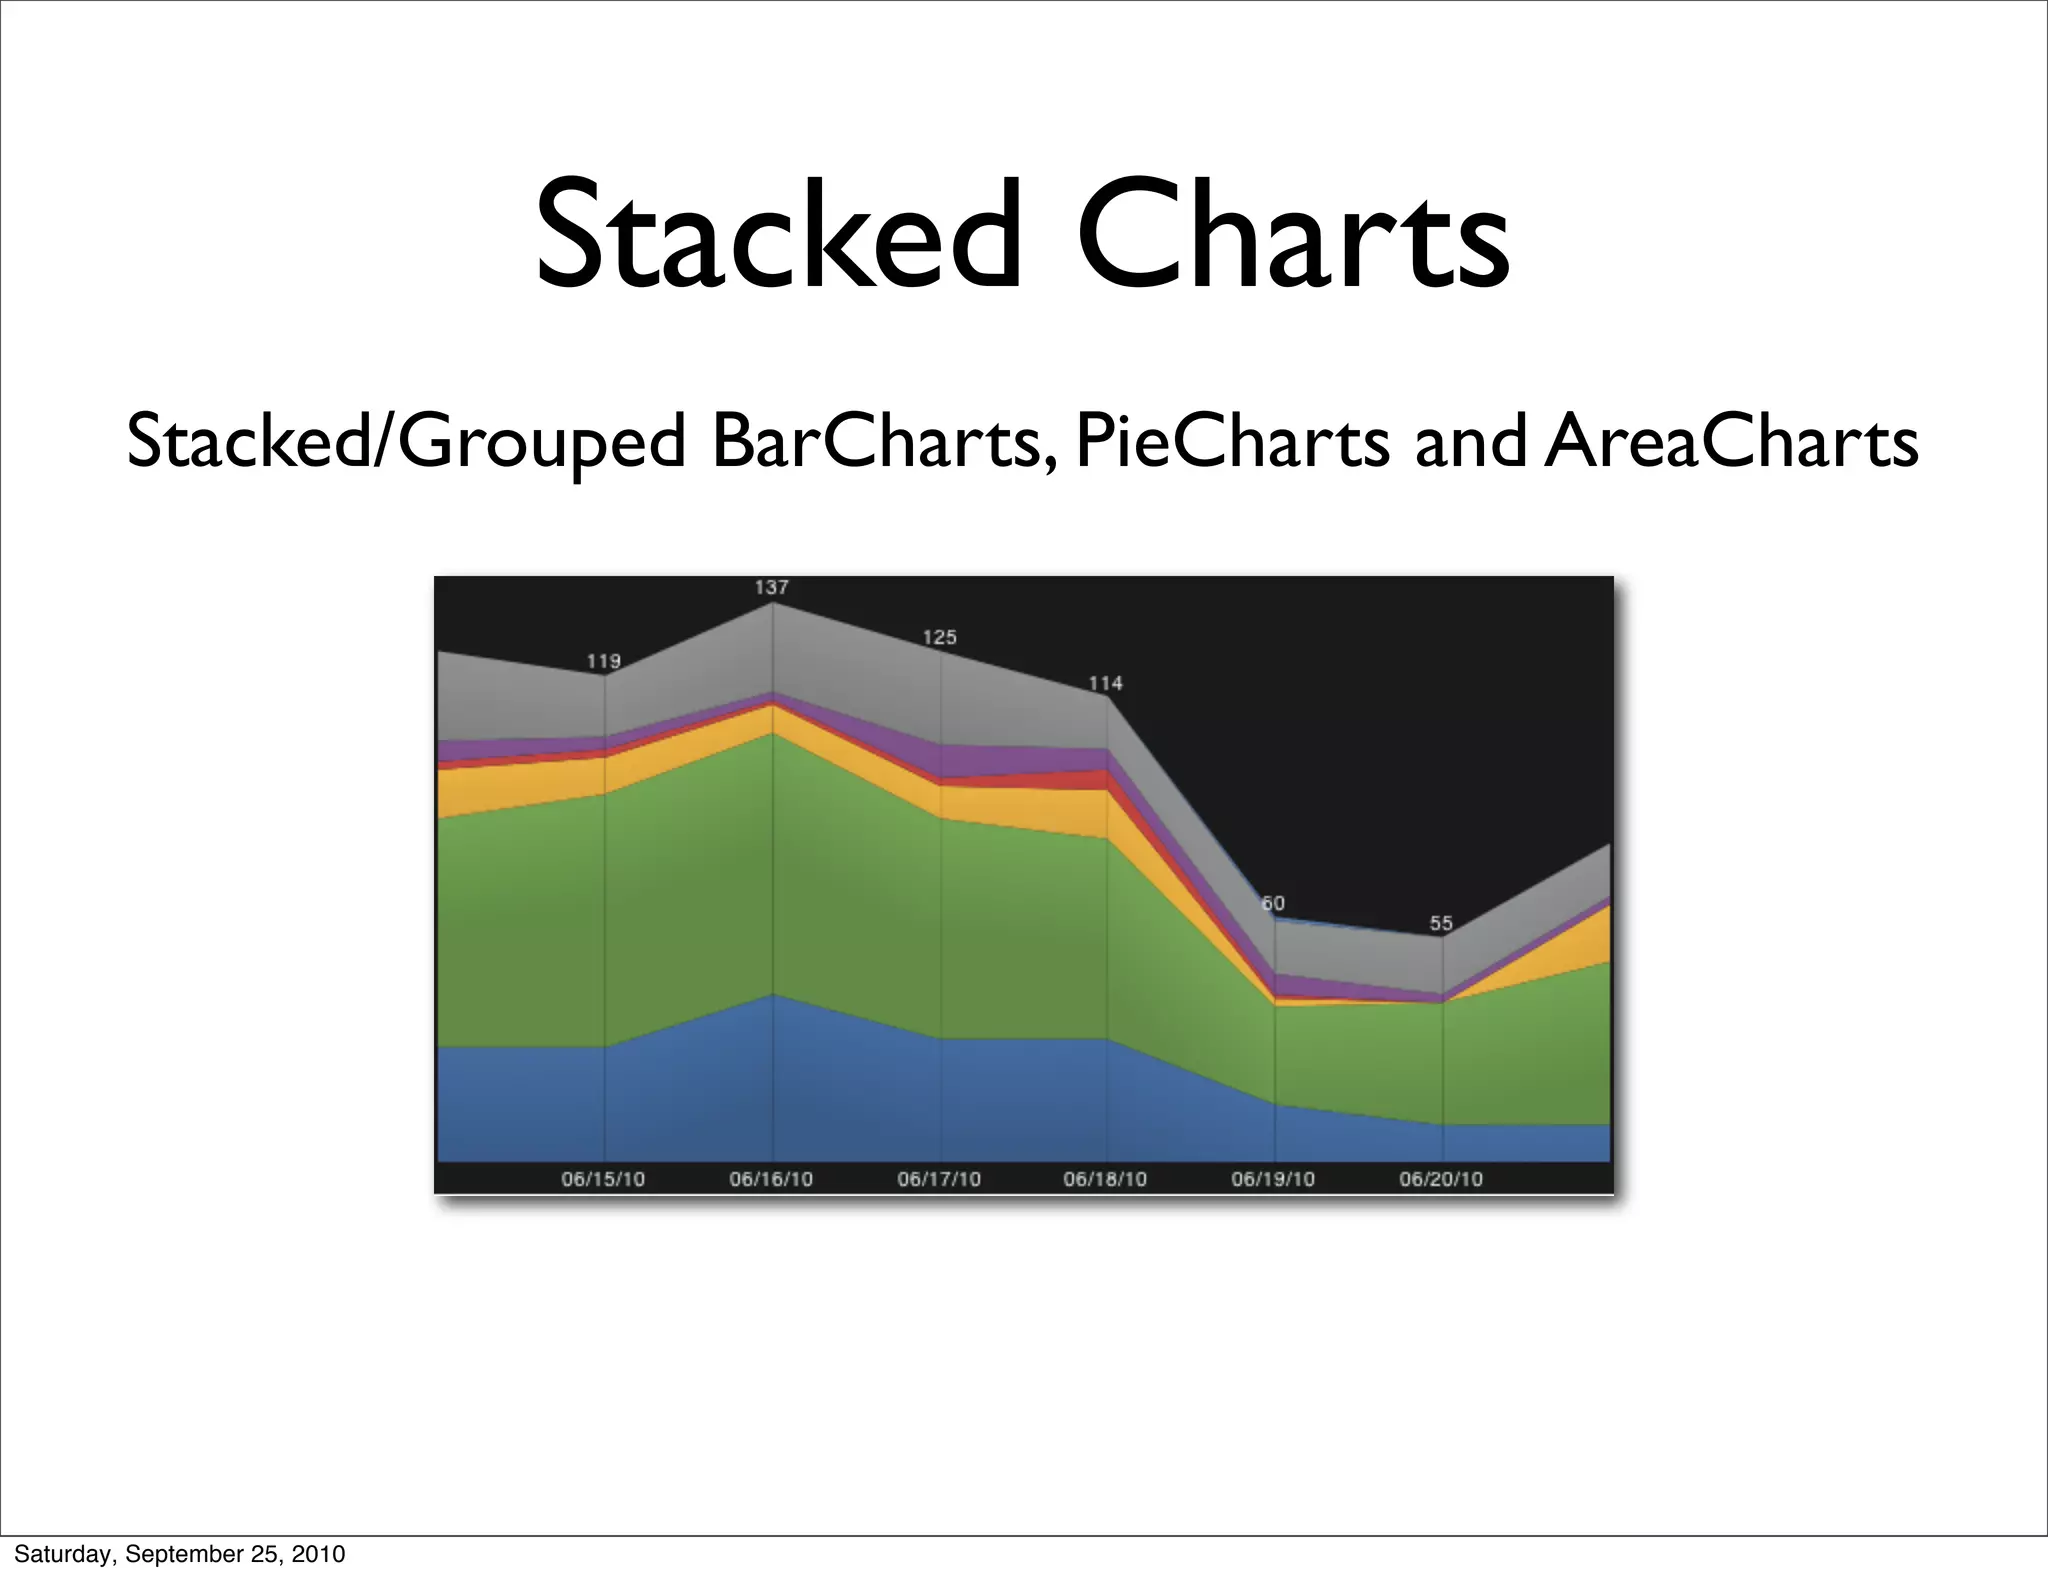
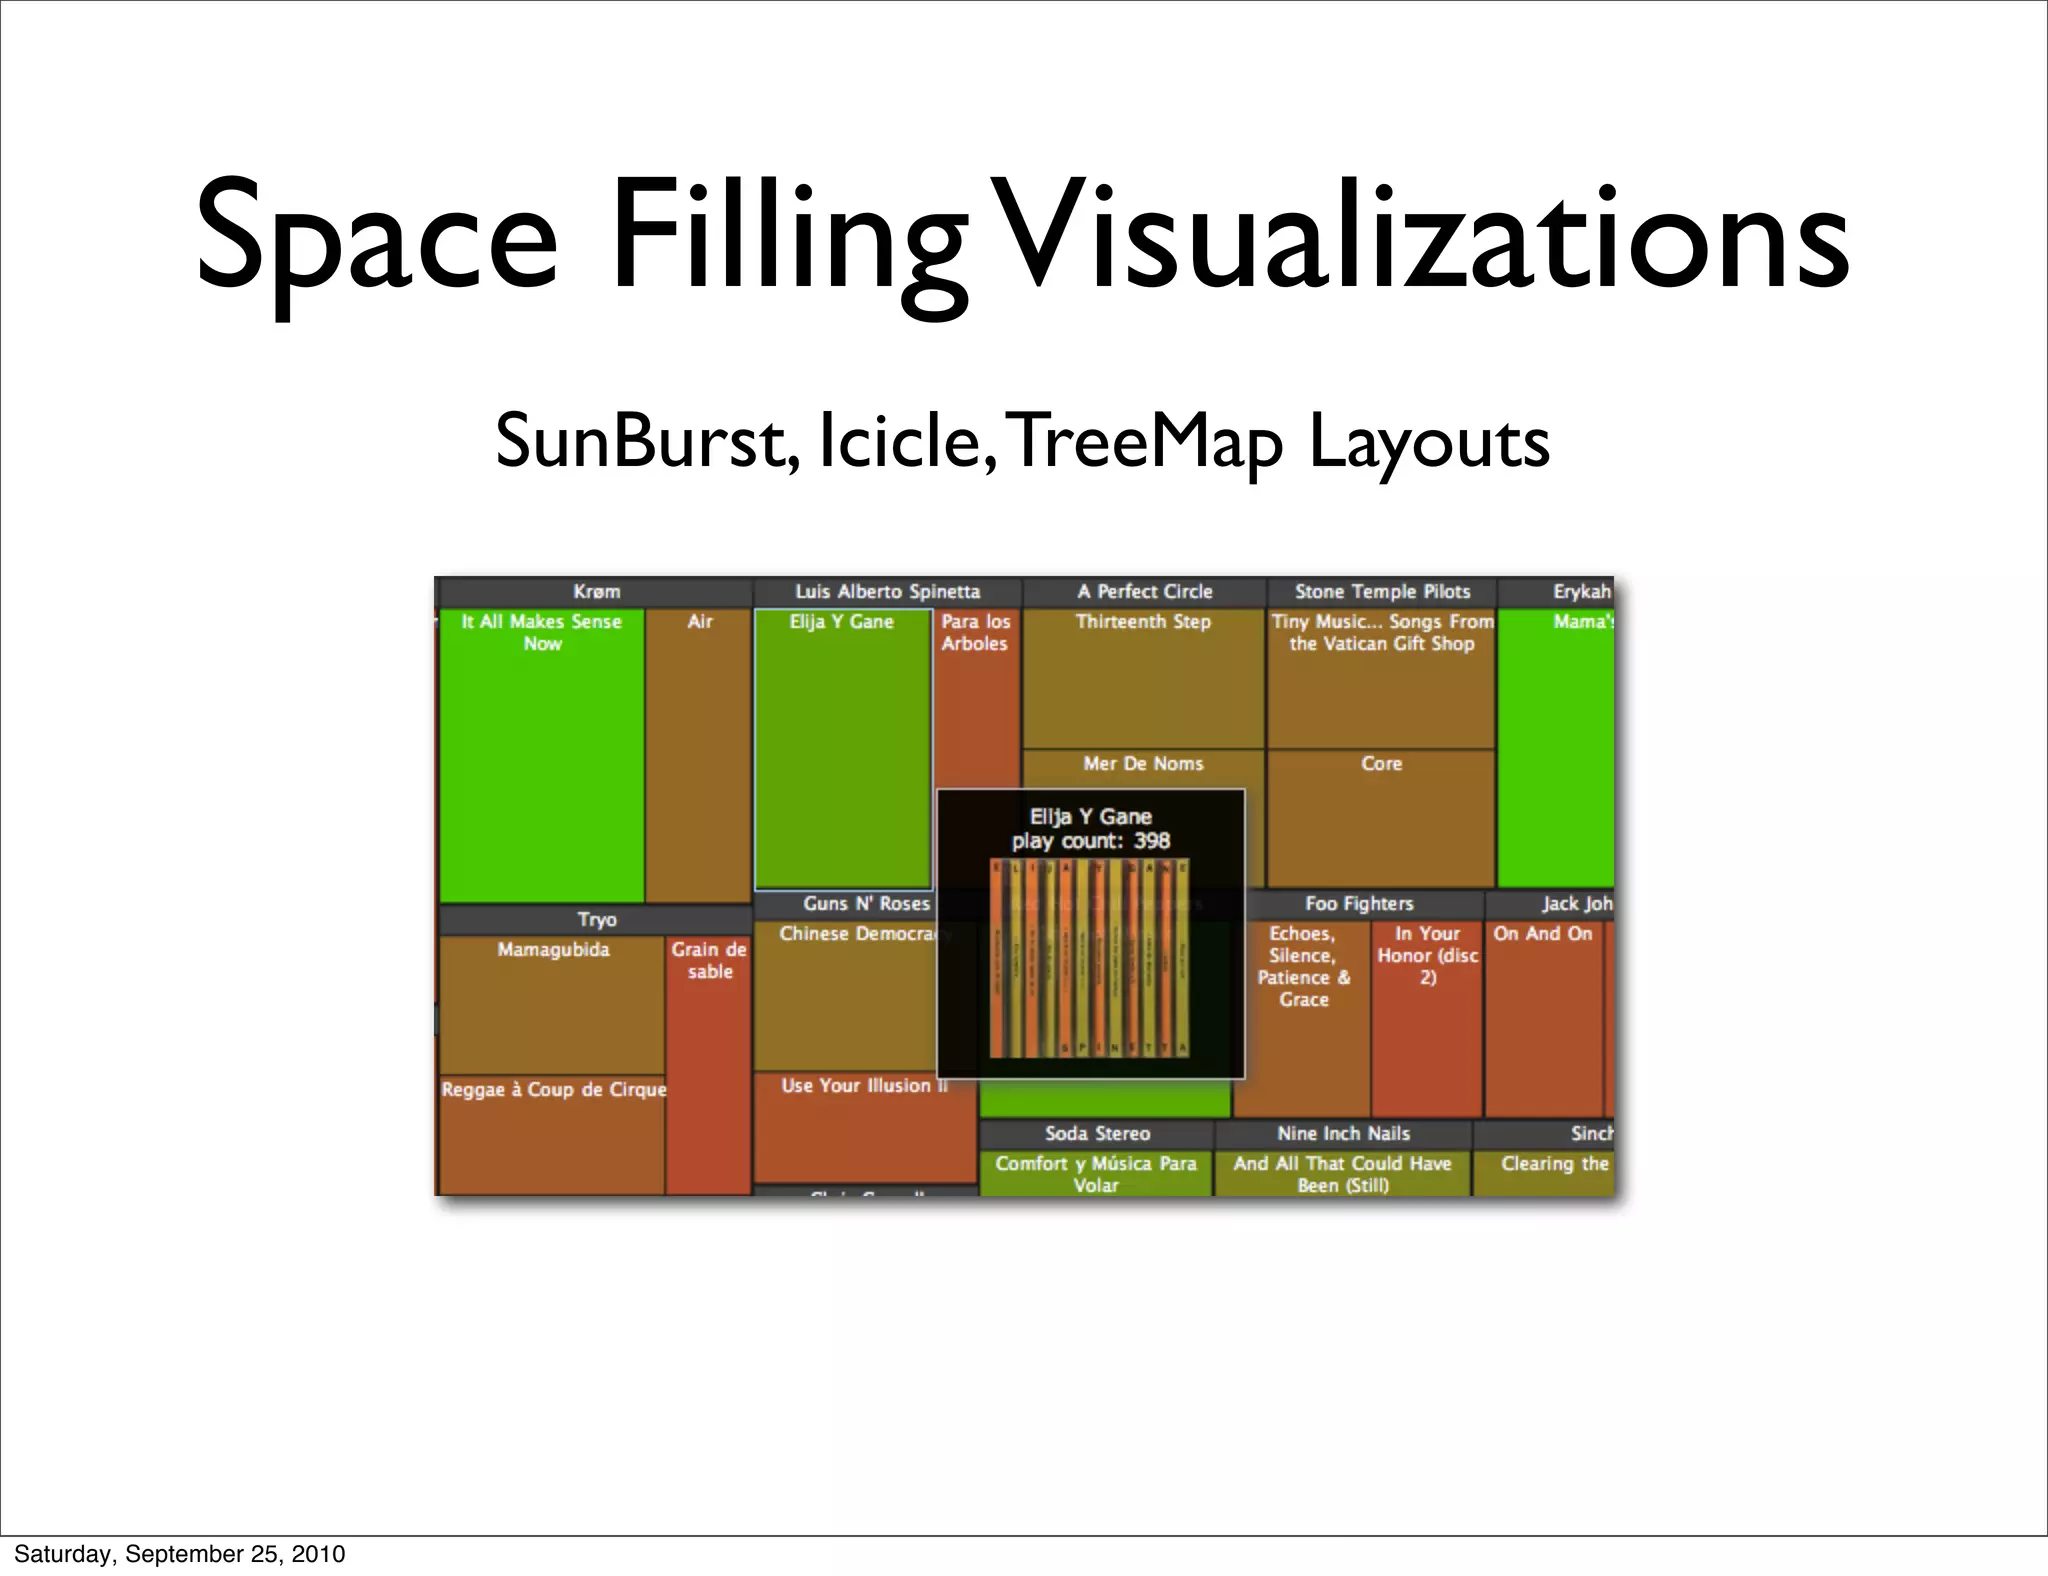
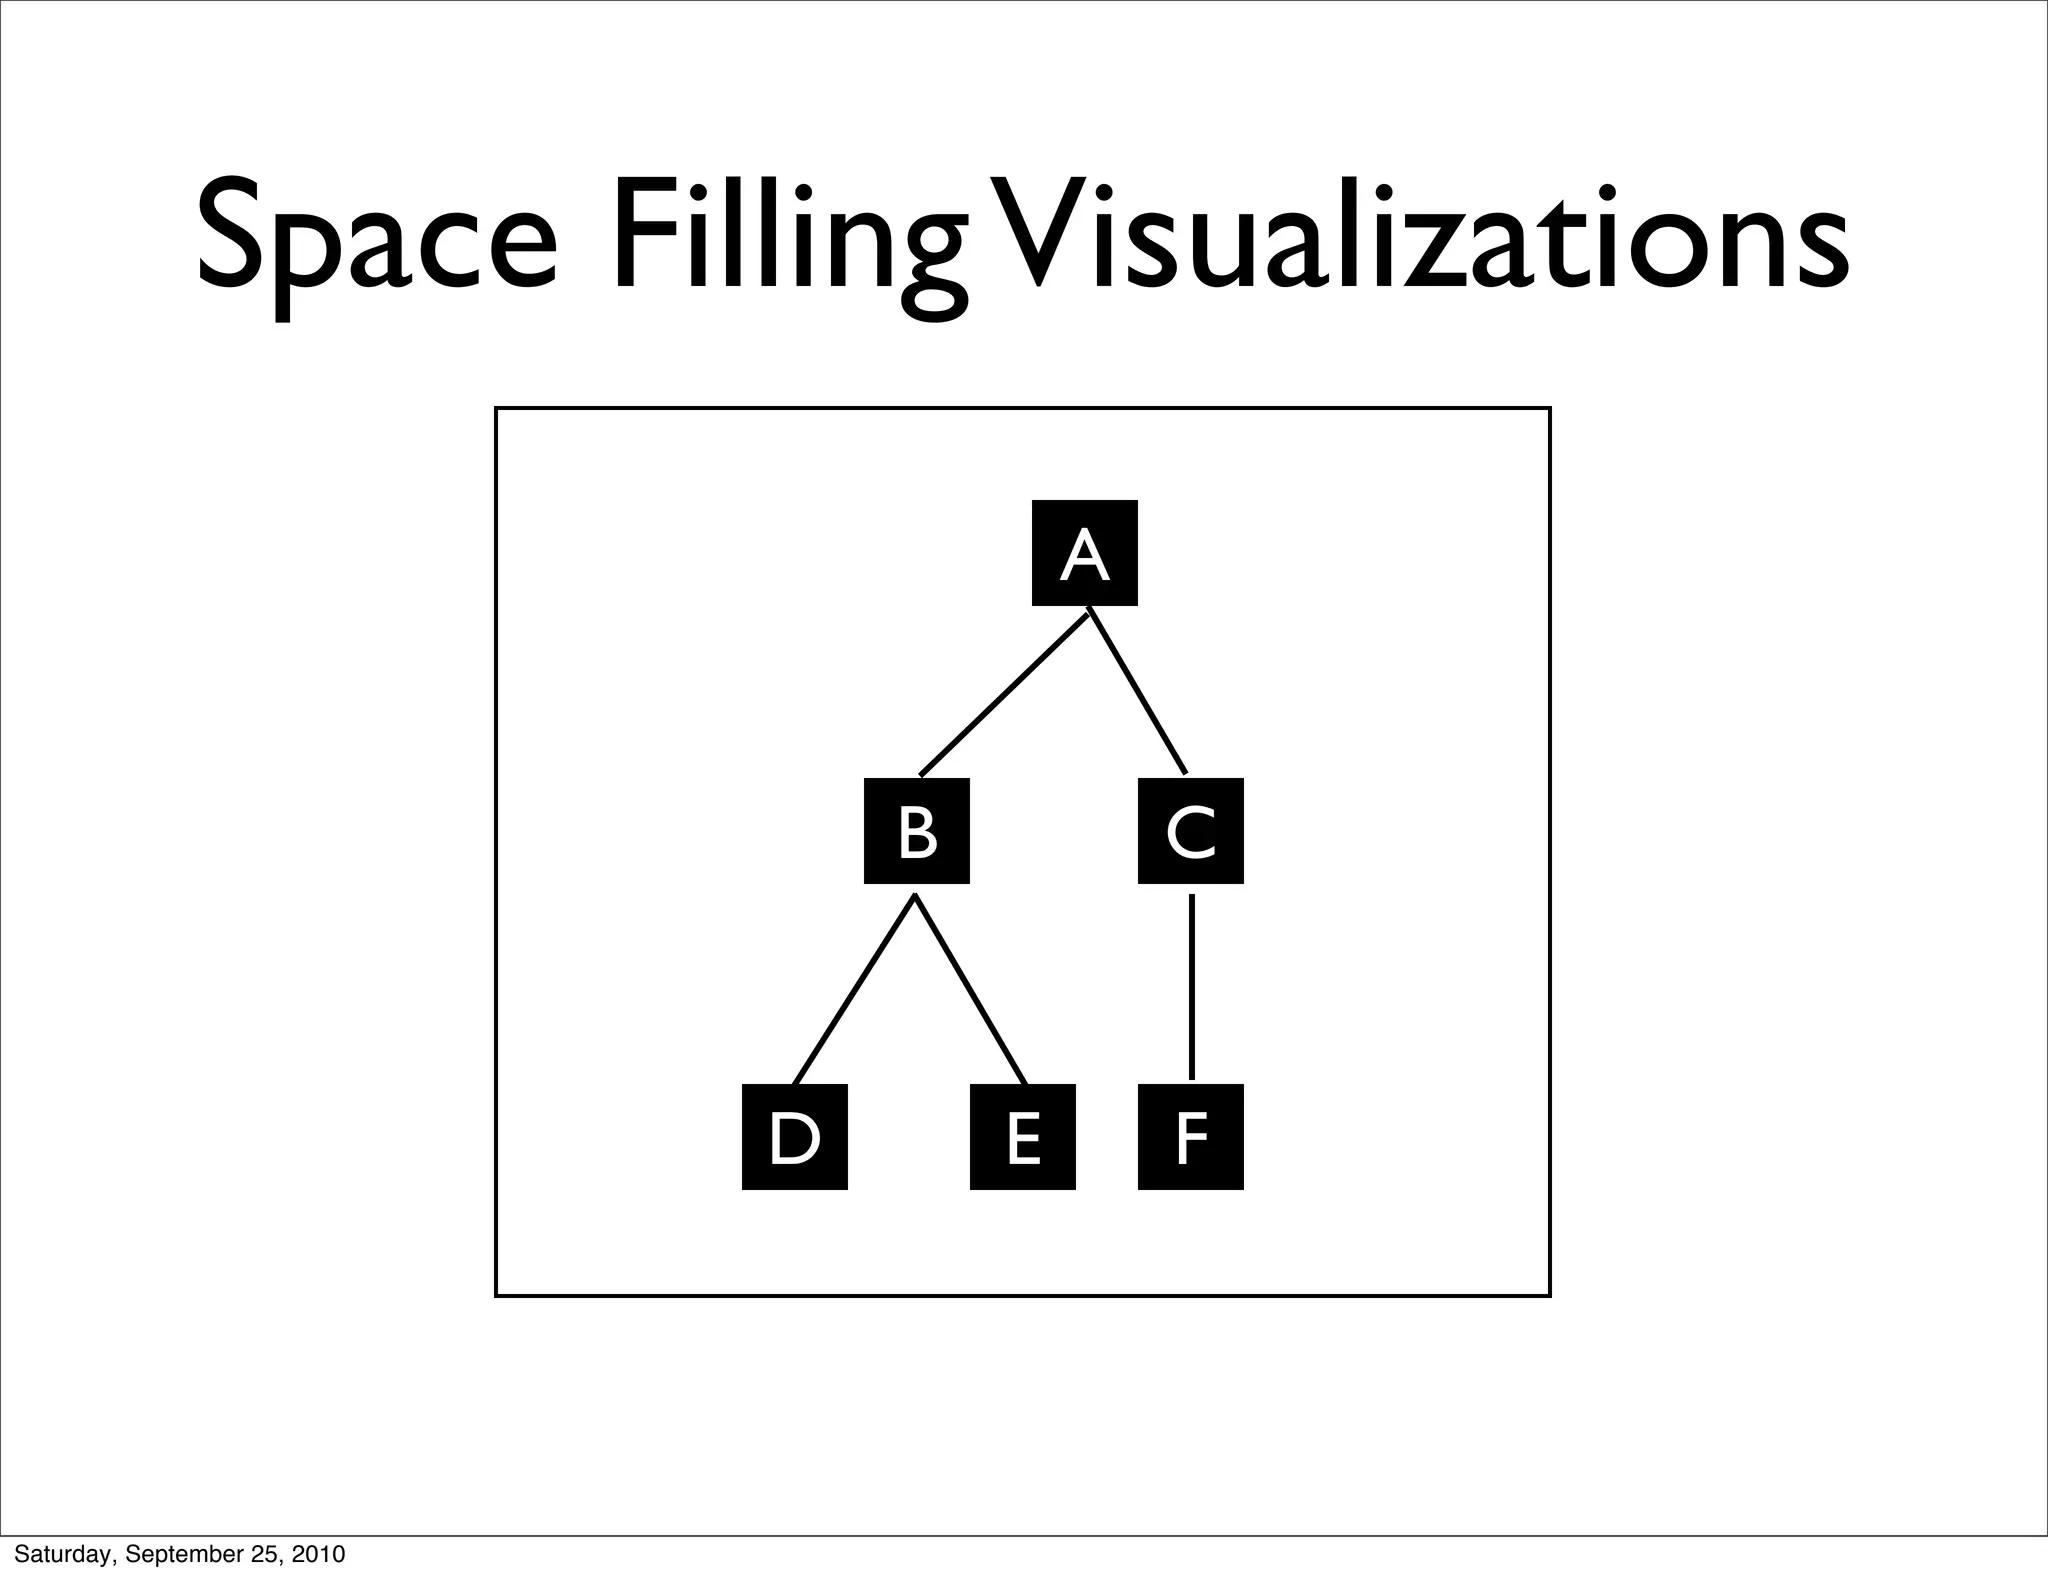
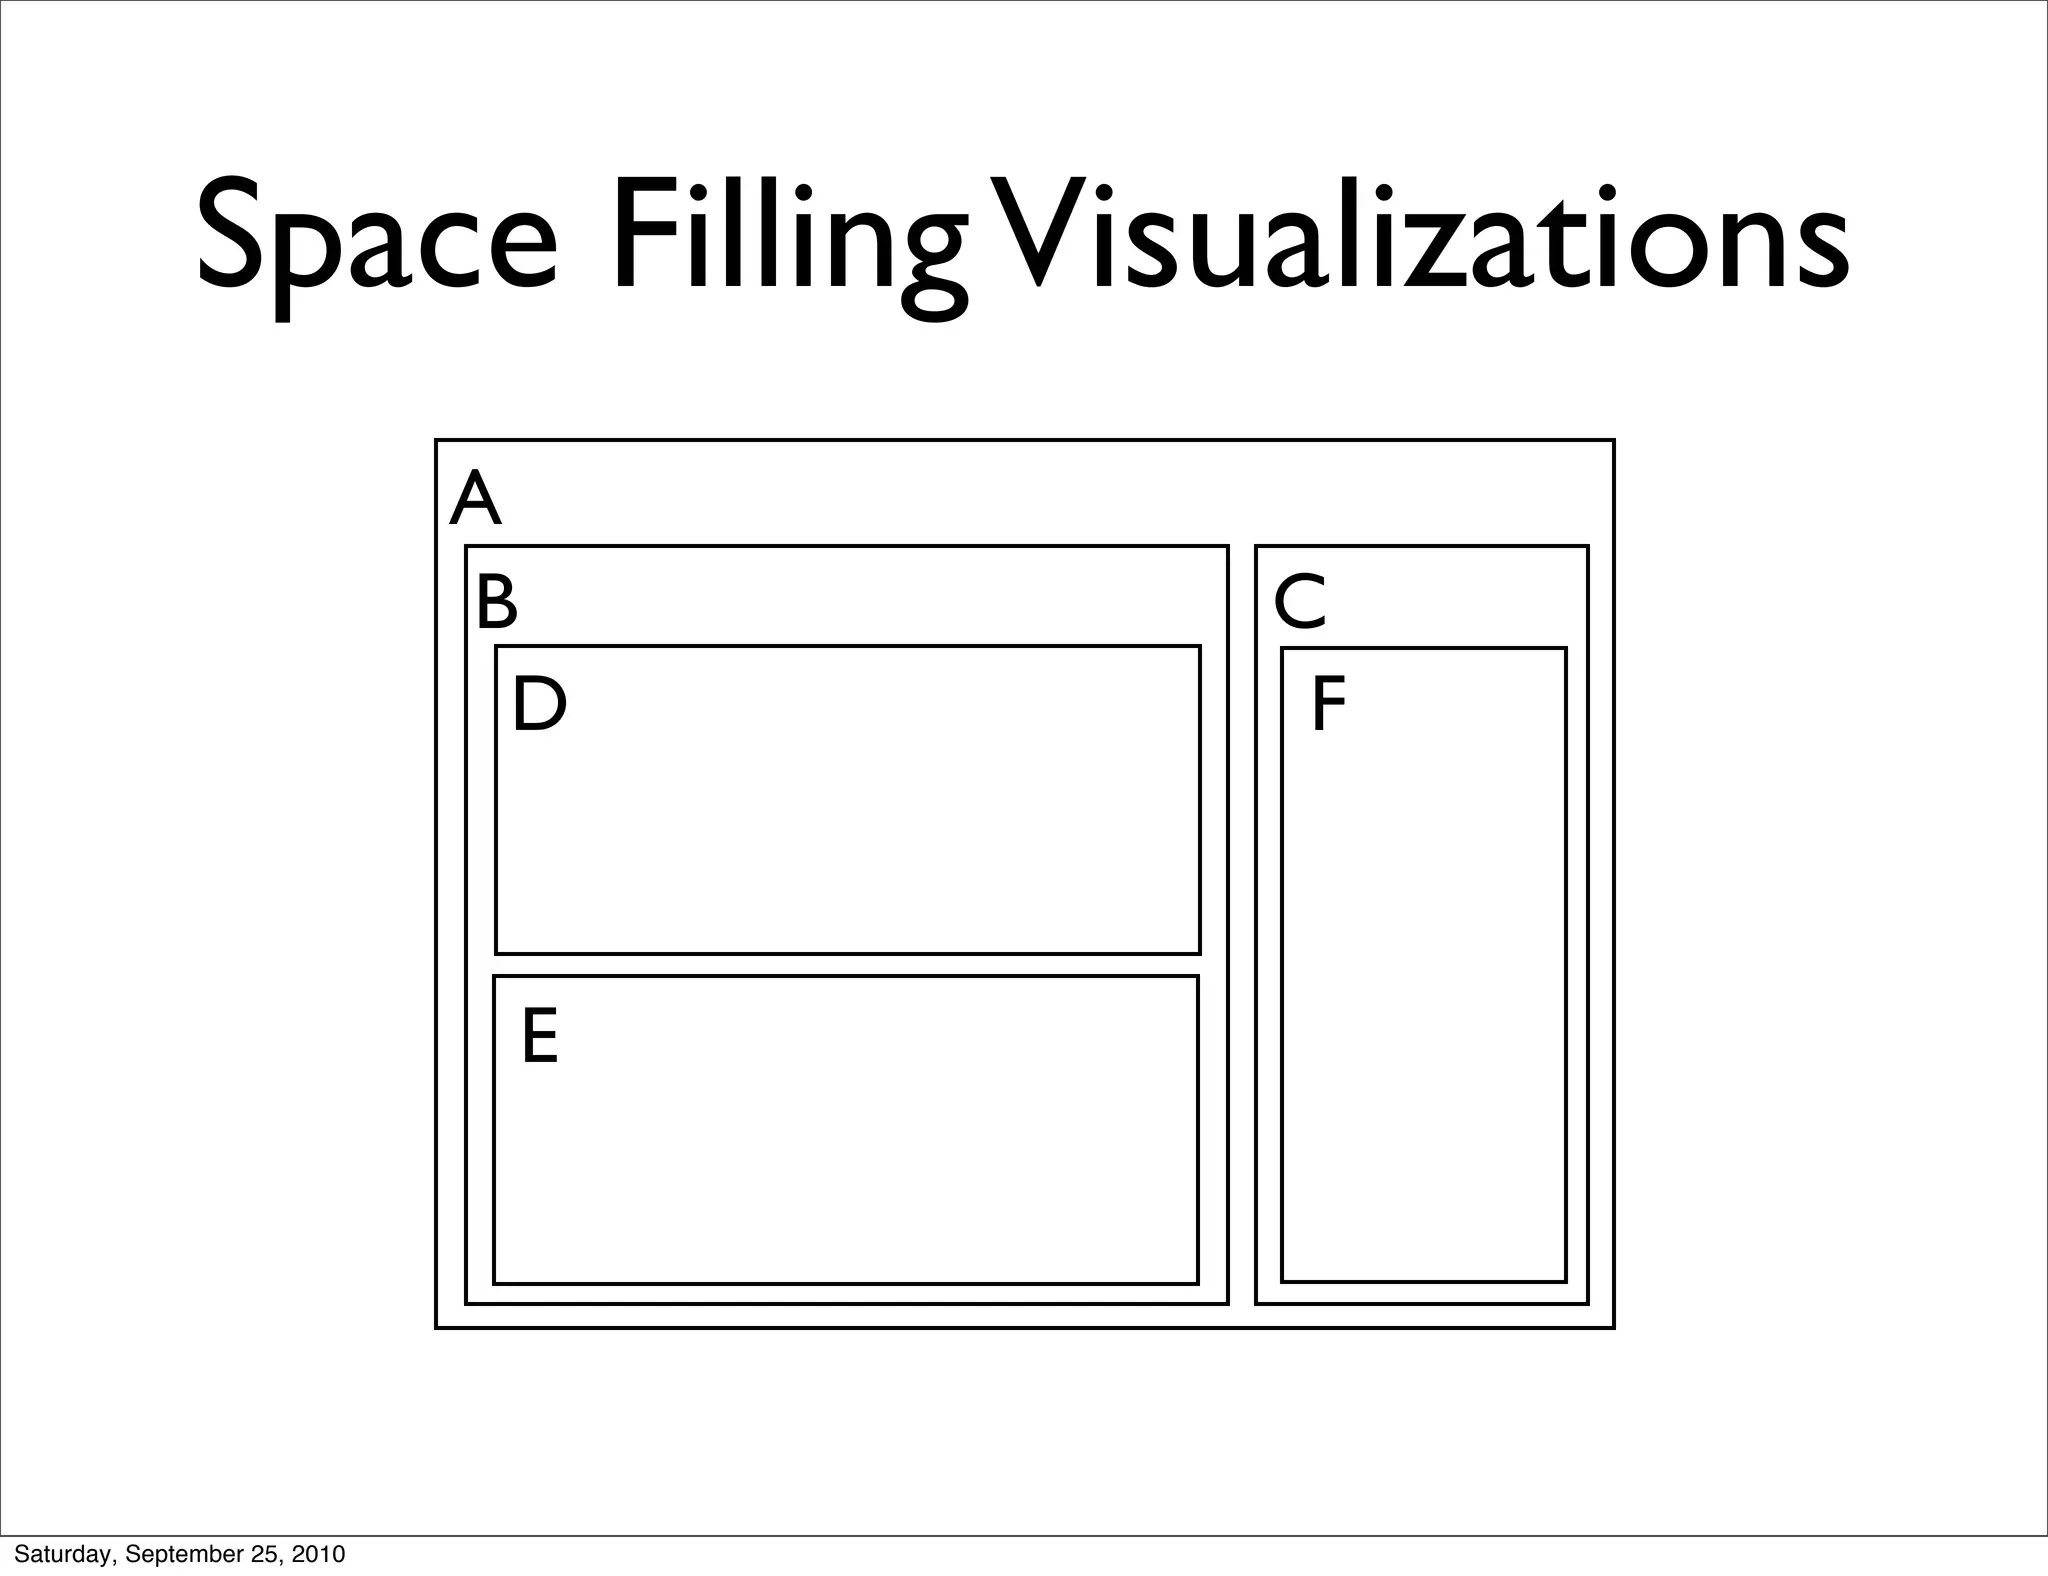
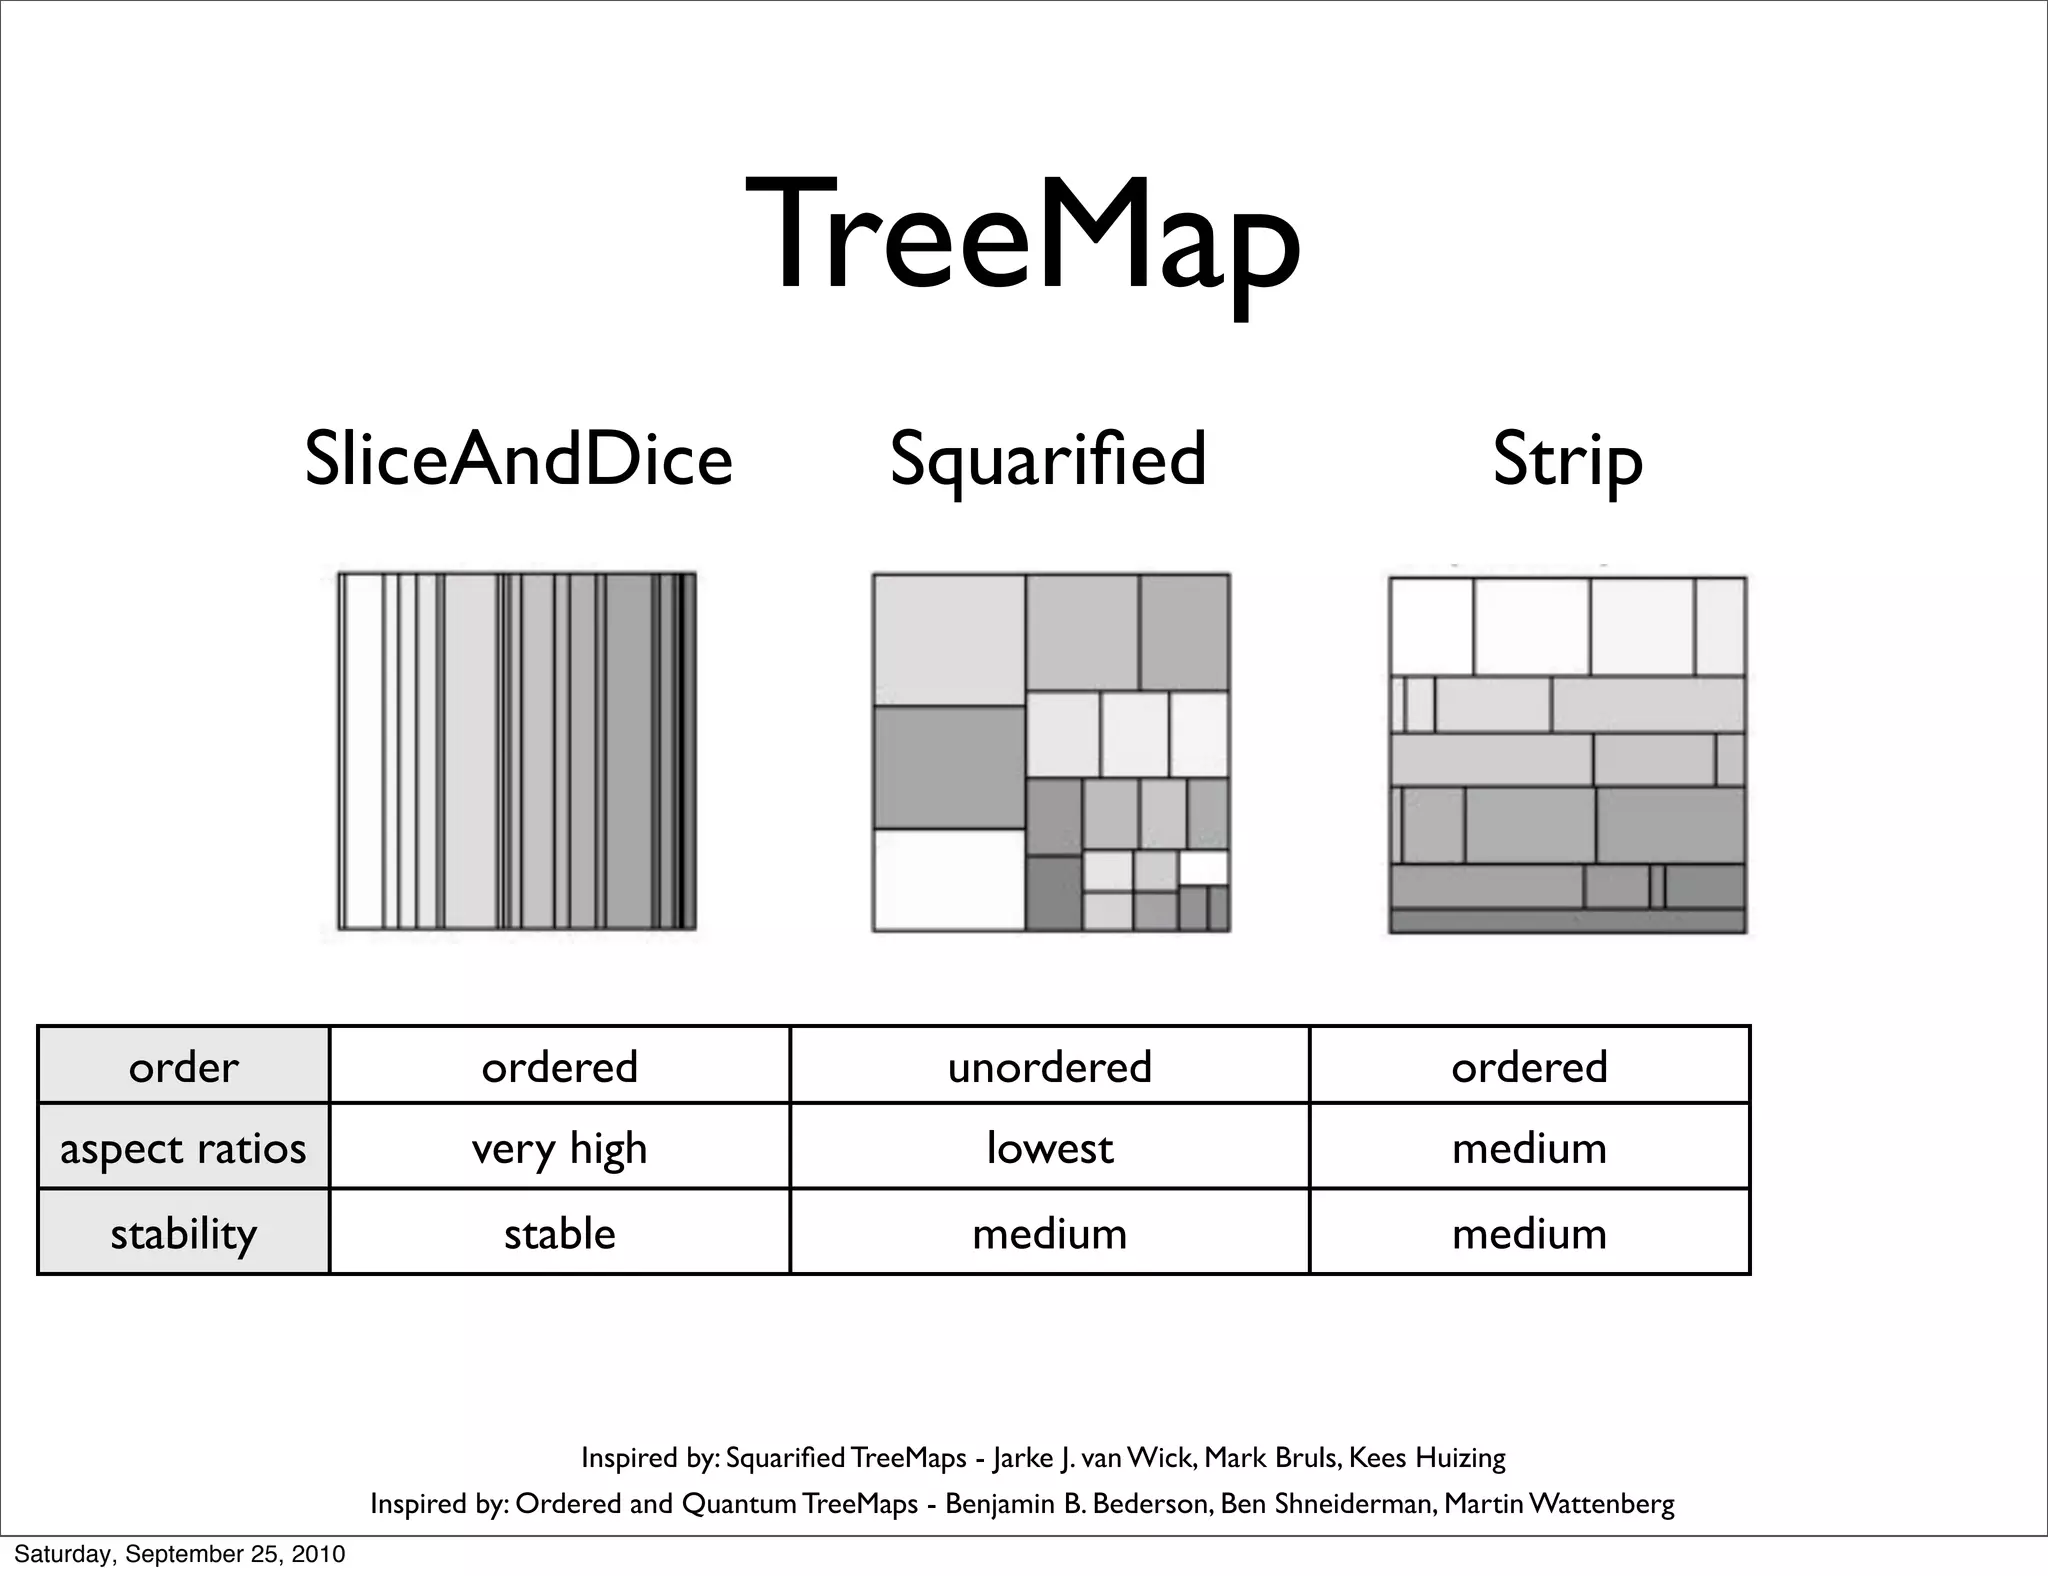
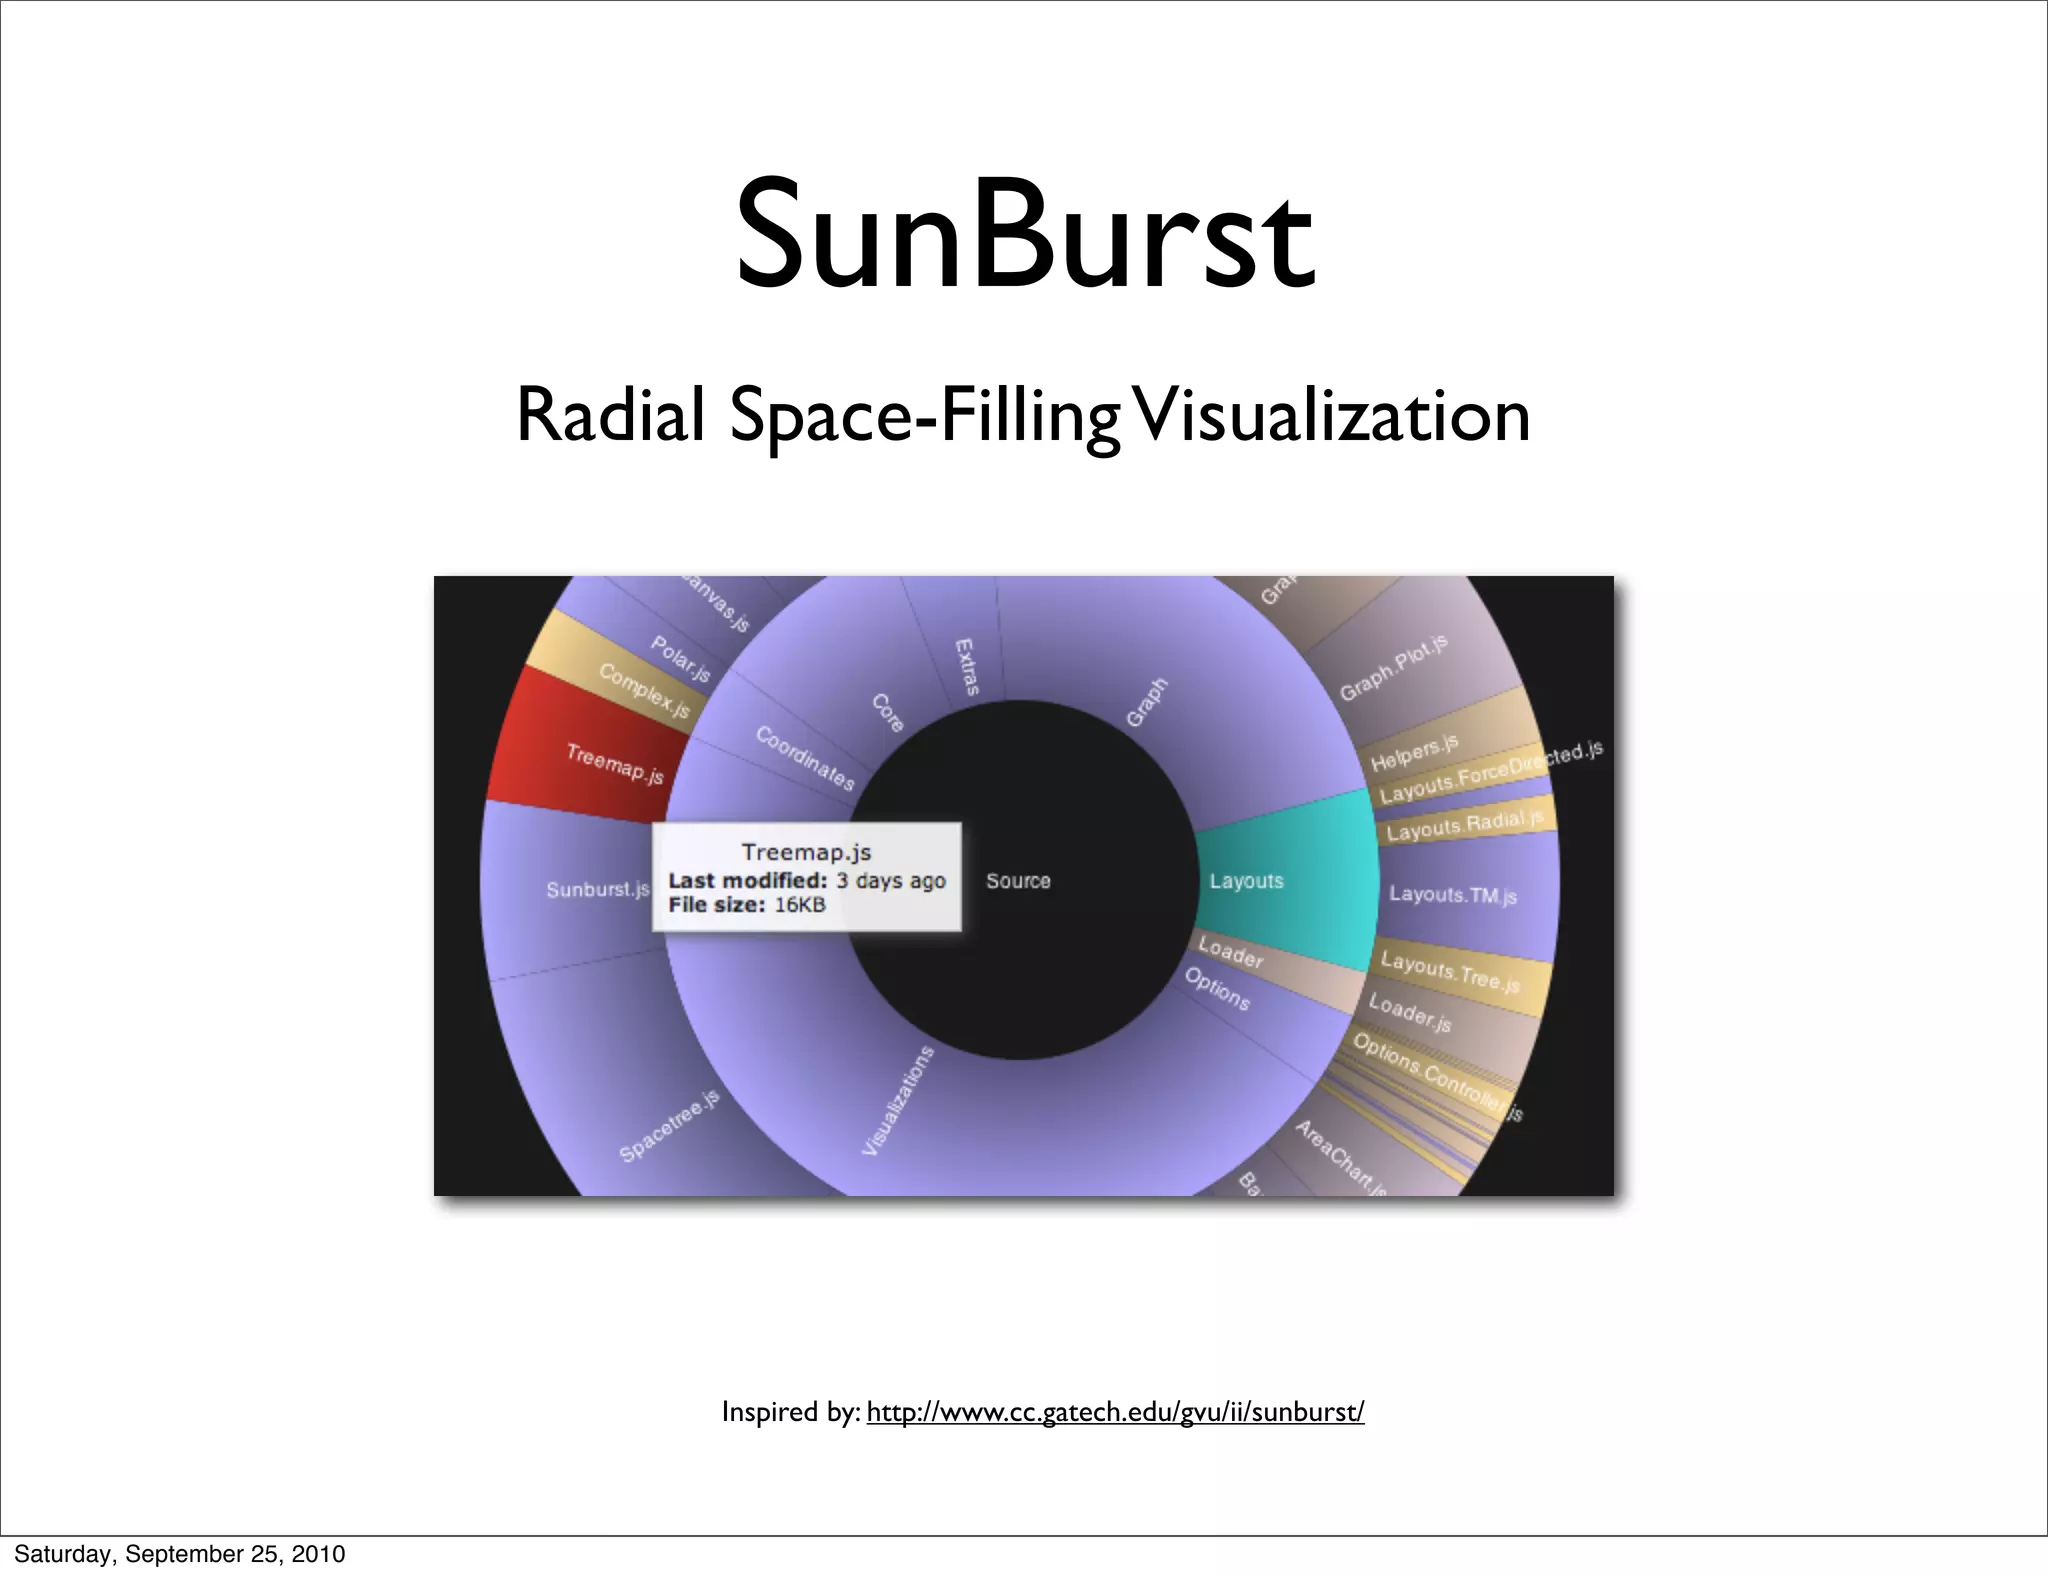
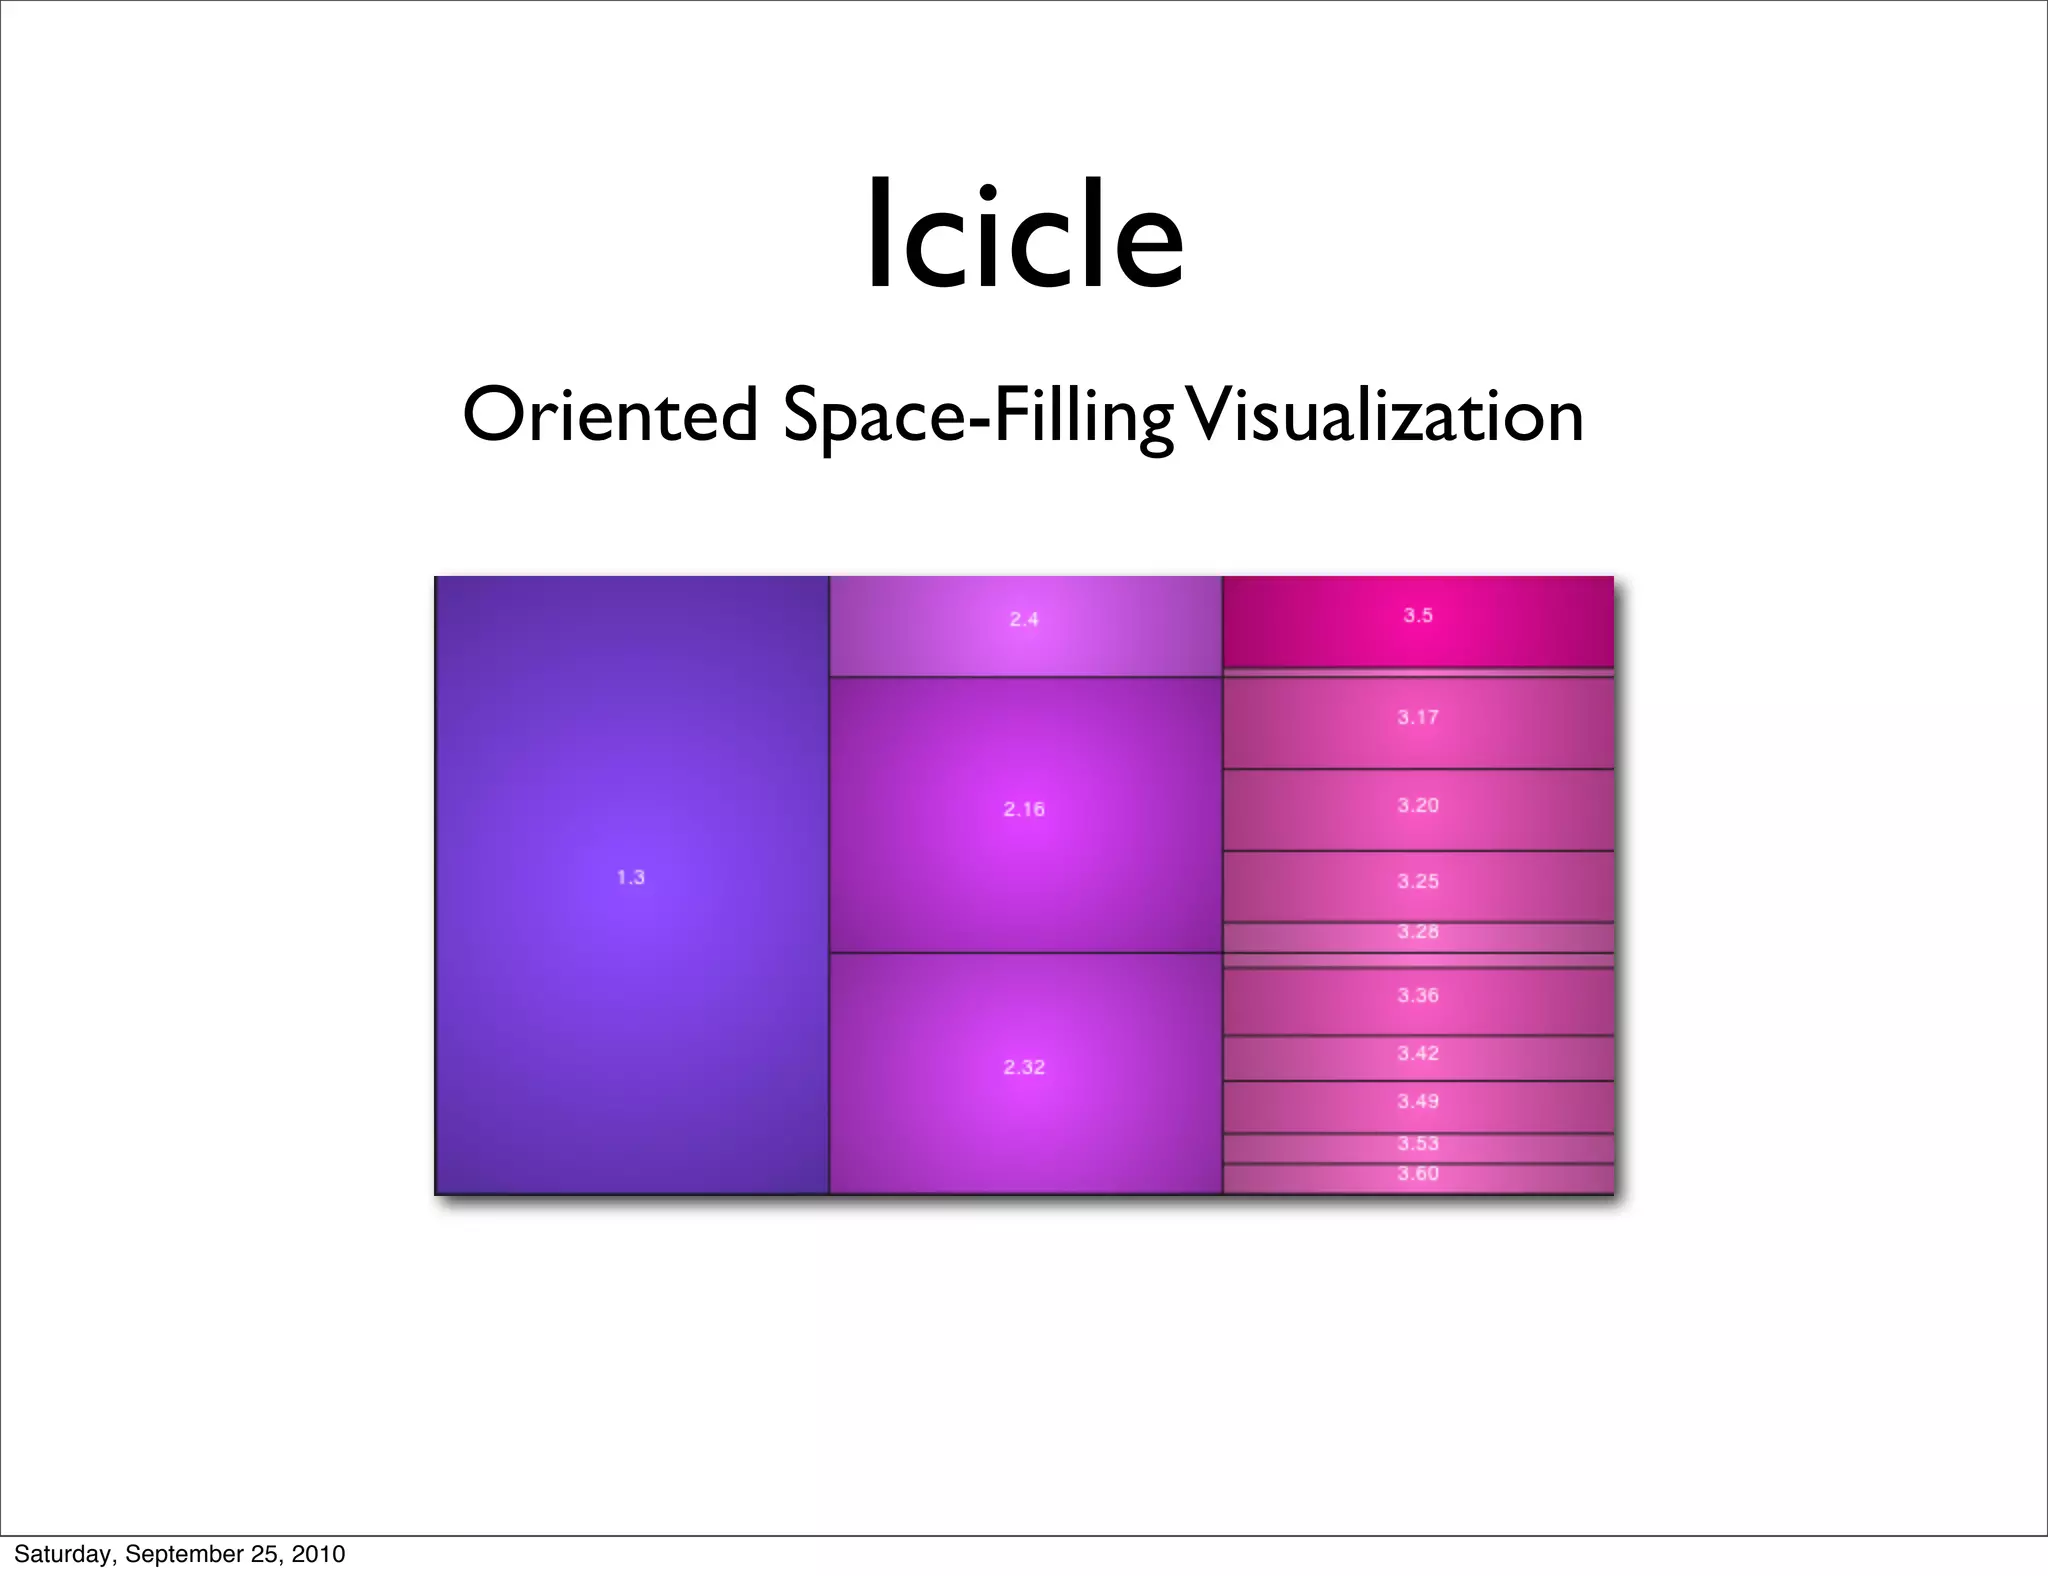
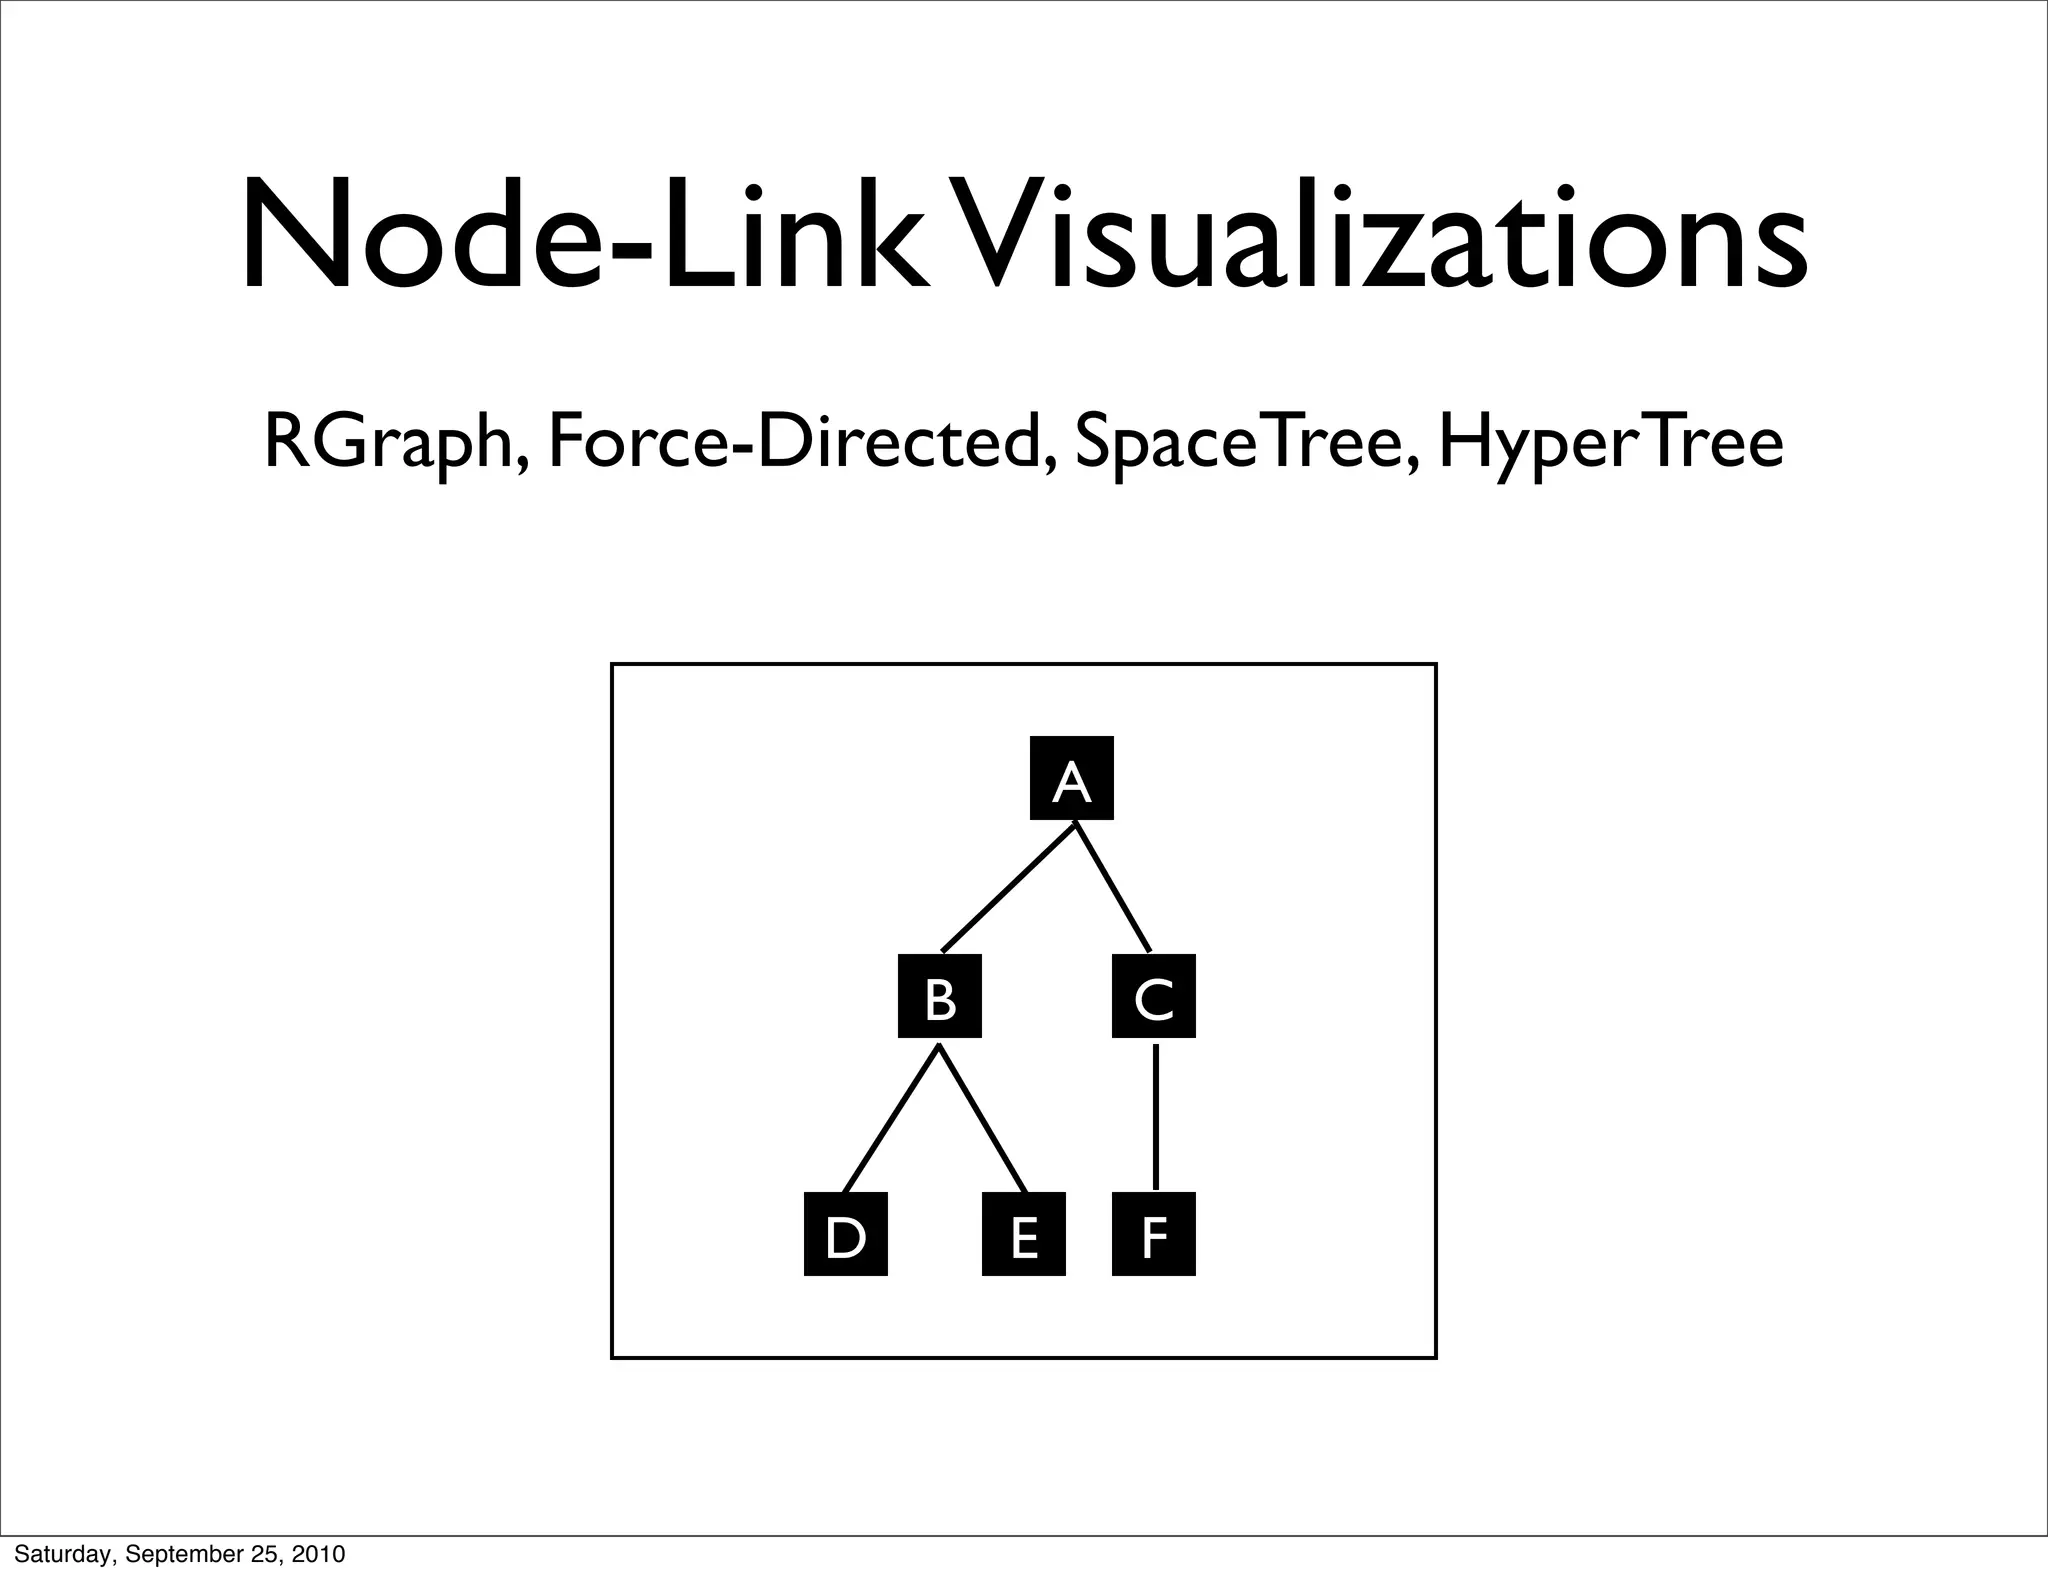
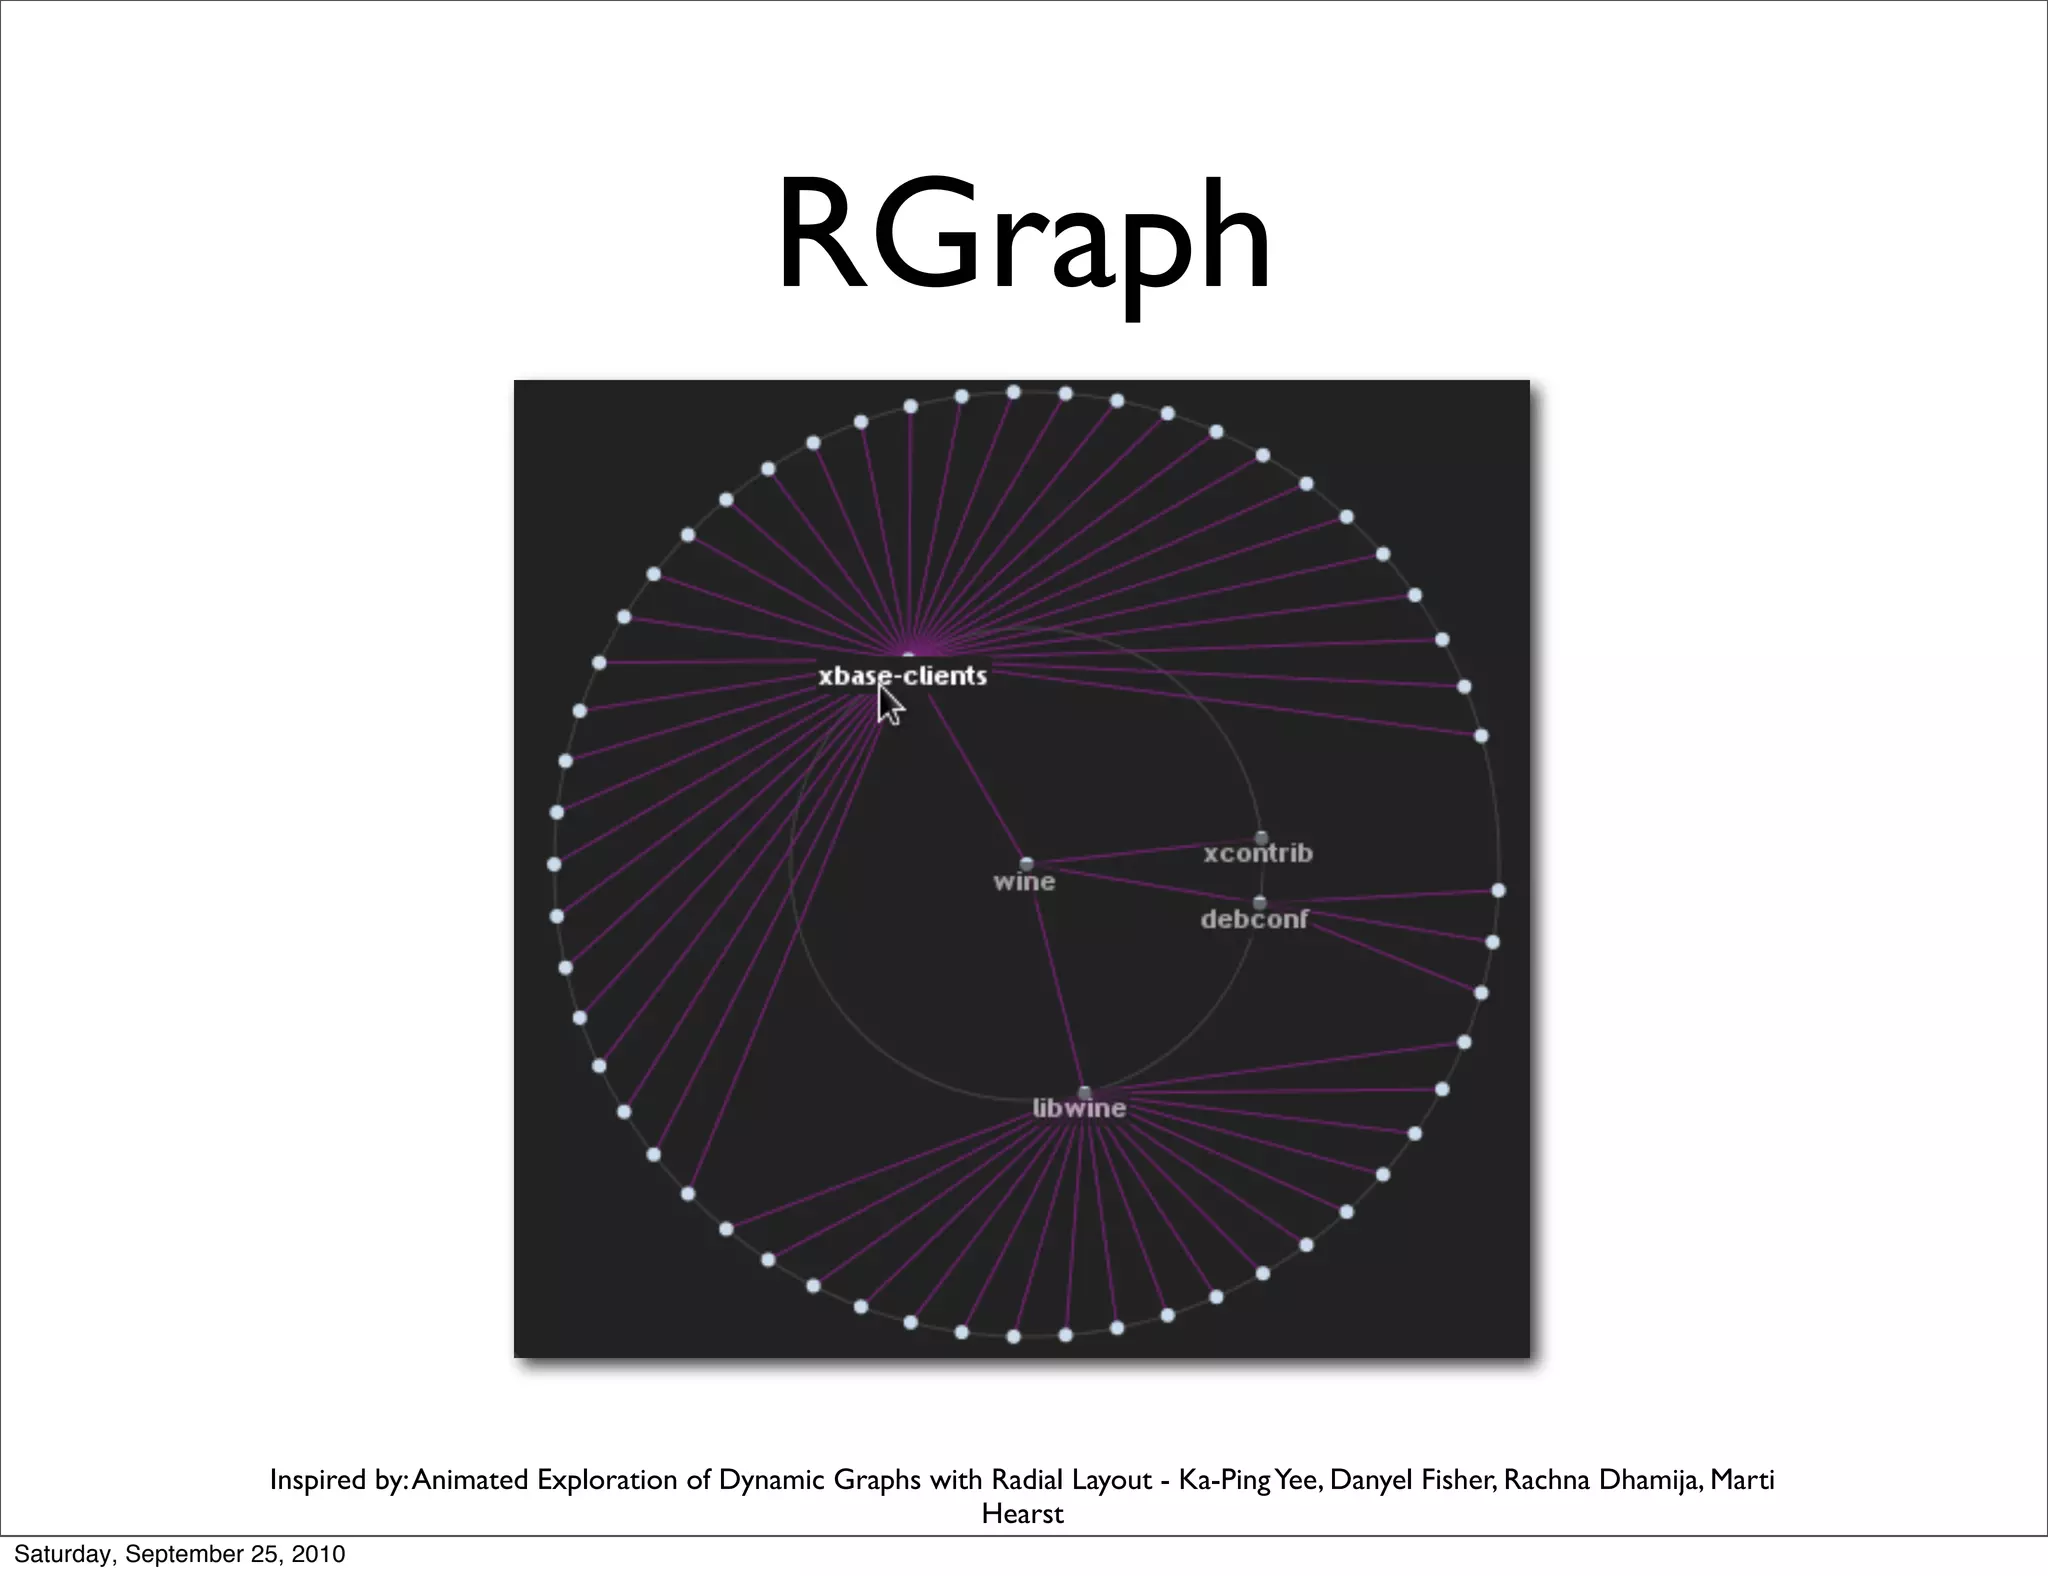
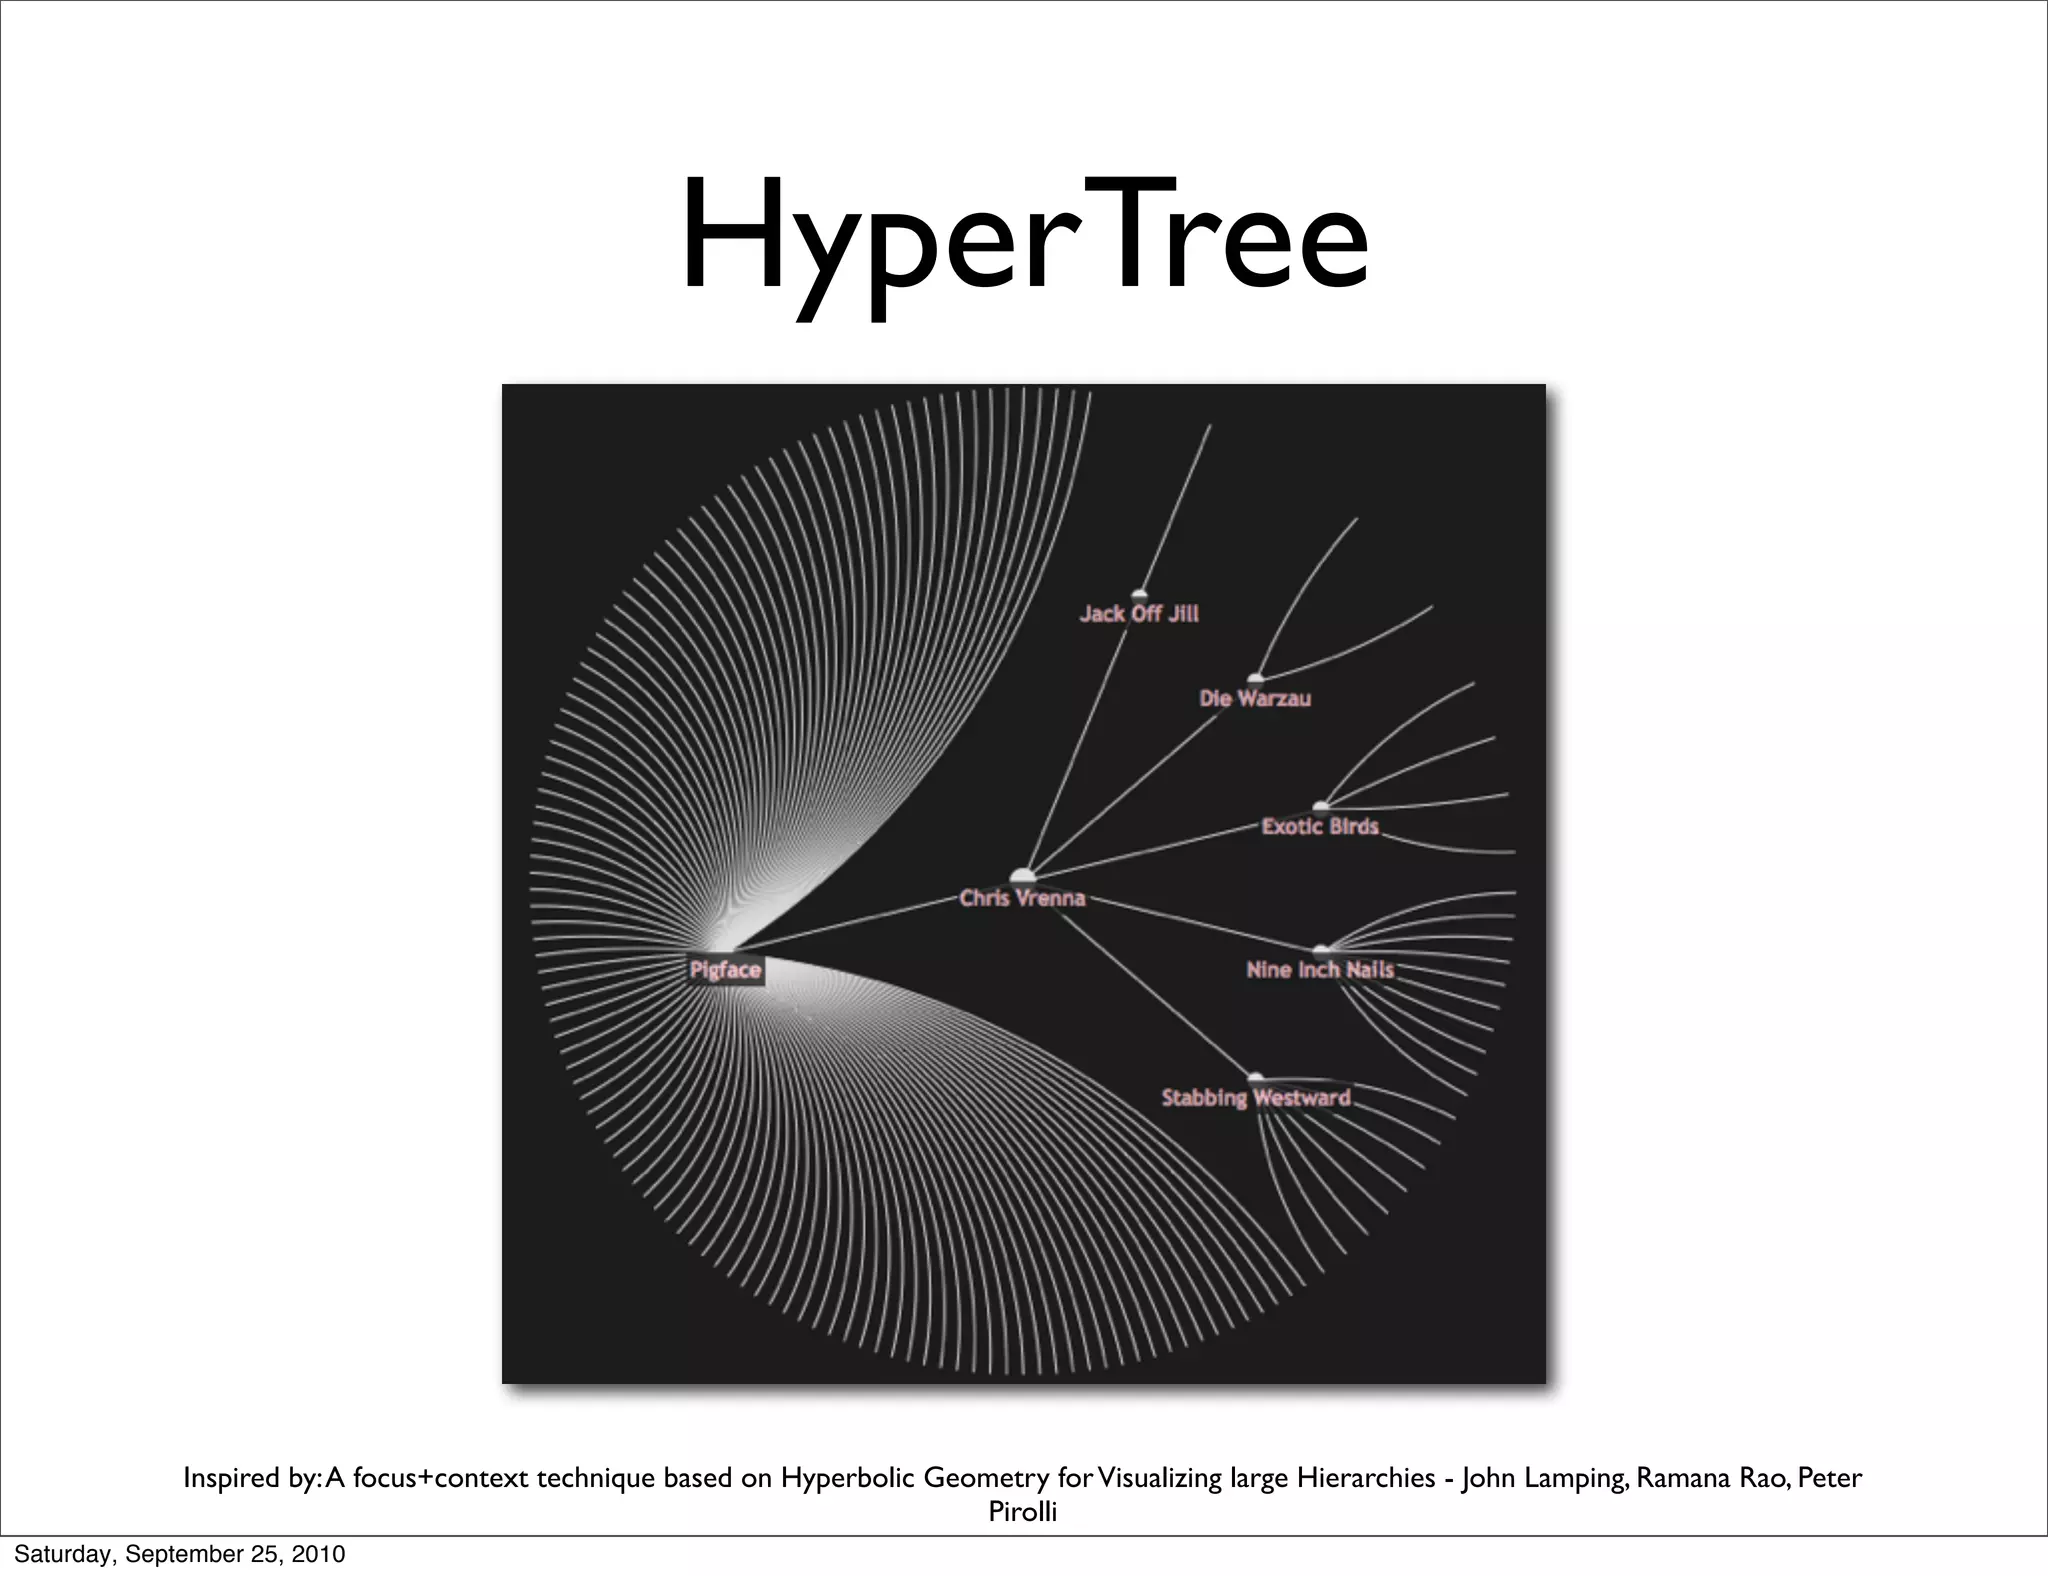

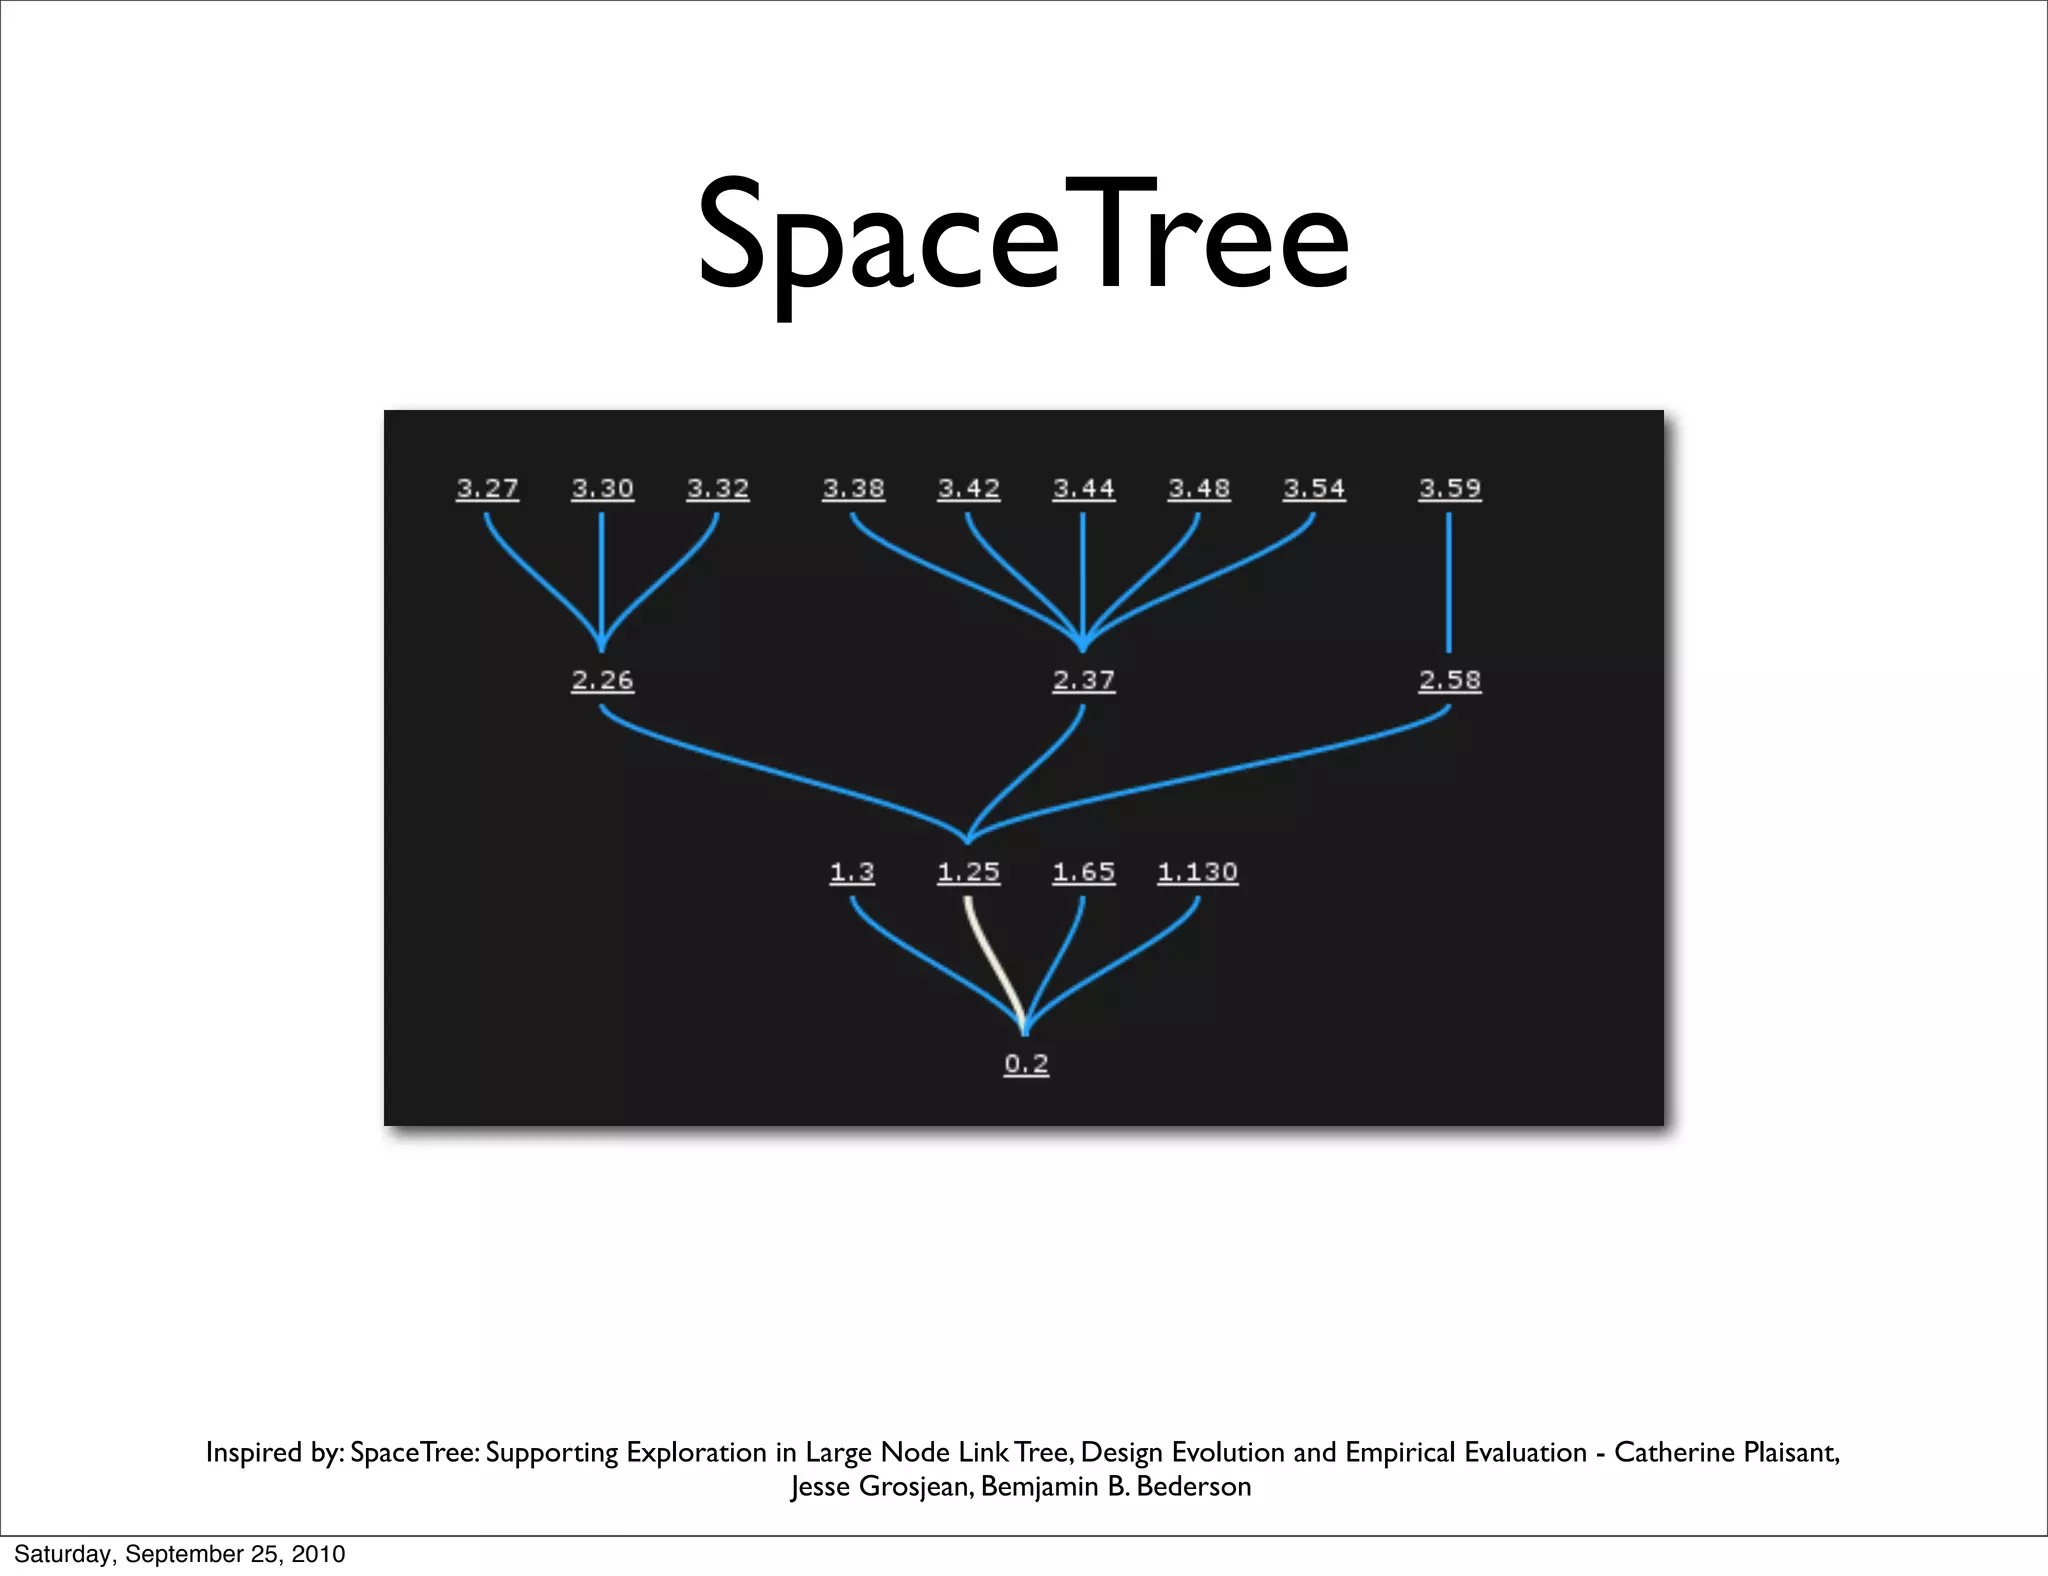
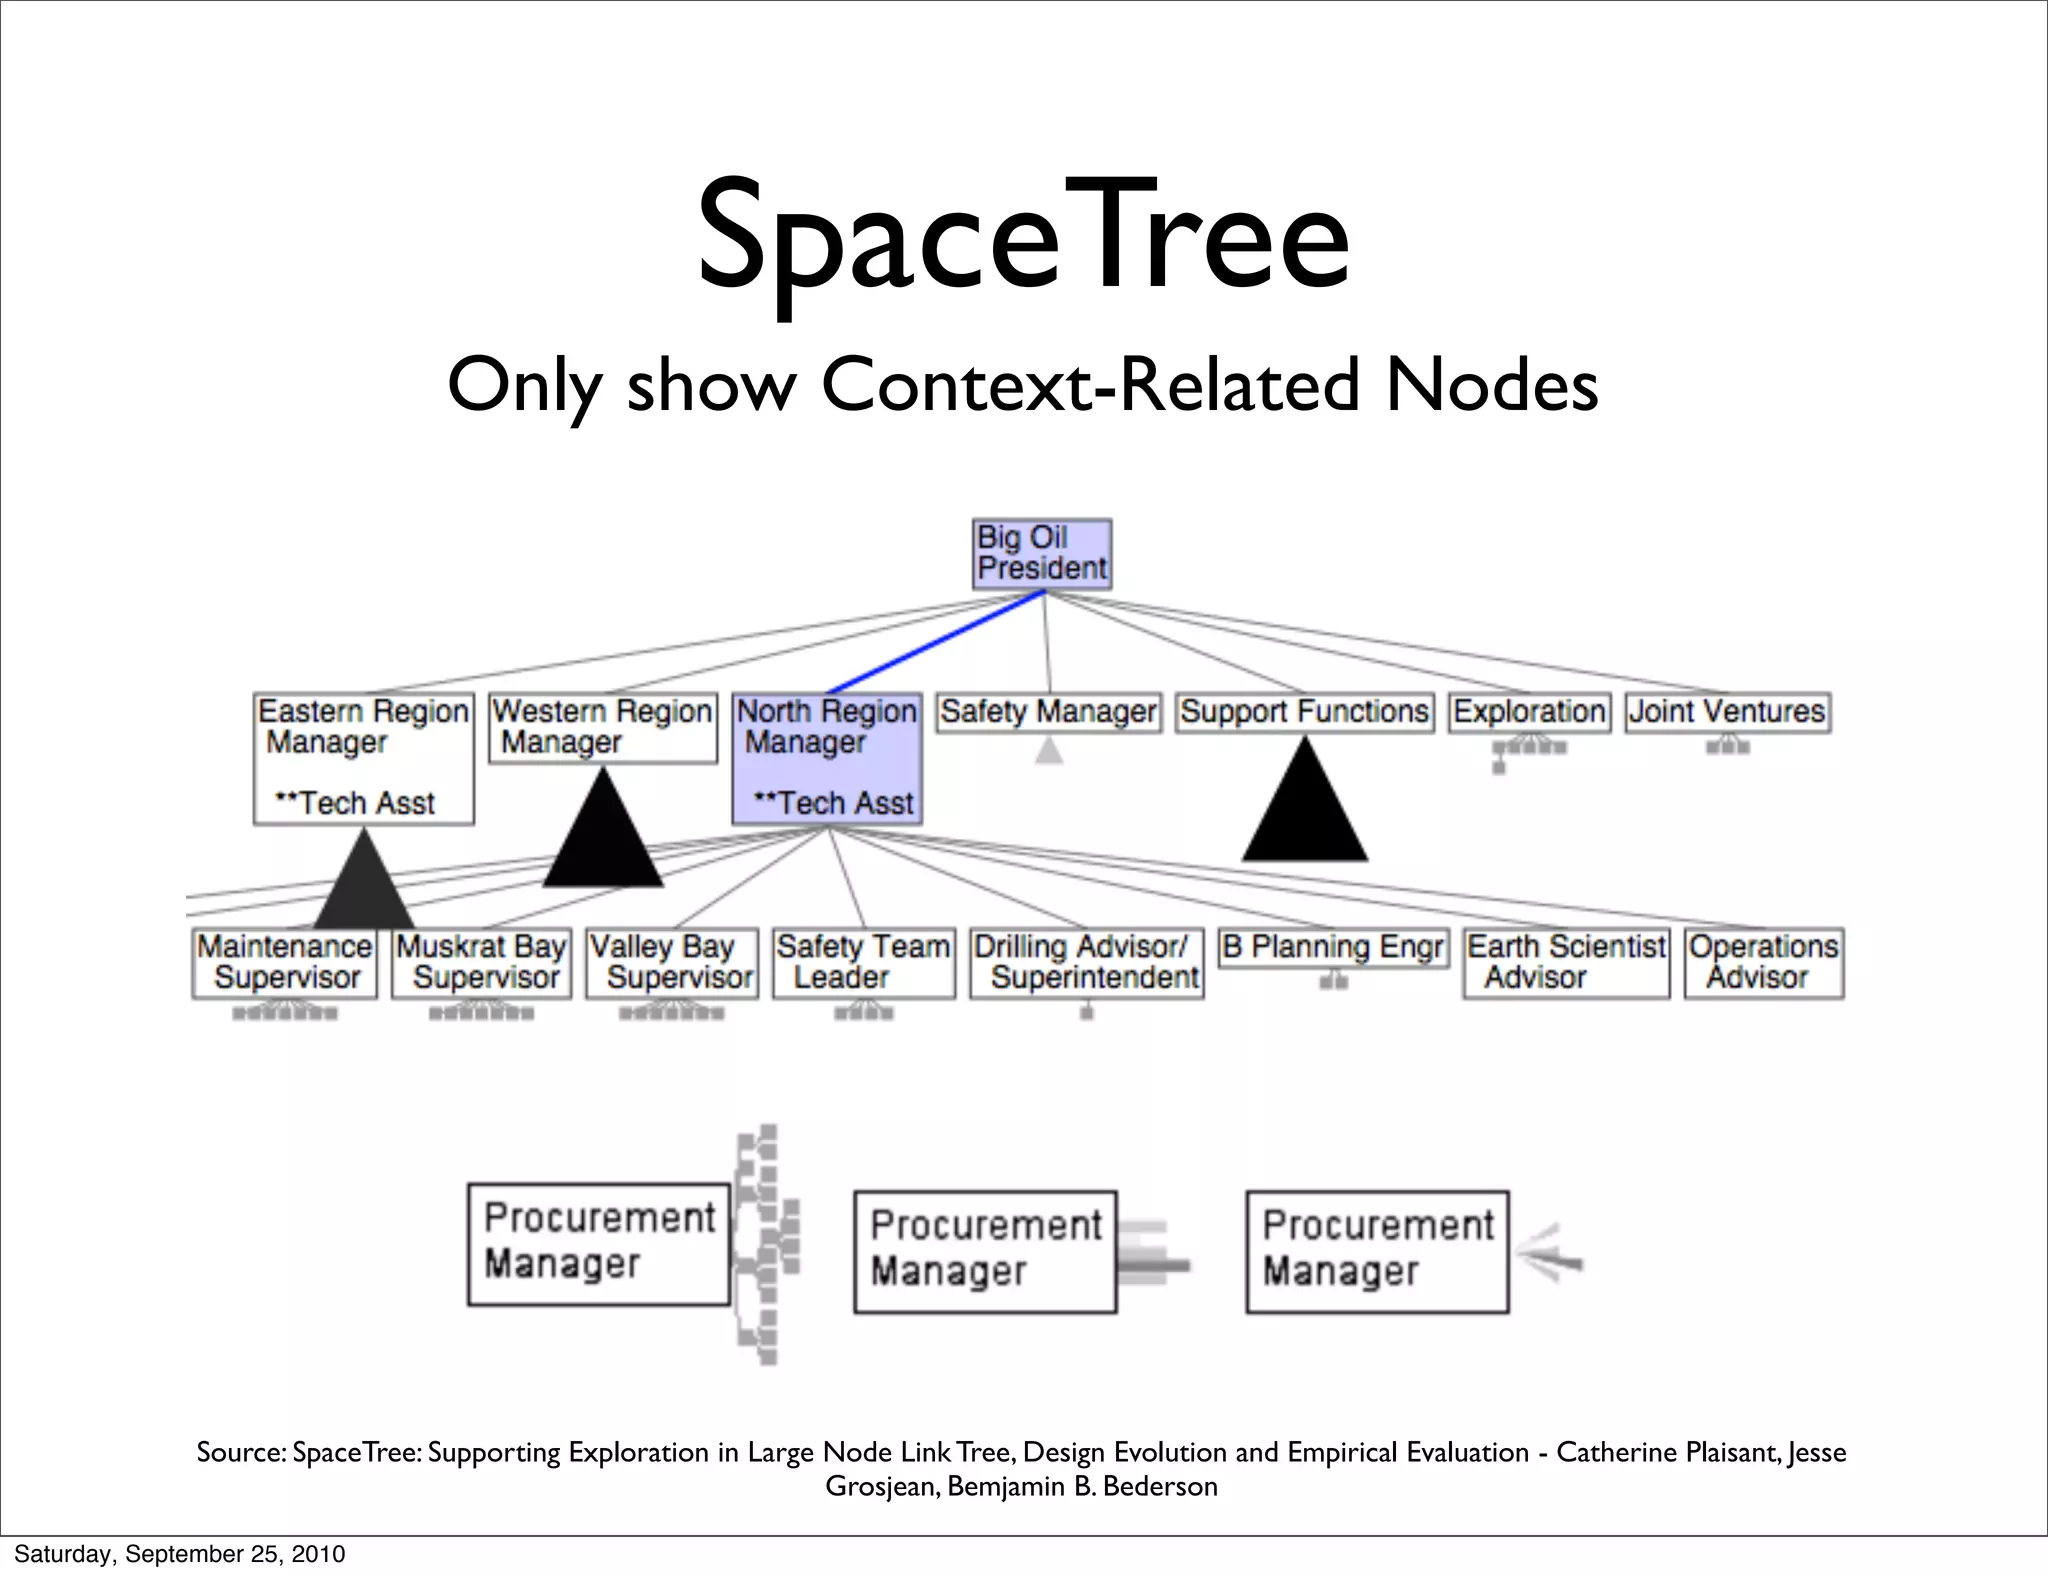
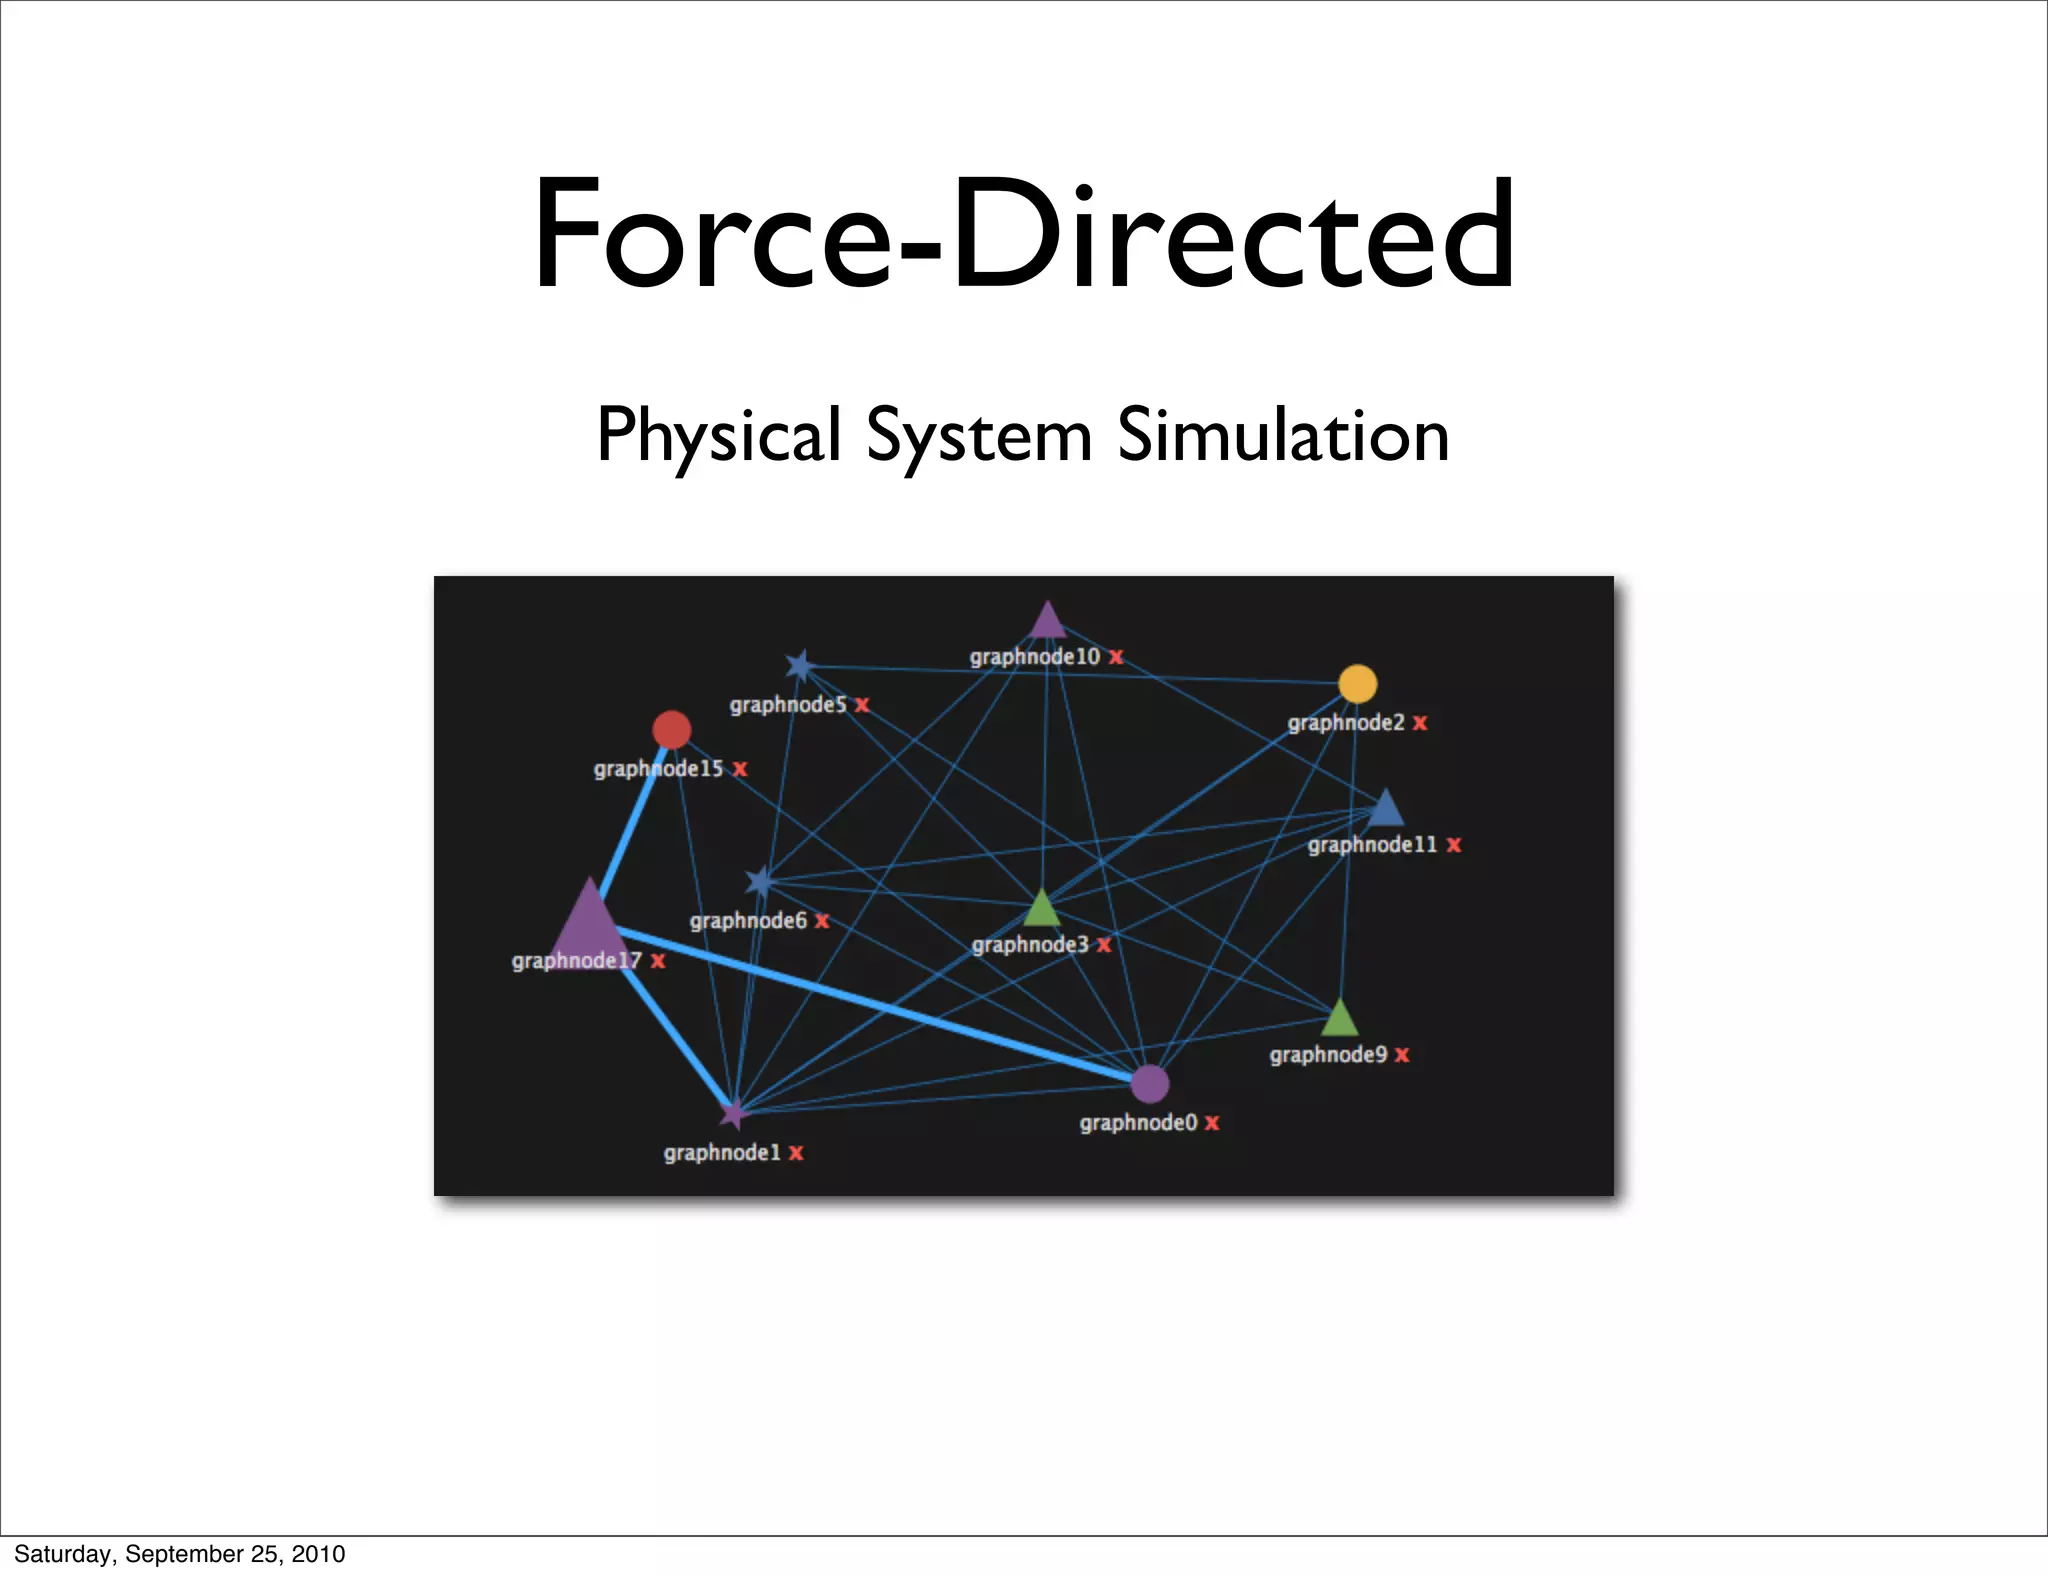
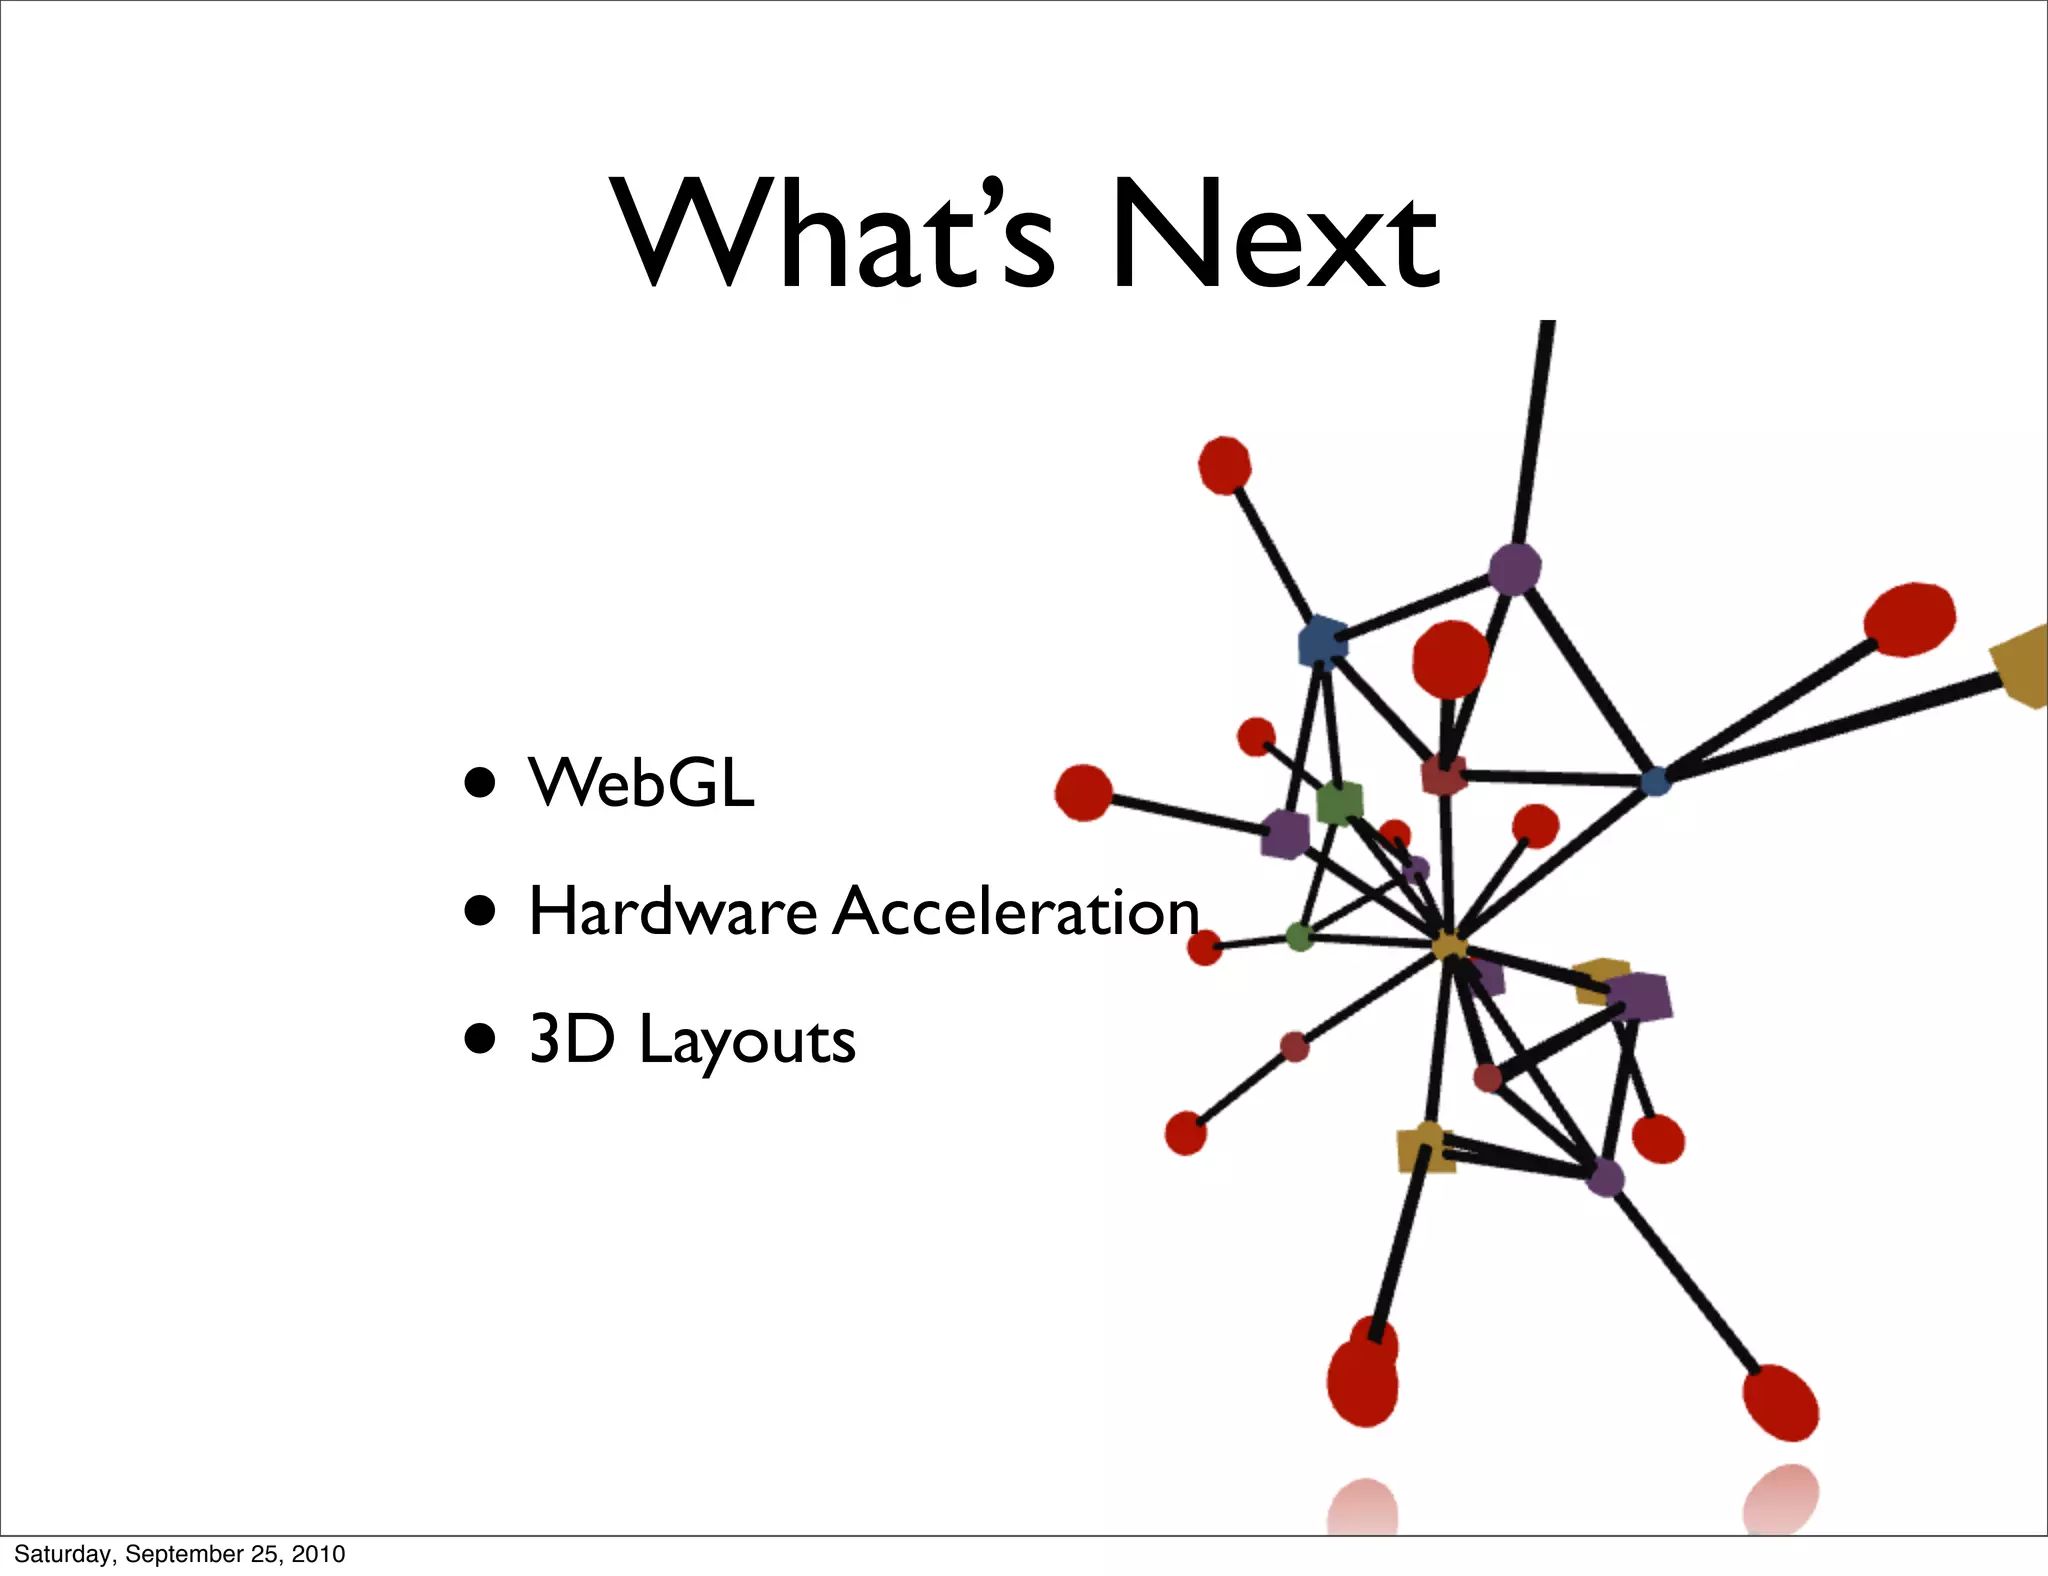

The JavaScript InfoVis Toolkit allows users to create interactive data visualizations for the web. It features multiple graph and tree layouts that can be used modularly and are extensible. The toolkit uses web standards and allows visualizations to be built in a composable way. It includes visualizations like stacked charts, node-link diagrams, sunbursts, treemaps and icicles that were inspired by academic papers. The toolkit is actively developed with features like WebGL and 3D layouts planned for the future.