Downloaded 178 times
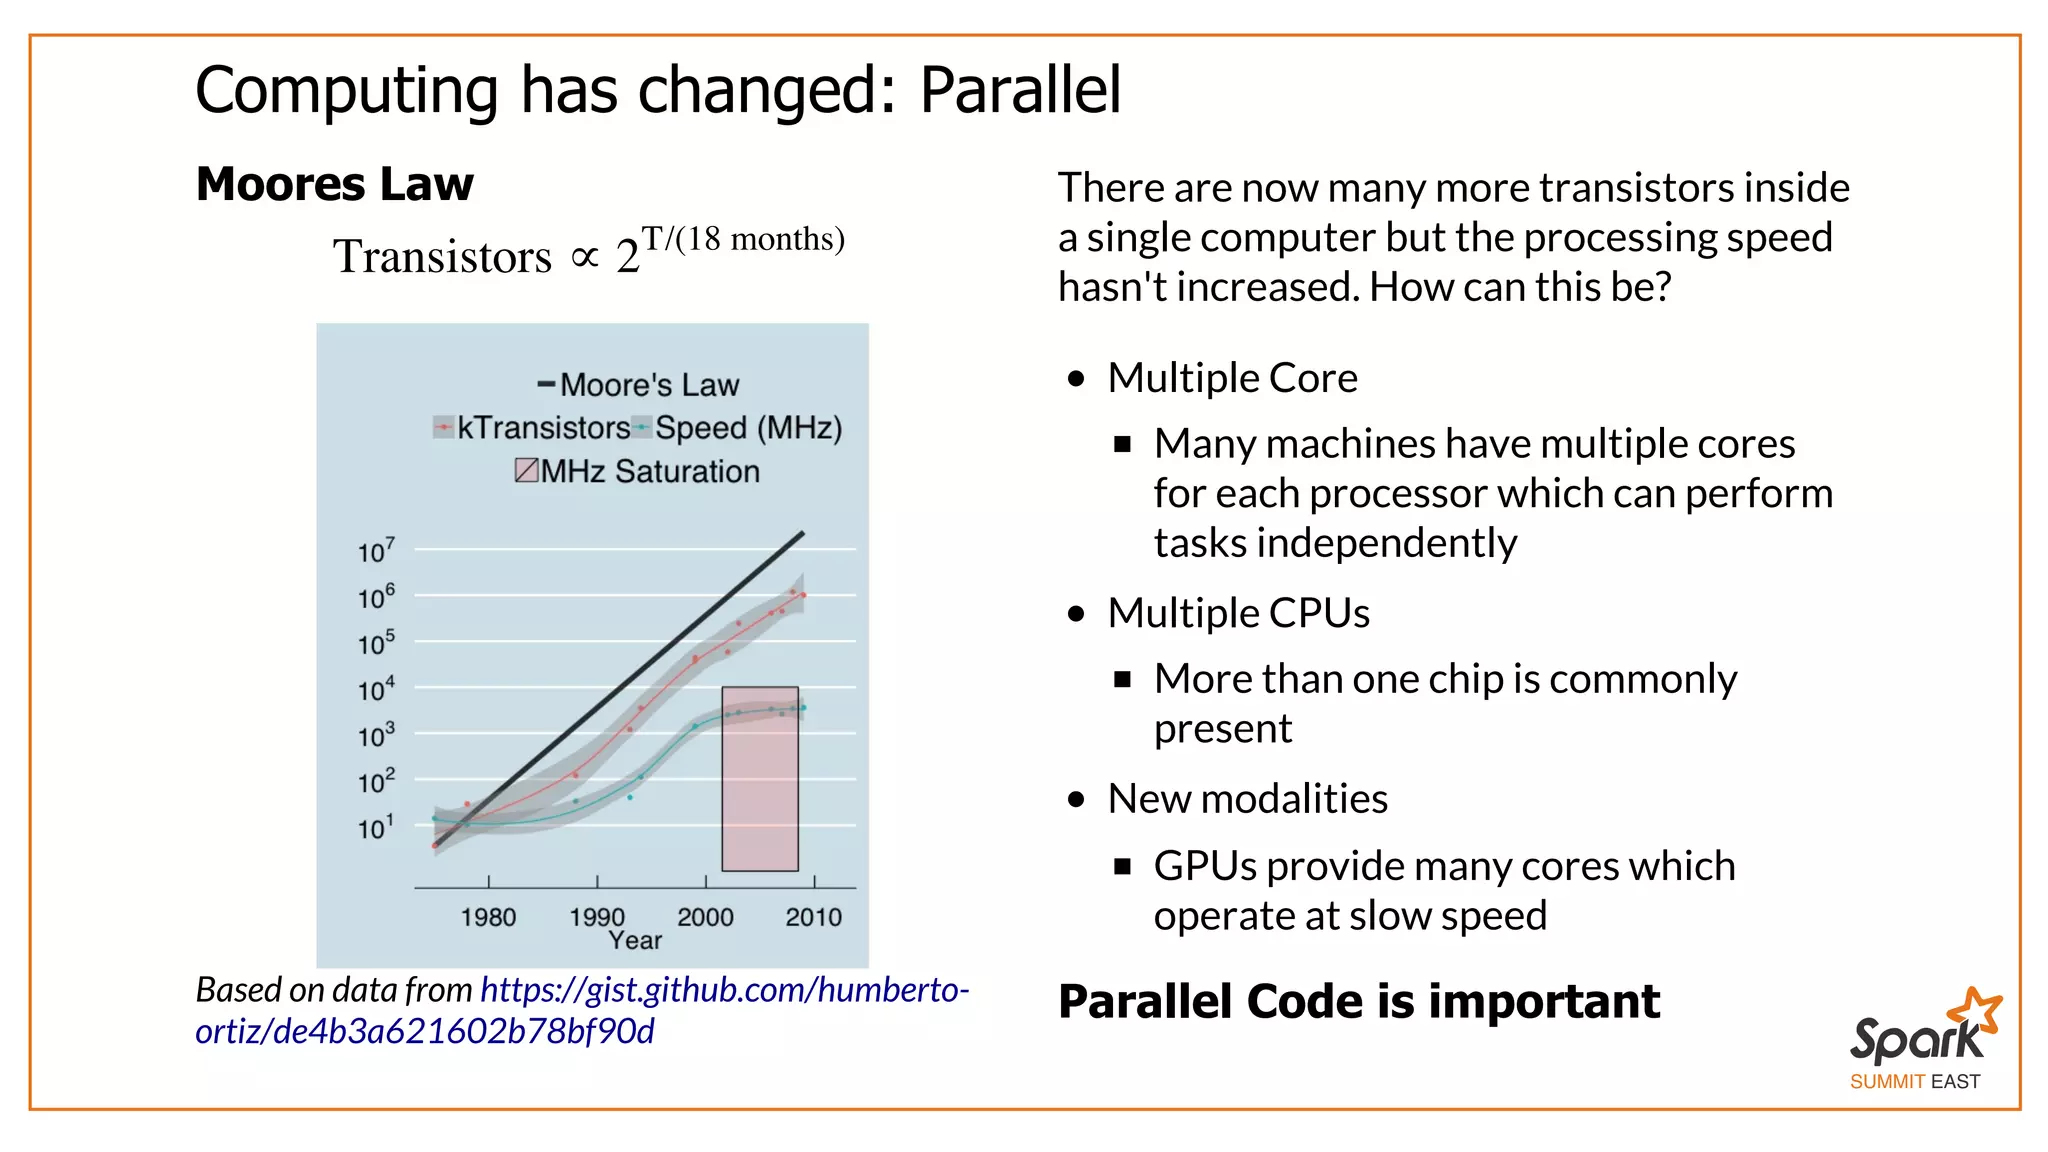
![SUMMIT EAST Synchrotron-based X-Ray Tomographic Microscopy The only technique which can do all peer deep into large samples achieve isotropic spatial resolution with 1.8mm field of view achieve >10 Hz temporal resolution 8GB/s of images [1] Mokso et al., J. Phys. D, 46(49),2013 < 1μm Courtesy of M. Pistone at U. Bristol](https://image.slidesharecdn.com/spark-east-2015-151026164211-lva1-app6891/75/Interactive-Scientific-Image-Analysis-using-Spark-3-2048.jpg)
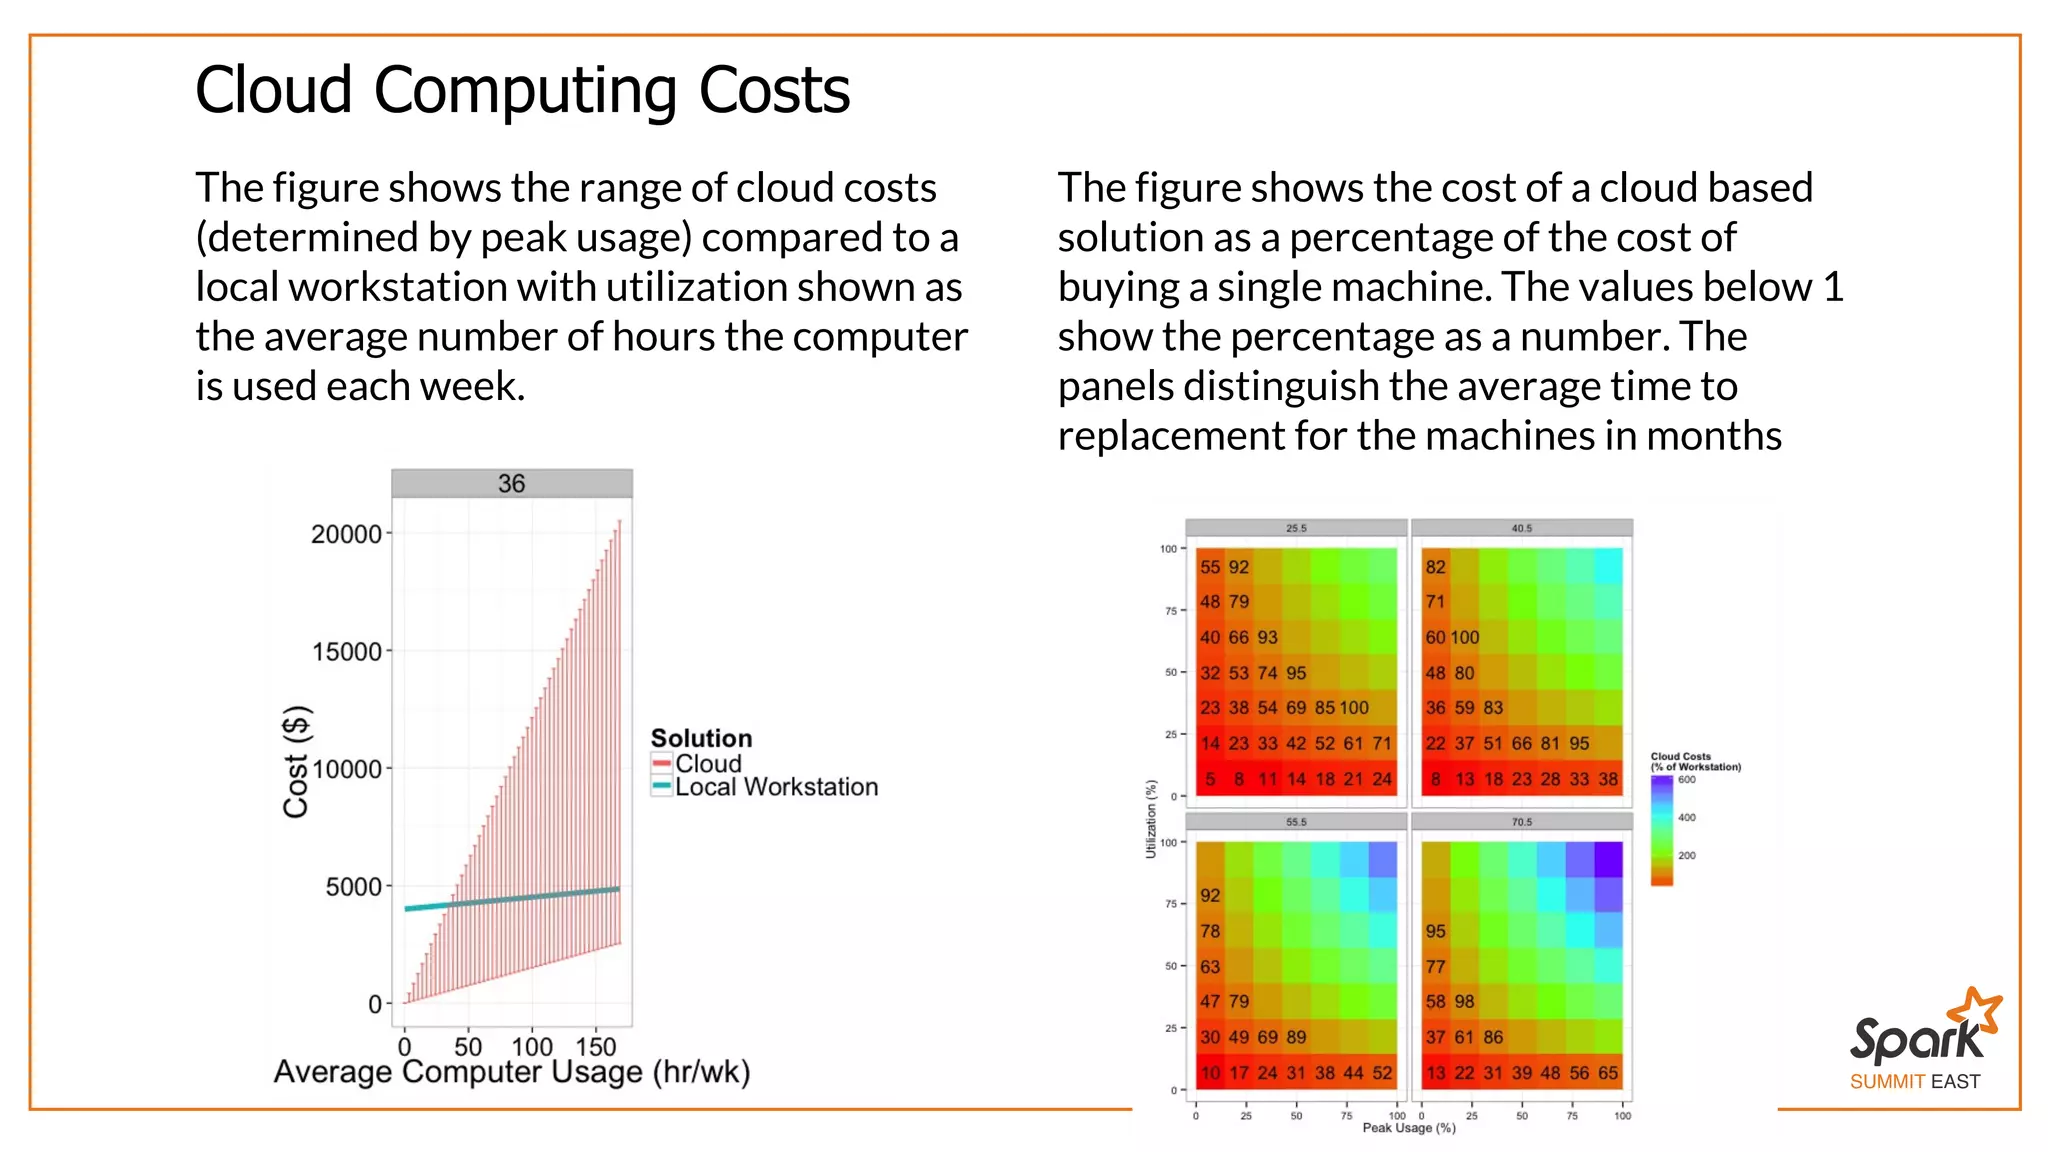
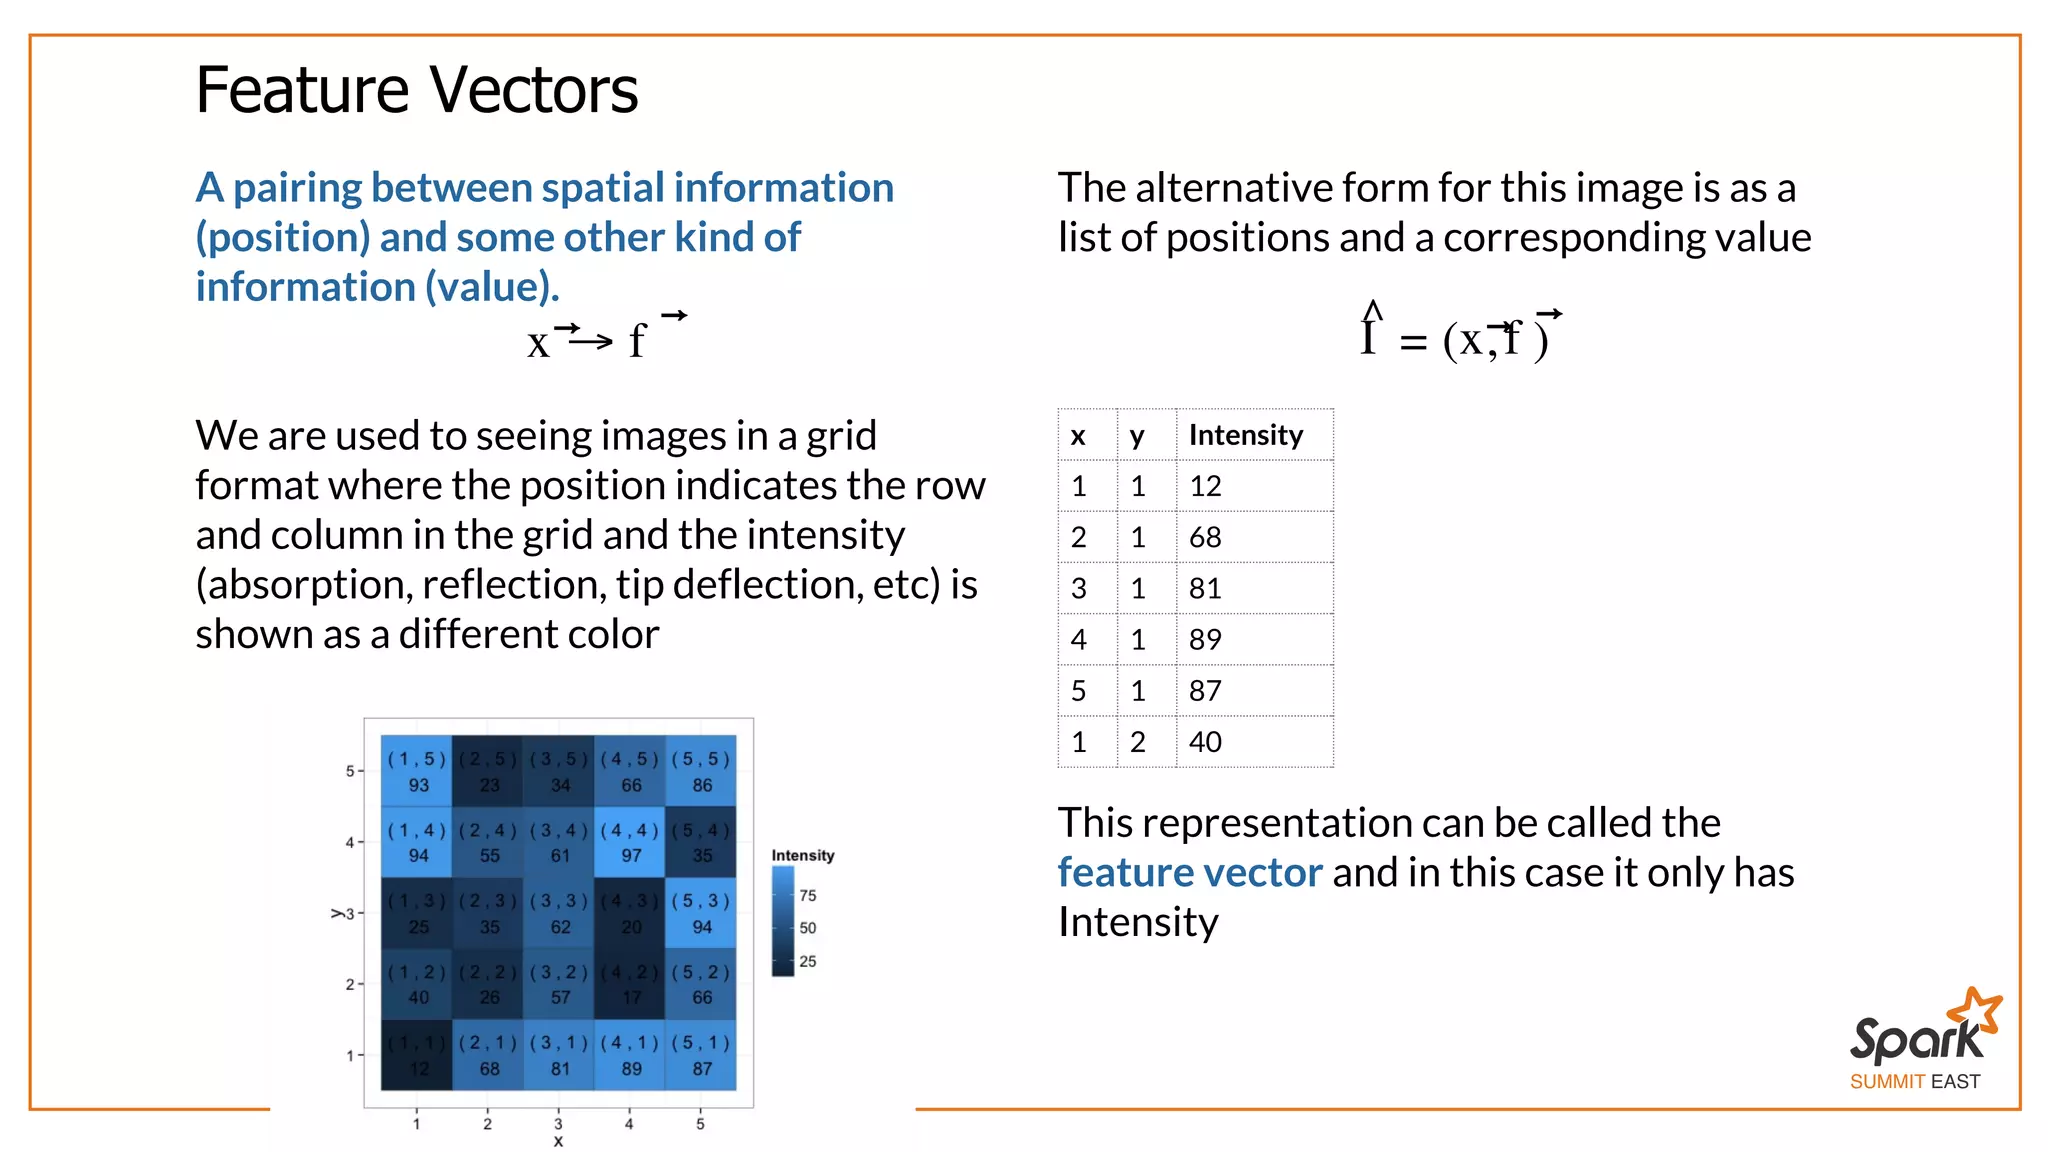
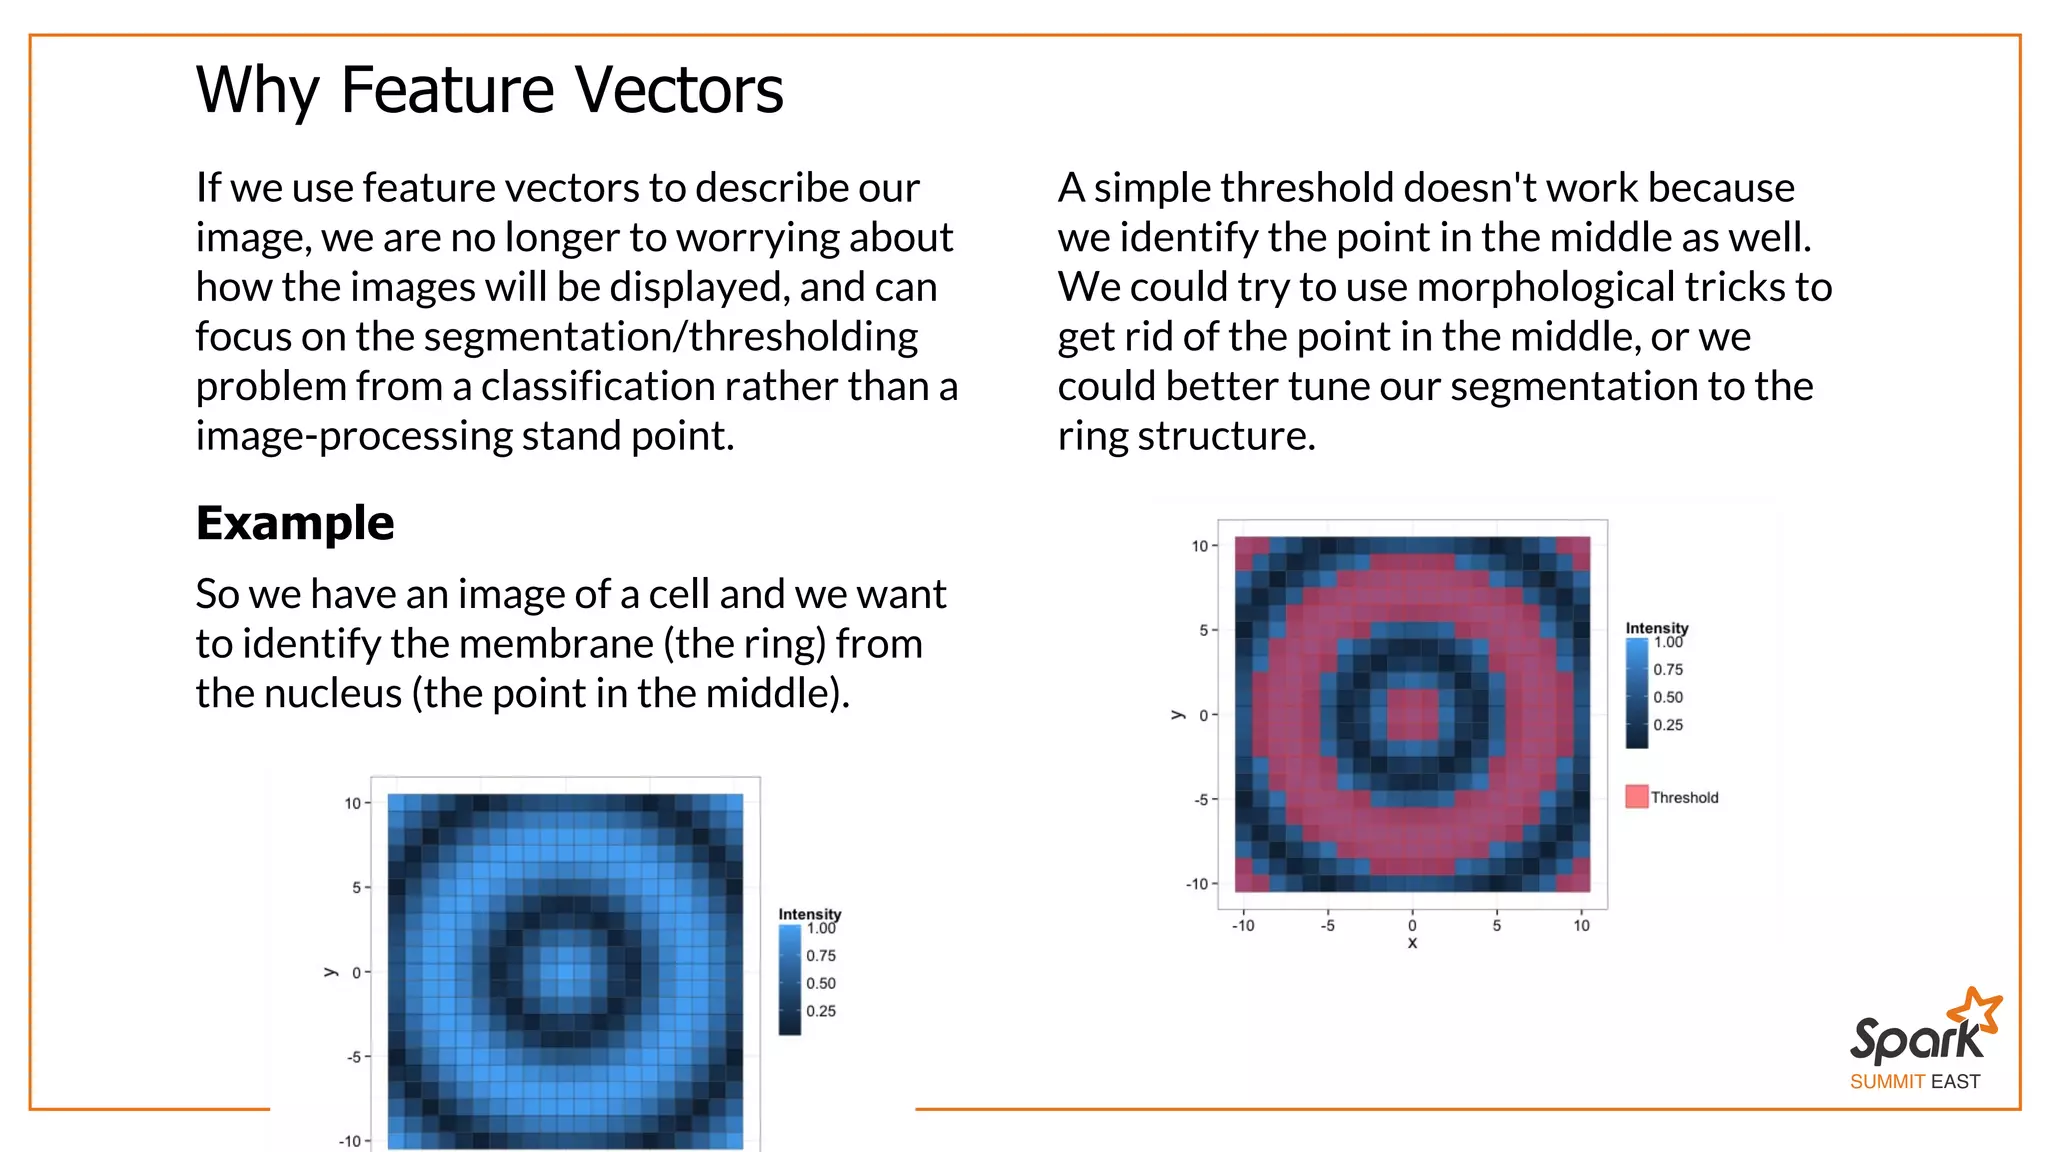
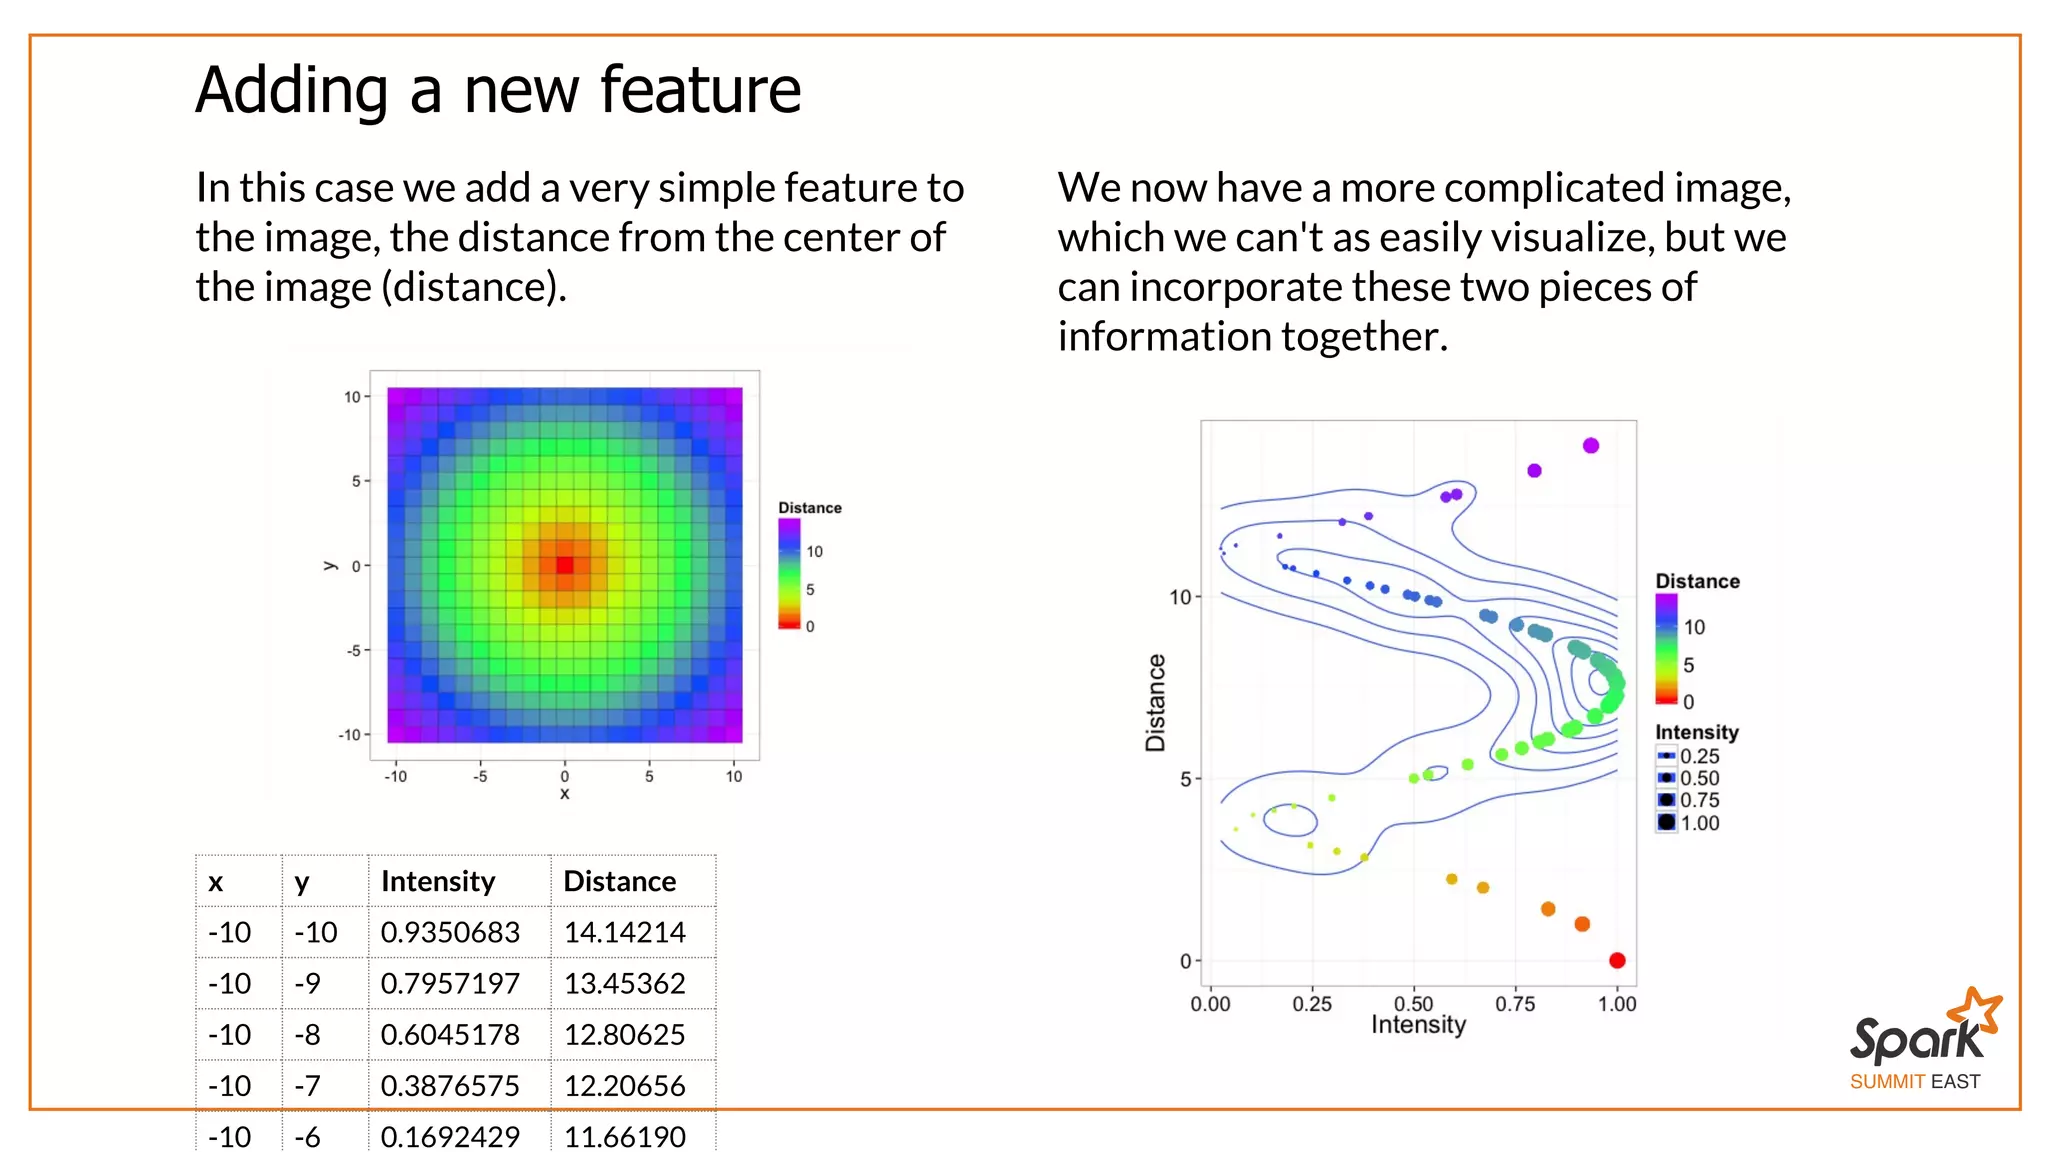
![SUMMIT EAST Flexibility through Types Developing in Scala brings additional flexibility through types[1], with microscopy the standard formats are 2-, 3- and even 4- or more dimensional arrays or matrices which can be iterated through quickly using CPU and GPU code. While still possible in Scala, there is a great deal more flexibility for data types allowing anything to be stored as an image and then processed as long as basic functions make sense. [1] Fighting Bit Rot with Types (Experience Report: Scala Collections), M Odersky, FSTTCS 2009, December 2009 What is an image? A collection of positions and values, maybe more (not an array of double). Arrays are efficient for storing in computer memory, but often a poor way of expressing scientific ideas and analyses. Filter Noise? combine information from nearby pixels Find objects determine groups of pixels which are very similar to desired result](https://image.slidesharecdn.com/spark-east-2015-151026164211-lva1-app6891/75/Interactive-Scientific-Image-Analysis-using-Spark-14-2048.jpg)
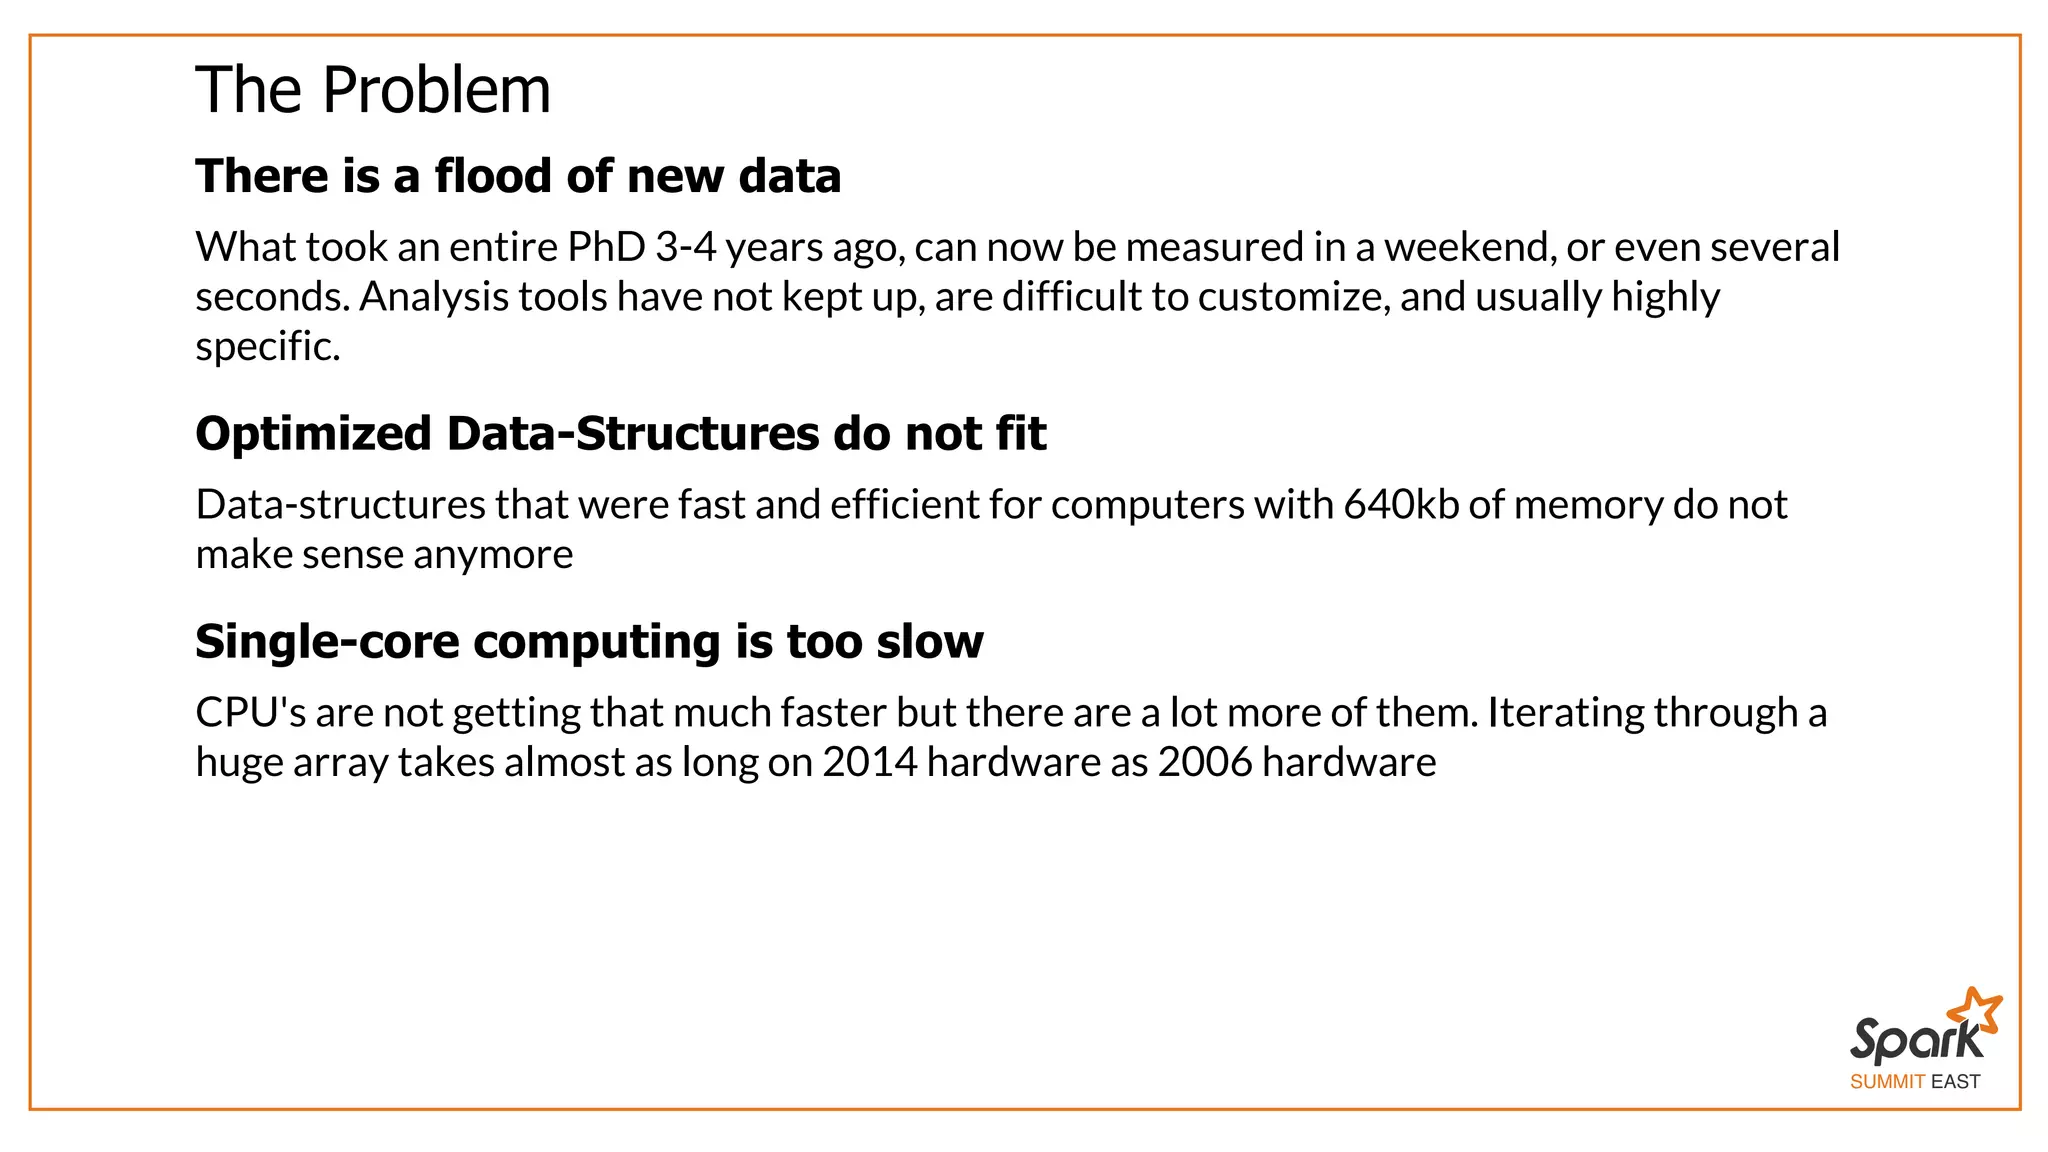
![SUMMIT EAST Making Coding Simpler with Types trait BasicMathSupport[T] extends Serializable { def plus(a: T, b: T): T def times(a: T, b: T): T def scale(a: T, b: Double): T def negate(a: T): T = scale(a,-1) def invert(a: T): T def abs(a: T): T def minus(a: T, b: T): T = plus(a, negate(b)) def divide(a: T, b: T): T = times(a, invert(b)) def compare(a: T, b: T): Int }](https://image.slidesharecdn.com/spark-east-2015-151026164211-lva1-app6891/75/Interactive-Scientific-Image-Analysis-using-Spark-15-2048.jpg)
 (implicit val wst: BasicMathSupport[T]) = { val width: Double = 1 kernel = (pos: D3int,value: T) => value * exp(- (pos.mag/width)**2) kernelReduce = (ptA,ptB) => (ptA + ptB) * 0.5 runFilter(inImage,kernel,kernelReduce) } implicit val SpectraBMS = new BasicMathSupport[Array[Double]] { def plus(a: Array[Double], b: Array[Double]) = a.zip(b).map(_ + _) ... def scale(a: Array[Double], b: Double) = a.map(_*b)](https://image.slidesharecdn.com/spark-east-2015-151026164211-lva1-app6891/75/Interactive-Scientific-Image-Analysis-using-Spark-16-2048.jpg)
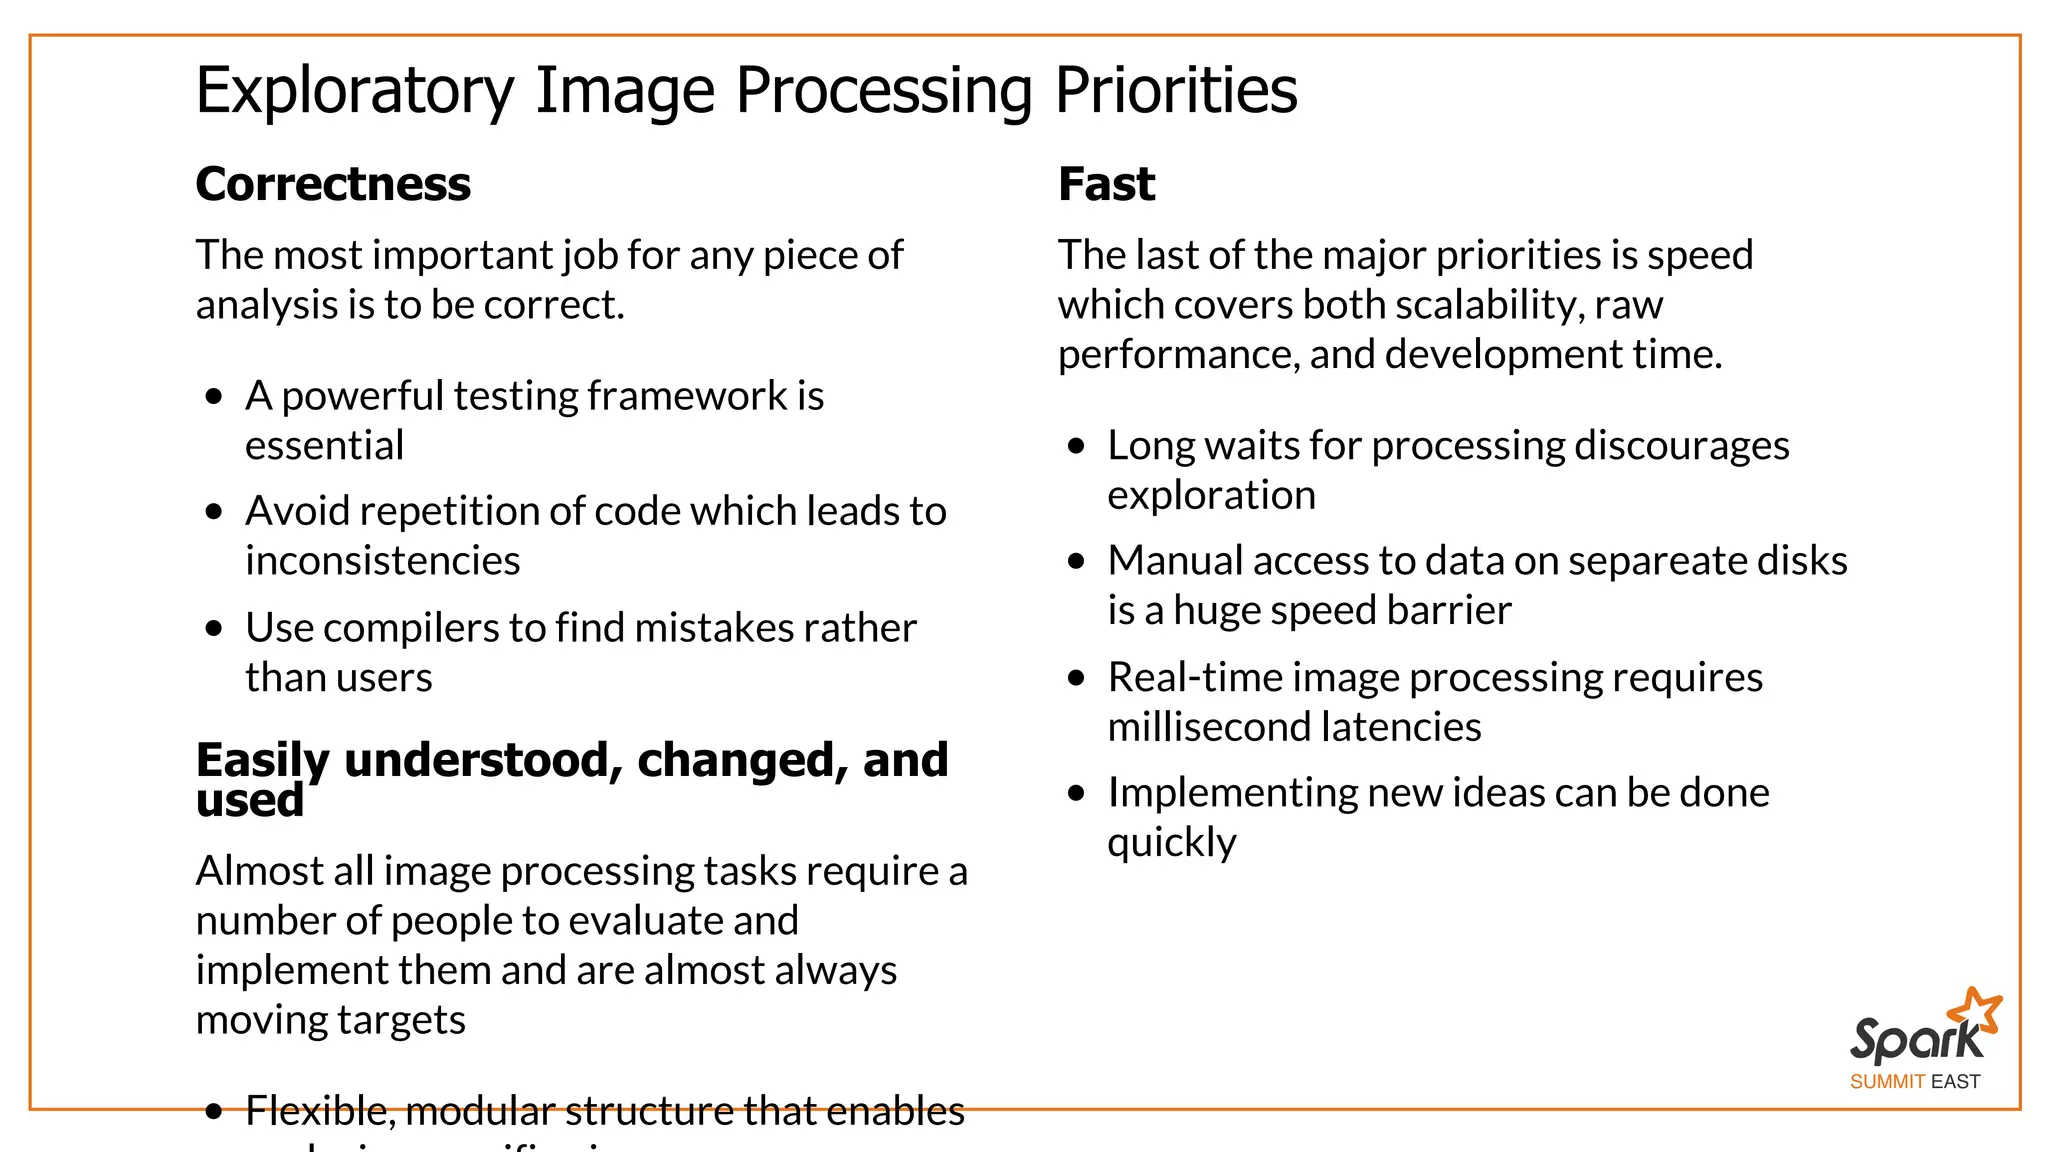
![SUMMIT EAST Science Problems: Big Stitching Images : RDD[((x, y, z), Img[Double])] = [( , Img), …]x⃗ dispField = Images. cartesian(Images).map{ case ((xA,ImA), (xB,ImB)) => xcorr(ImA,ImB,in=xB-xA) }](https://image.slidesharecdn.com/spark-east-2015-151026164211-lva1-app6891/75/Interactive-Scientific-Image-Analysis-using-Spark-23-2048.jpg)
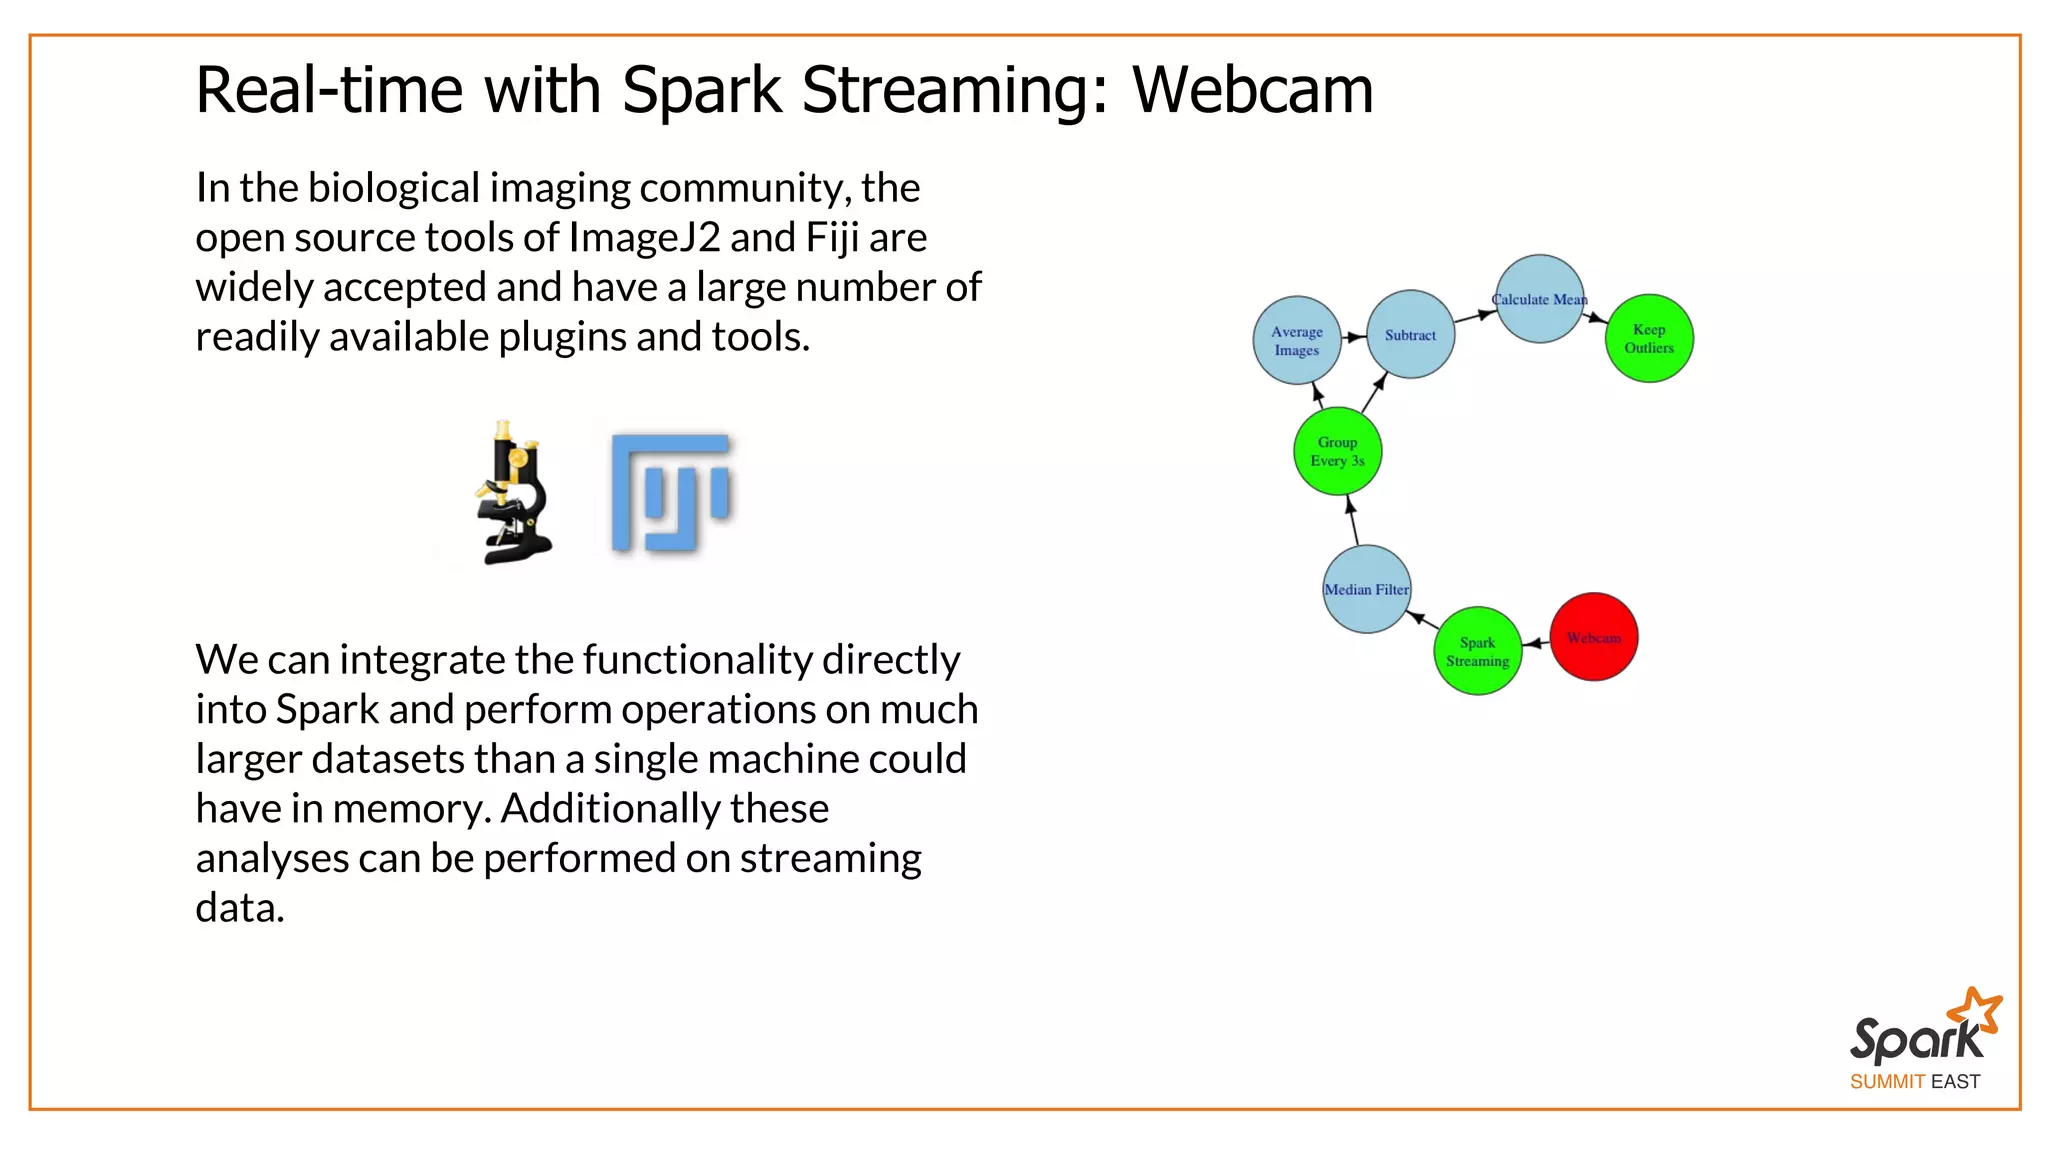

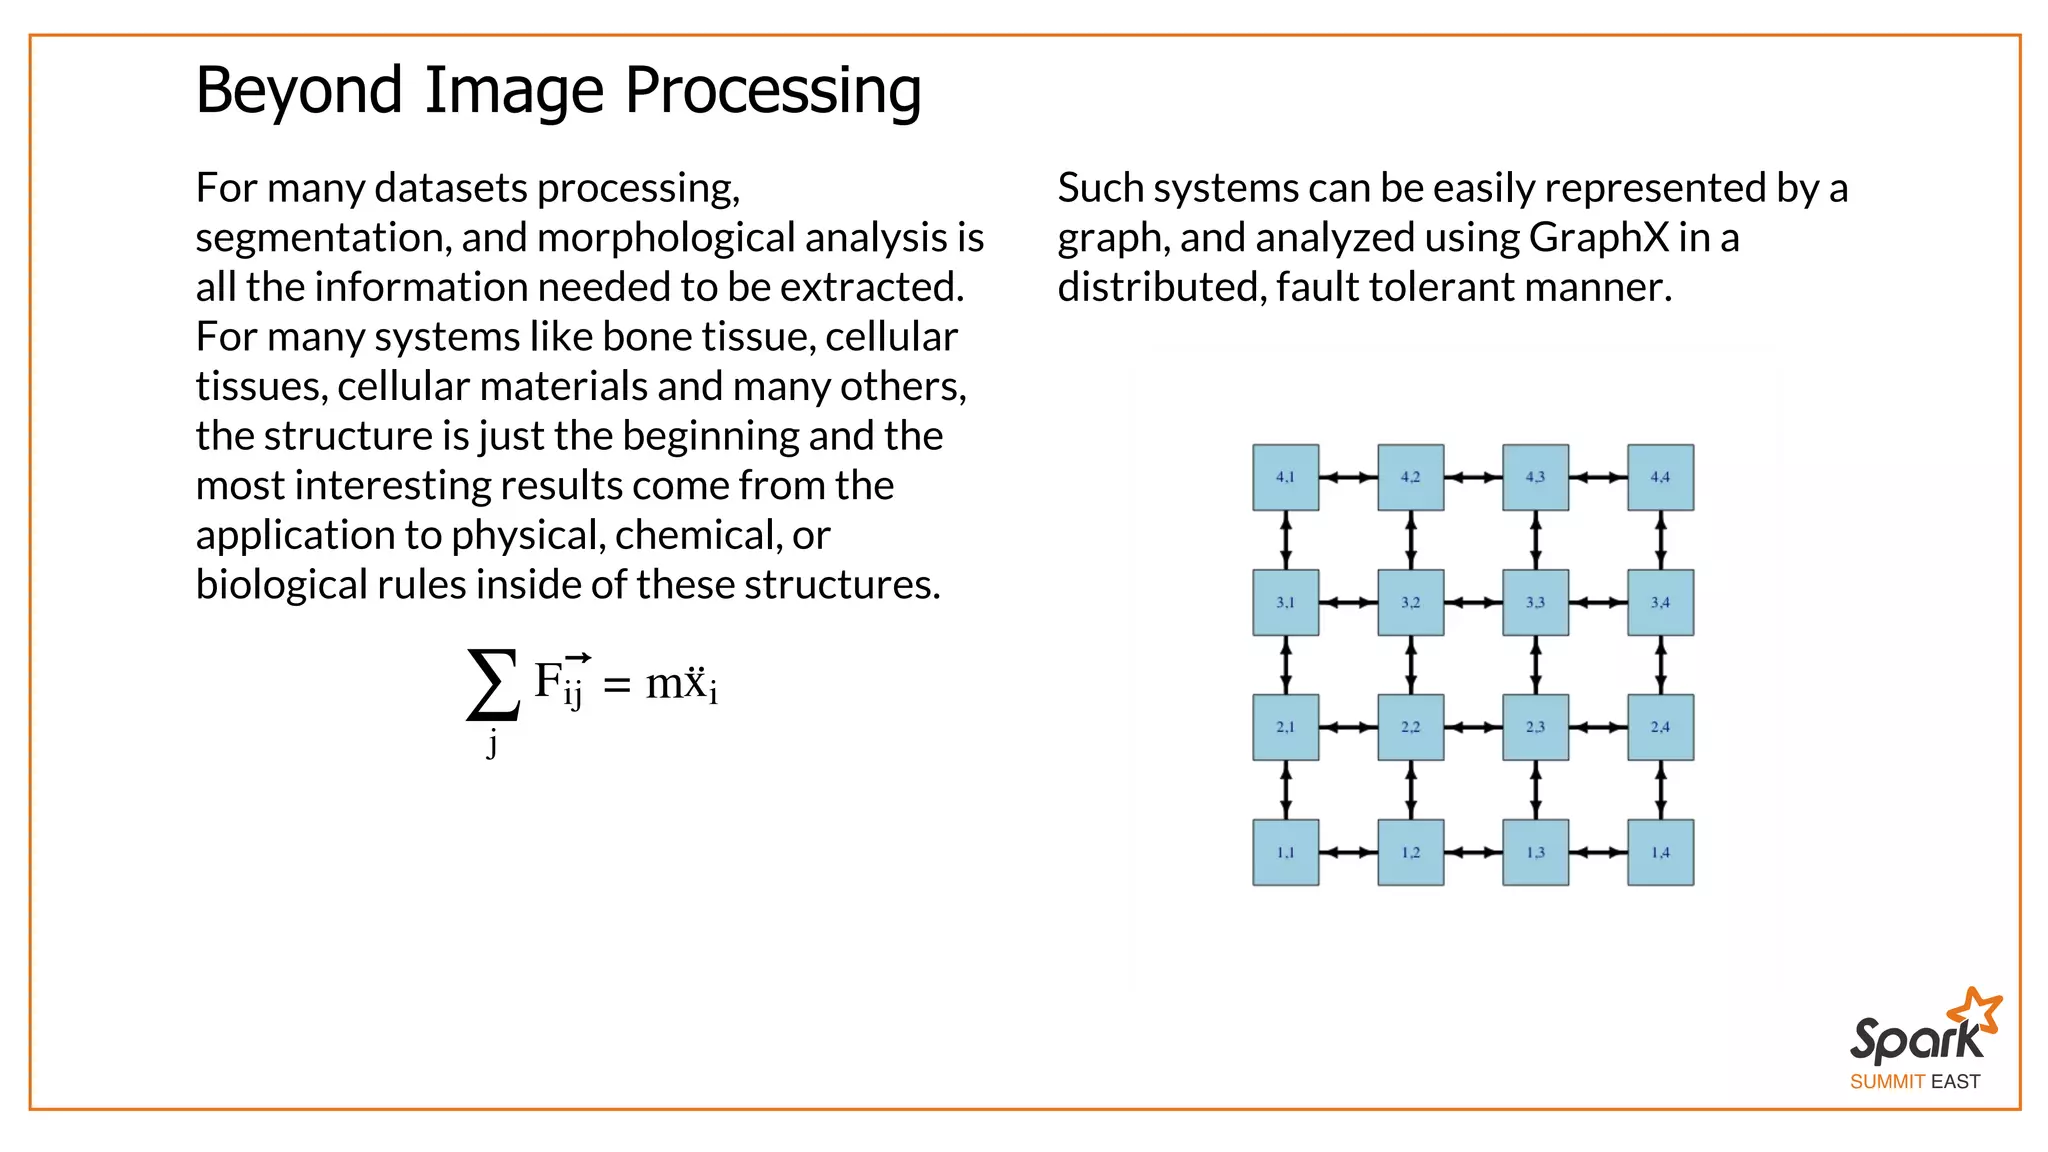
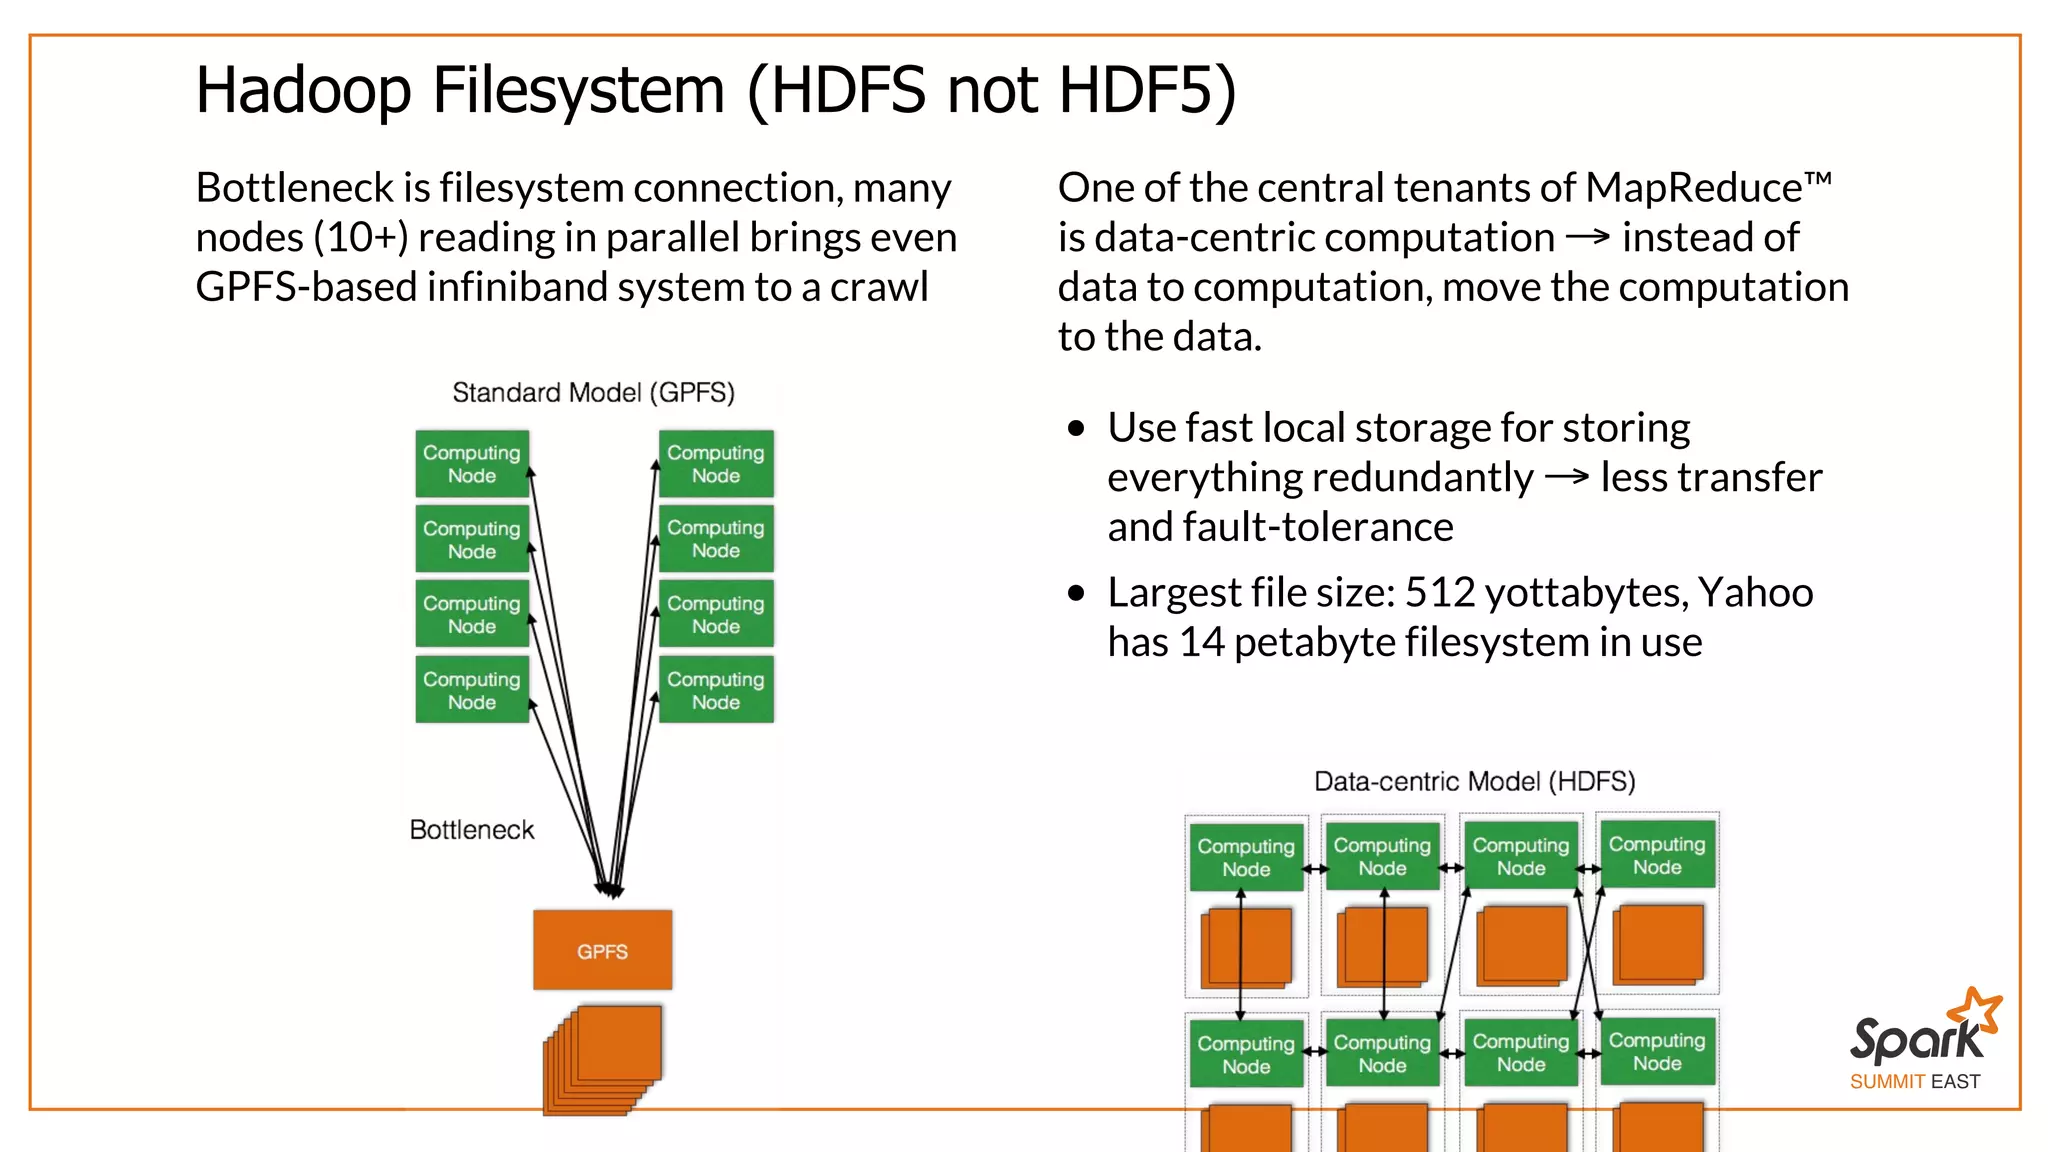

The document outlines a presentation on interactive scientific image analysis using Apache Spark, highlighting techniques such as x-ray tomographic microscopy and hyperspectral imaging. It discusses the challenges posed by large datasets, the evolution of computing, and the necessity for robust frameworks like Spark for efficient analysis. Additionally, it emphasizes the importance of developing user-friendly tools to facilitate image processing and data exploration across various scientific domains.