Reconfiguring the distribution network by selecting open switch states is an effective approach to reduce power losses in the system. However, with the rise of distributed energy resources such as photovoltaic and wind turbines and dynamic loads such as electric vehicles, which introduce uncertainties, it has become necessary to integrate standard operating procedures (SOPs) to better control power flows. This study proposes an algorithm that combines the artificial bee colony (ABC) and Cauchy opposition-based learning (OBL) algorithms to solve the optimization problem of determining both the location and capacity of SOPs, alongside reconfiguring the distribution network. The primary objective is to minimize power losses while improving power quality and system reliability. The proposed methodology was validated on the IEEE 33-node and 69-node distribution networks under seven varied operational scenarios, evaluating outcomes both with and without the integration of SOPs. The findings demonstrate that installing SOPs optimally reduces power losses, enhances system reliability, and maintains voltage levels within acceptable limits. The integration of the two algorithms also accelerates the convergence process, increasing computational speed and avoiding local optimization issues. When compared with other methods, the proposed algorithm delivers similar performance but with faster computation times and fewer iterations, making it more efficient and reliable.
![TELKOMNIKA Telecommunication Computing Electronics and Control Vol. 23, No. 4, August 2025, pp. 1069~1083 ISSN: 1693-6930, DOI: 10.12928/TELKOMNIKA.v23i4.26129 1069 Journal homepage: http://journal.uad.ac.id/index.php/TELKOMNIKA Integrating artificial bee colony and cauchy algorithms for distribution network reconfiguration with soft open points Nguyen Tung Linh1 , Nguyen Quynh Anh2 1 Faculty of Control and Automation, Electric Power University, Ha Noi, Viet Nam 2 Faculty of Information Technology, Electric Power University, Ha Noi, Viet Nam Article Info ABSTRACT Article history: Received Mar 2, 2024 Revised Mar 24, 2025 Accepted May 10, 2025 Reconfiguring the distribution network by selecting open switch states is an effective approach to reduce power losses in the system. However, with the rise of distributed energy resources such as photovoltaic and wind turbines and dynamic loads such as electric vehicles, which introduce uncertainties, it has become necessary to integrate standard operating procedures (SOPs) to better control power flows. This study proposes an algorithm that combines the artificial bee colony (ABC) and Cauchy opposition-based learning (OBL) algorithms to solve the optimization problem of determining both the location and capacity of SOPs, alongside reconfiguring the distribution network. The primary objective is to minimize power losses while improving power quality and system reliability. The proposed methodology was validated on the IEEE 33-node and 69-node distribution networks under seven varied operational scenarios, evaluating outcomes both with and without the integration of SOPs. The findings demonstrate that installing SOPs optimally reduces power losses, enhances system reliability, and maintains voltage levels within acceptable limits. The integration of the two algorithms also accelerates the convergence process, increasing computational speed and avoiding local optimization issues. When compared with other methods, the proposed algorithm delivers similar performance but with faster computation times and fewer iterations, making it more efficient and reliable. Keywords: Artificial bee colony Cauchy algorithm Power losse reduction Reconfiguration distribution network Soft open point This is an open access article under the CC BY-SA license. Corresponding Author: Nguyen Tung Linh Faculty of Control and Automation, Electric Power University Ha Noi City 100000, Viet Nam Email: linhnt@epu.edu.vn 1. INTRODUCTION The rapid evolution of power distribution networks, driven by the integration of distributed energy resources (DERs) and the increasing demand for reliable and efficient energy delivery, has highlighted the limitations of traditional voltage control methods. Conventional approaches, such as switchable capacitor banks and on-load tap changers, often fail to provide the fast and accurate responses required to mitigate voltage violations and reduce power losses in dynamically changing networks [1], [2]. These limitations have spurred the exploration of advanced strategies, among which SR has emerged as a promising solution for enhancing the performance of distribution systems (DS) [3]–[6]. The process of system reconfiguration involves the deliberate adjustment of the distribution network’s structure by toggling the status of switches, with the objective of achieving optimal power distribution, mitigating electrical losses, and ensuring improved voltage regulation throughout the system. However, the radial structure of distribution networks and physical construction constraints often limit the effectiveness of DS [7]. To address these challenges, power electronic devices, particularly standard operating procedures (SOPs),](https://image.slidesharecdn.com/21id26129-251016060059-cbe165fe/75/Integrating-artificial-bee-colony-and-cauchy-algorithms-for-distribution-network-reconfiguration-with-soft-open-points-1-2048.jpg)
![ ISSN: 1693-6930 TELKOMNIKA Telecommun Comput El Control, Vol. 23, No. 4, August 2025: 1069-1083 1070 have been introduced as innovative tools for modernizing distribution networks. SOPs, which utilize voltage source converters (VSCs), enable real-time control of active and reactive power flows, allowing for dynamic voltage regulation and loss reduction [8], [9]. Additionally, SOPs can isolate fault-induced peak currents and mitigate voltage disturbances, thereby enhancing system reliability and operational efficiency [10]. Numerous studies have explored the integration of SOPs into distribution networks, with a primary focus on optimizing their placement and operational parameters to enhance system performance. These efforts aim to maximize efficiency, improve voltage profiles, and reduce power losses. For instance, advanced optimization techniques such as multi-objective particle swarm optimization and taxicab optimization have been employed to determine optimal set points for SOPs, demonstrating significant reductions in power losses and notable enhancements in feeder load balancing and voltage profile regulation [11]. Furthermore, genetic algorithms (GAs) have been applied to optimize SOP placement and active/reactive power settings in unbalanced distribution networks, effectively addressing uncertainties associated with distributed generation (DG) integration [12]. Additionally, mixed-integer second-order cone programming has been utilized to resolve nonlinear optimization problems, achieving minimized operational costs and identifying optimal SOP locations based on voltage violation risk and power flow indices [13]. Bi-level optimization techniques have been proposed to address the challenges of SOP planning, with GAs solving the upper-level problem of SOP placement and capacity determination, and particle swarm optimization handling the lower-level optimization of SOP functions [14]. Unique approaches, such as the integration of AC-SOP and DC-SOP for network reconfiguration, have demonstrated significant reductions in power losses [15]. The Archimedes optimization algorithm has been employed to maximize DG penetration and minimize system losses through successive SR and SOP deployments [16]. Discrete-continuous hyper- spherical search techniques have been applied to optimize radial topologies and minimize power losses in distribution systems with multiple DGs and SOPs [17]. Bi-level multi-objective optimization methods have been developed to ensure operational constraints while optimizing hosting capacity and minimizing total active losses in DSs with simultaneous SR and SOP allocation [18]. Modified particle swarm optimization techniques have been used to address the challenges of integrating SR and SOP in active DSs, focusing on reducing power losses, enhancing steady-state operation efficiency, and optimizing voltage profiles [19]. The artificial bee colony (ABC) algorithm has also been successfully applied to distribution network reconfiguration, demonstrating its effectiveness in optimizing the capacity and location of distributed energy resources while minimizing power losses [20], [21]. Despite the advantages of these methods, such as their ability to accurately determine SOP locations and capacities, reduce power losses, and optimize voltage profiles, they are not without limitations. The complexity and computational time required for these techniques, particularly in large networks, remain significant challenges. Additionally, methods like GAs are prone to falling into local optima, leading to suboptimal solutions. The reliance on precise and comprehensive input data further complicates the optimization process, as data scarcity can adversely affect the effectiveness of the solutions [11]–[19]. In light of these challenges, this paper proposes a novel approach that integrates the ABC algorithm with the Cauchy mutation operator to enhance the optimization of distribution network reconfiguration with soft open points (SOPs). The Cauchy operator, known for its ability to generate large step sizes, improves the exploration and exploitation capabilities of the ABC algorithm, enabling it to escape local optima and converge more efficiently toward global solutions. The proposed method aims to optimize network topology, minimize power losses, and improve voltage stability while considering the operational constraints of SOPs. Through comprehensive simulations and case studies, the effectiveness of the proposed approach is demonstrated, highlighting its potential for real-world applications in modern power distribution systems. In this study, the author proposes an improved ABC algorithm by integrating it with the Cauchy opposition-based learning (OBL) algorithm in steps 1 and 2 of the traditional ABC algorithm, specifically: i) using Cauchy OBL to generate populations from the random population of ABC, and ii) using Cauchy OBL to determine the position of the food source in a multi-dimensional manner, instead of the one-dimensional approach of ABC. With the aim of reducing losses and improving voltage quality, the objective function is considered on the distribution network with SOP installation. The proposed algorithm addresses a complex optimization problem involving both discrete and continuous variables, such as the location and size of SOPs and the open/close states of switches in the reconfiguration problem, along with the technical constraints of the distribution grid. The research results are evaluated on 33-node and 69-node - IEEE under various scenarios to assess the algorithms effectiveness. The structure of this paper is outlined as follows: section 1 presents, Introduction problem, section 2 presents the model, constraint coditions and proposed for problem. Section 3 presents a results and discussions, and section 4 present conclusion.](https://image.slidesharecdn.com/21id26129-251016060059-cbe165fe/75/Integrating-artificial-bee-colony-and-cauchy-algorithms-for-distribution-network-reconfiguration-with-soft-open-points-2-2048.jpg)
![TELKOMNIKA Telecommun Comput El Control Integrating artificial bee colony and cauchy algorithms for distribution network … (Nguyen Tung Linh) 1071 2. MODEL, CONSTRAINT CODITIONS AND PROPOSED FOR PROBLEM 2.1. SOPs model SOP are sophisticated power electronic devices that are increasingly being utilized in radial distribution networks to replace traditional sectionalizing and tie switches Figures 1 and 2. These advanced devices play a crucial role in enhancing system performance by optimizing power flow distribution, improving voltage stability, and reducing energy losses [9]. To achieve this goal, it is essential to effectively isolate faults and quickly restore the power supply during fault conditions, while also dynamically and continuously managing the active and reactive power flow between nodes or feeders during standard grid operations [10]. The core focus of this study is illustrated in Figures 1 and 2, where the basic topology of two-terminal voltage source converters is positioned at sectionalizing and tie switches. Due to their connection through a DC bus, the reactive power outputs of the two converters are independent of each other [11]. The proposed SOP configuration can be modeled using (1). 𝑃𝑛 𝑆𝑂𝑃 + 𝑃𝑚 𝑆𝑂𝑃 + 𝑃𝑛 𝑆𝑂𝑃𝑙𝑜𝑠𝑠 + 𝑃𝑚 𝑆𝑂𝑃𝑙𝑜𝑠𝑠 = 0 (1) In this model, 𝑃𝑛 𝑆𝑂𝑃 , 𝑃𝑚 𝑆𝑂𝑃 denote the active power injected by the SOP at the nth and mth nodes, respectively, and 𝑃𝑛 𝑆𝑂𝑃𝑙𝑜𝑠𝑠𝑒 , 𝑃𝑚 𝑆𝑂𝑃𝑙𝑜𝑠𝑠𝑒 take into consideration the power losses generated internally by the SOP converters at these nodes. This investigation accordingly incorporates the concept of a lossless SOP. In the context of a lossless SOP deployment, the aggregate active power injected into the mth and nth nodes sums to zero [12]. The constraints governing the SOP’s active power are delineated in (2). 𝑃𝑛 𝑆𝑂𝑃 + 𝑃𝑚 𝑆𝑂𝑃 = 0 (2) Figure 1. The placement of the SOP model at the sectionalizing switch Figure 2. Integration of the SOP model at the tie-switch location The reactive power contributions from the SOP to the distribution system network are constrained such that they do not surpass the cumulative reactive power demand of the system loads, as stipulated in (3). ∑ (𝑄𝑛 𝑆𝑂𝑃(𝑘) + 𝑄𝑚 𝑆𝑂𝑃(𝑘)) ≤ ∑ 𝑄𝑢 1 𝑁𝑙𝑜𝑎𝑑 𝑢=1 𝑁𝑆𝑂𝑃 𝑘=1 ∀𝑢 ∈ 𝑁𝑙𝑜𝑎𝑑 , ∀𝑘 ∈ 𝑁𝑆𝑂𝑃 (3) In this context, 𝑄𝑢 𝑙 indicates the reactive power demand at the nth node; while Nload and NSOP denote the total number of loads and SOPs, respectively; Additionally, 𝑄𝑛 𝑆𝑂𝑃 and 𝑄𝑚 𝑆𝑂𝑃 represent the reactive power injected by the SOP at the nth and mth nodes. The capacity constraints of the SOPs are mathematically expressed in (4) and (5): √(𝑃𝑛 𝑆𝑂𝑃 ) 2 + (𝑄𝑛 𝑆𝑂𝑃 ) 2 ≤ (𝑆𝑟𝑎𝑡𝑒𝑑 𝑆𝑂𝑃 ) (4) √(𝑃𝑚 𝑆𝑂𝑃 ) 2 + (𝑄𝑚 𝑆𝑂𝑃 ) 2 ≤ (𝑆𝑟𝑎𝑡𝑒𝑑 𝑆𝑂𝑃 ) (5) here, 𝑆𝑟𝑎𝑡𝑒𝑑 𝑆𝑂𝑃 rated refers to the rated capacity of the SOP. 2.2. Optimization objective This study introduces an optimized formulation designed to minimize active power losses in the distribution network, ensuring that all operational and procedural constraints remain within permissible bounds [12]. The optimized formulation is represented by (6).](https://image.slidesharecdn.com/21id26129-251016060059-cbe165fe/75/Integrating-artificial-bee-colony-and-cauchy-algorithms-for-distribution-network-reconfiguration-with-soft-open-points-3-2048.jpg)
![ ISSN: 1693-6930 TELKOMNIKA Telecommun Comput El Control, Vol. 23, No. 4, August 2025: 1069-1083 1072 𝑀𝑖𝑛𝑋(𝑃𝑙𝑜𝑠𝑠) = ∑ ∝𝑑 ( 𝑃𝑑 2 +𝑄𝑑 2 |𝑉𝑑|2 ) 𝑁𝑏𝑟 𝑑=1 𝑟𝑑 (6) In this equation, X denotes the decision vector, which includes the status of sectionalizing and tie switches, along with the sizing and placement of SOPs; Nbr represents the total number of branches; where αd=1 indicates the connection and αd = 0 the disconnection of the dth branch; For the dth branch, Pd, Qd, and Vd correspond to the active power, reactive power, and voltage at the sending end, respectively, whereas rd signifies the resistance of the branch. As shown in (6) is resolved by accounting for both the equality and inequality constraints related to the operational limits and SOP specifications within DS [18], [19]. The problem constraints are provided in the following manner: The voltage magnitude at each node within the distribution system (DS) must be maintained within permissible bounds, as delineated by the inequality constraints specified in (7) 𝑉𝑚𝑖𝑛 ≤ |𝑉𝑛| ≤ 𝑉𝑚𝑎𝑥 𝑤𝑖𝑡ℎ ∀𝑛 ∈ 𝑁𝑛𝑜𝑑𝑒 (7) In this equation, Vn corresponds to the voltage level measured at node n, while Vmin and Vmax define the lower and upper bounds of acceptable voltage levels, set at 0.95 p.u and 1.05 p.u, respectively. Additionally, Nnode indicates the total number of nodes in the system. Another constraint involves the current limit of each branch, which is expressed in (8): |𝐼𝑑| ≤ 𝐼𝑑 𝑚𝑎𝑥 𝑤𝑖𝑡ℎ ∀𝑑 ∈ 𝑁𝑏𝑟 (8) In this context, Id denotes the current flowing through the dth , while 𝐼𝑑 𝑚𝑎𝑥 ignifies the maximum allowable current for that branch. The guarantee of uninterrupted connectivity and power delivery to all loads from the primary substation amidst network reconfiguration, preserving the radial configuration of the distribution system is imperative. Consequently, the proposed objective function incorporates an equality constraint that encapsulates the necessity of maintaining radiality. This constraint is outlined in (9). Nbr = Nnode – 1 (9) The constraints pertaining to SOP are articulated through (2) to (5), in addition to being formalized in (10) and (11). 𝑄𝑚𝑖𝑛 𝑆𝑂𝑃−𝑛 ≤ 𝑄𝑛 𝑆𝑂𝑃 ≤ 𝑄𝑚𝑎𝑥 𝑆𝑂𝑃−𝑛 (10) 𝑄𝑚𝑖𝑛 𝑆𝑂𝑃−𝑚 ≤ 𝑄𝑚 𝑆𝑂𝑃 ≤ 𝑄𝑚𝑎𝑥 𝑆𝑂𝑃−𝑚 (11) here, 𝑄𝑚𝑖𝑛 𝑆𝑂𝑃−𝑛 and 𝑄𝑚𝑎𝑥 𝑆𝑂𝑃−𝑛 denote the lower and upper limits of the reactive power constraints imposed by the SOP injected into the nth node, respectively; 𝑄𝑚𝑖𝑛 𝑆𝑂𝑃−𝑚 and 𝑄𝑚𝑎𝑥 𝑆𝑂𝑃−𝑚 indicate the minimum and maximum limits of the reactive power constraints imposed by the SOP injected into the mth node, respectively; while and represent the reactive power injections from the SOP at the mth node, respectively; and 𝑄𝑚 𝑆𝑂𝑃 and 𝑄𝑚 𝑆𝑂𝑃 represent the reactive power injected by the SOP at the nth and mth nodes, respectively. 2.3. Combine artificial bee conoly algorith with the cauchy OBL algorithm to problem fomulation The initial population’s characteristics significantly impact both the global convergence speed and the overall effectiveness of the optimization algorithm. A diverse initial population can greatly enhance algorithms optimization performance. However, in the basic ABC algorithm, the initial population is generated randomly, which does not ensure sufficient diversity, potentially leading to suboptimal performance during the search process. Additionally, the neighborhood search phase also affects the algorithms convergence speed, as ineffective search strategies may cause the algorithm to get stuck in local optima. To overcome these limitations and improve the performance of the ABC algorithm, we propose integrating the Cauchy OBL algorithm with the ABC algorithm to optimize the initialization process and speed up convergence. Specifically, our proposed method operates as follows: − Population initialization: the Cauchy OLB algorithm is used to generate superior individuals from the random initialization of the ABC algorithm. This helps enhance the diversity of the population from the](https://image.slidesharecdn.com/21id26129-251016060059-cbe165fe/75/Integrating-artificial-bee-colony-and-cauchy-algorithms-for-distribution-network-reconfiguration-with-soft-open-points-4-2048.jpg)
![TELKOMNIKA Telecommun Comput El Control Integrating artificial bee colony and cauchy algorithms for distribution network … (Nguyen Tung Linh) 1073 start, rather than relying solely on random individuals, thereby improving the optimization capability of the algorithm. − Searching for better food sources: by using Cauchy OLB to improve the initial population, the algorithm can quickly identify better food sources (solutions) in the search space. This is achieved through operations based on (18), helping the algorithm move closer to the global optimum.With this approach, we expect that the improved algorithm will converge faster and achieve better optimal results compared to the basic ABC algorithm. 2.3.1. Overview of artificial bee conlony algorithm The ABC algorithm, pioneered by Fuad et al. [20], is a metaheuristic optimization technique modeled after the efficient foraging patterns and collaborative behavior exhibited by honeybee colonies in nature. This algorithm categorizes bees into three distinct roles: employed bees, onlooker bees, and scout bees. The colony is bifurcated into two groups: the first comprises employed bees, while the second consists of onlooker bees. When a food source is exhausted, employed bees adaptively transform into scout bees to explore new regions. In the ABC framework, each food source symbolizes a candidate solution to the optimization problem, with the nectar quantity reflecting the fitness value of the solution. It is important to note that the quantity of employed bees matches the number of food sources, which directly aligns with the number of candidate solutions being assessed during each iteration. The stages of ABC are repeated until a stopping criterion is met. − Initialization phase [22] The algorithm commences with the initialization of key parameters, including the maximum cycle number (MCN) and the limit for abandoning food sources. Representing the dimensionality of the problem as D, an initial population of food sources, denoted as x, is randomly generated within the predefined solution space, expressed as follows: x = {x1, x2, …, xSN}. Each food source xi corresponds to a potential solution of the optimization problem and is represented as xi = {xi1, xi2, …, xiD} for i ranging from 1 to SN. The initialization process includes assigning values to xi. 𝑥𝑖𝑑 = 𝑥𝑖𝑑,𝑚𝑖𝑛 + 𝑟𝑎𝑛𝑑(0,1)(𝑥𝑖𝑑,𝑚𝑎𝑥 − 𝑥𝑖𝑑,𝑚𝑖𝑛) with (d =1,2…,D) (12) In this contex, xid,max and xid,min represent the upper and lower bounds of the search space, respectively, while rand(0,1) denotes a randomly generated number within the interval (0,1). The concentration and fitness level of the food source are then determined (13). 𝑓𝑖𝑡(𝑥𝑖) = { 1 + 𝑓(𝑥𝑖) 𝑓(𝑥𝑖) ≥ 0 1 1+|𝑓(𝑥𝑖)| 𝑓(𝑥𝑖) ≤ 0 (13) In this equation, 𝑓(𝑥𝑖) represents the objective function value, while 𝑓𝑖𝑡(𝑥𝑖) corresponds to the food concentration of the ith food source. − Employed bee phase [20] Guide the bees to explore the nearby food sources, and the algorithm for generating new food sources is vi = {vi1, vi2, …, viD} 𝑣𝑖𝑑 = { 𝑥𝑖𝑑 + 𝑟𝑖𝑑(𝑥𝑖𝑑 − 𝑥𝑞𝑑) 𝑖𝑓 𝑑 = 𝑑𝑟𝑎𝑛𝑑 𝑥𝑖𝑑 𝑖𝑓 𝑑 ≠ 𝑑𝑟𝑎𝑛𝑑 (14) here, q is a randomly selected number within the range [1, SN] where q i distinct food source, different from the ith one is chosen from the total SN food sources. Additionally, drand is a random integer between [1, D], and rid - 1,1 is a random number that determines the search scope. After the neighborhood search, the selection follows the “greed principle. If the new food source has a higher concentration, it replaces the old one; if not, the old source is retained. This approach directs the optimization process towards more promising areas, maximizing food concentration. − Onlooker bee phase [22] 𝑃(𝑥𝑖) = 𝑓𝑖𝑡(𝑥𝑖) ∑ 𝑓𝑖𝑡(𝑥𝑖) 𝑆𝑁 𝑖=1 (15) Similarly, the follower bee performs a local search around the selected food source utilizing (14) and applies a greedy selection mechanism. If the nectar quality of the newly discovered source surpasses that of](https://image.slidesharecdn.com/21id26129-251016060059-cbe165fe/75/Integrating-artificial-bee-colony-and-cauchy-algorithms-for-distribution-network-reconfiguration-with-soft-open-points-5-2048.jpg)
![ ISSN: 1693-6930 TELKOMNIKA Telecommun Comput El Control, Vol. 23, No. 4, August 2025: 1069-1083 1074 the original source identified by the lead bee, the old source is updated, and a role transition occurs. Otherwise, the initial selection is retained without modification. − Scout bee phase [22] If the food source’s quality shows no improvement over successive iterations following the greedy selection, it is deemed a local optimum and abandoned. The worker bee then transitions to a scout bee, initiating a global search using (12) to identify a new solution. Once a new food source is found, the scout bee reverts to its worker role, ensuring continued exploration and avoidance of stagnation in the optimization process. The algorithm logs the best food source found and checks the termination condition. The actions of employed, observer, and scout bees continue until the termination condition is met, typically either satisfying the allowable error value or reaching zero cycles. 2.3.2. Improved ABC combined Cauchy OBL to problem formulation The performance of the ABC algorithm is influenced by two main factors: the computational time and the proximity of each individual in the initial population to the optimal solution [23], [24]. If the initial individuals are closer to the optimal value, the population typically converges more quickly during the optimization process. To enhance this behavior, the proposed algorithm introduces two key improvements through the integration of the Cauchy OBL algorithm, further boosting convergence efficiency. - Using Cauchy to generate individuals from the initial individuals of the ABC algorithm. - Using Cauchy OBL to calculate the nearest food sources to the newly selected group of individuals. H.R. Tizhoosh initially suggested OBL in 2005. In OBL [25], 𝑥𝑖(𝑡) = (𝑥1, 𝑥2, …, 𝑥𝐷), reversed solution for each individual xi, use the following formula to calculate: 𝑥𝑖(𝑡) = 𝑥𝑖𝑑𝑚𝑎𝑥 + 𝑥𝑖𝑑𝑚𝑖𝑛 − 𝑥𝑖 (16) Cauchy reverse education between the individual range’s midpoint and reverse point—also known as the Cauchy reverse point—a point is produced at random [26], noted as 𝑥𝑖 𝑓 . 𝑥𝑖 𝑓 = 𝑟𝑎𝑛𝑑( 𝑥𝑖𝑑𝑚𝑎𝑥+𝑥𝑖𝑑𝑚𝑖𝑛 2 , 𝑥𝑖) (17) The following actions are taken to start the Cauchy OBL process: 1. To generate the first set of answers uniformly and randomly, use (12). 2. Use (16) and (17) to get this initial population’s Cauchy-inverse. After that, the original set and this inverse group are combined to create a whole new population. 3. Assess everyone’s fitness within this expanded population. Sort them according to their fitness scores in a descending manner. Choose the top half of this sorted group, which consists of the people who are more fit, to create the refined starting population for the other operations. The steps for implementing Cauchy reverse learning in the employed phase are as follows: 1. Apply (14) to conduct a neighborhood search, leading to the creation of potential solution candidates. 2. Generate the Cauchy inverse of these candidate solutions using (16) and (17). 3. Implement a greedy selection mechanism between the original and inverse candidate solutions. This process selects the most favorable solution, thereby enhancing the algorithm’s capability for global exploration and optimization. In the ABC algorithm combined with Cauchy OBL, candidate solutions are typically selected randomly from the initial population. However, in this study, the ABC-Cauchy OBL approach strategically selects the initial individuals, as illustrated in Figure 3. Figure 3. The original individual IABC’s structure](https://image.slidesharecdn.com/21id26129-251016060059-cbe165fe/75/Integrating-artificial-bee-colony-and-cauchy-algorithms-for-distribution-network-reconfiguration-with-soft-open-points-6-2048.jpg)
![TELKOMNIKA Telecommun Comput El Control Integrating artificial bee colony and cauchy algorithms for distribution network … (Nguyen Tung Linh) 1075 This selection process involves two distinct components: integer control variables representing the rervice restoration problem, and real-valued control variables corresponding to the SOP size constraints. We address each part of this structure independently to avoid selecting non-discrete numbers that fall outside the permissible range when updating the designated stream locations. In this architecture, every constituent element including network reconfiguration, active and reactive power injection through SOP, and SOP positioning employs distinct crossover and mutation mechanisms to enable the creation of innovative solutions. 2.3.3. Multidimensional update In the multidimensional phase of the ABC algorithm, the standard single-dimensional position update is typically applied. This research incorporates a multi-dimensional update mechanism within the improved ABC (IABC) algorithm. Rather than relying on the traditional single-dimensional update process, the IABC algorithm adopts a multi-dimensional position update strategy, leveraging the integration of the Cauchy OBL algorithm [23], [24]. To accelerate the convergence speed by utilizing the improvements of the Cauchy OBL algorithm to find better solutions, (14) in the basic ABC algorithm is replaced by (18): 𝑣𝑖𝑑 = { 𝑥𝑖𝑑 + 𝑟𝑖𝑑(𝑥𝑖𝑑 − 𝑥𝑞𝑑) + 𝑐𝑙(𝑔𝑑 − 𝑥𝑖𝑑) 𝑖𝑓 𝑟𝑎𝑛𝑑 < 𝐶𝑅, 𝑑 = 𝑑𝑚𝑎𝑥 𝑥𝑖𝑑 𝑖𝑓 𝑜𝑡ℎ𝑒𝑟𝑤𝑖𝑠𝑒 (18) In this model, the term cl is part of the set parameters and is referred to as the balance operator. This operator is crucial for achieving equilibrium between the exploration and exploitation capabilities during the search for candidate solutions. In the context of this study, the balance operator’s value is set at 2. Additionally, CR represents the probability of selection, with its value ranging between 0 and 1. In this specific case, CR is assigned a value of 0.3. Furthermore, gd denotes the global optimum of the d dimension across all currently explored solutions. The proposed algorithm is presented in Figure 4. Figure 4. Flowchart proposed improved ABC (IABC) algorithm](https://image.slidesharecdn.com/21id26129-251016060059-cbe165fe/75/Integrating-artificial-bee-colony-and-cauchy-algorithms-for-distribution-network-reconfiguration-with-soft-open-points-7-2048.jpg)
![ ISSN: 1693-6930 TELKOMNIKA Telecommun Comput El Control, Vol. 23, No. 4, August 2025: 1069-1083 1076 3. RESULTS AND DISCUSSION This research implements an enhanced ladder-iterative power flow methodology [25], [27] to analyze the performance of the introduced cost function (6) operational constraints, and system characteristics subsequent to SR and the incorporation of SOPs. The simulations were performed using MATLAB 2019R on a computing system equipped with a 240W power supply unit (PSU), an Intel Core i7 3770 processor, 16 GB of RAM, and a GeForce GT 1030 graphics processing unit. The efficacy of the proposed approach was assessed across eight distinct scenarios. The proposed Improved ABC algorithm is applied to two standard distribution networks: the IEEE 33-node and 69-node systems. This work investigates the operational benefits of IABC in addressing SR and optimizing SOP placement across eight scenarios [28]–[31]. Each scenario explores different combinations concerning the practical implementation of tie and sectionalizing switches solutions for SR and SOP integration. While the study allows for the installation of up to two SOPs, the proposed method is scalable and can accommodate any number of SOPs. To demonstrate the superiority of IABC, simulation results for Case 7 are compared with those obtained using the ABC and Cauchy Algorithms, highlighting IABC’s ability to enhance voltage profiles and reduce system losses. The IABC algorithm is configured with an initial population size of 80 and a maximum iteration limit of 300, which are consistently applied across all scenarios. − Base case: power flow simulation conducted in the absence of SOPs or SR deployment. − Case 1: an optimal scenario leveraging maximum solar radiation efficiency, excluding the integration of SOPs. − Case 2: a single idealized implementation of a SOP without employing SR. − Case 3: a singular optimal deployment of a SOP exclusively at tie switches, without incorporating SR. − Case 4: two optimally positioned SOP installations, independent of SR. − Case 5: two optimal SOP installations feasible solely at tie switches, without the application of SR. − Case 6: concurrent execution of an optimized SR alongside a single SOP installation, utilizing the proposed methodology. − Case 7: implementation of optimal simultaneous SR and two SOP installations using the provided technique. This section elucidates the methodology and showcases the most effective modeling results obtained for the IEEE 33-Node and 69-Node test cases. 3.1. Results from the IEEE 33-node simulation The IEEE 33-bus test system is initially set up with 33 nodes, 37 branches, 32 sectionalizing switches that are typically closed, and 5 tie switches (T33 to T37) that are normally open, functioning at a base voltage of 12.6 kV (or 1 p.u.), as shown in Figure 5. The system exhibits a base active power loss of 202.67 kW, with total real and reactive power loads of 3.72 MW and 2.3 MVAR, respectively [31], [32]. The voltage magnitude at all buses is constrained within the range of 0.95 to 1.05 p.u., while the active and reactive power injection limits for the SOPs are defined within the range of 0 to 2.5 MW and 0 to 2.5 MVAR. Figure 5. Optimal system reconfiguration and SOP placement in the IEEE 33-node test system The effectiveness of the IABC method in addressing SOP placement and system reconfiguration problems is demonstrated through seven different cases, as listed in Table 1 for the IEEE – 33 node.](https://image.slidesharecdn.com/21id26129-251016060059-cbe165fe/75/Integrating-artificial-bee-colony-and-cauchy-algorithms-for-distribution-network-reconfiguration-with-soft-open-points-8-2048.jpg)
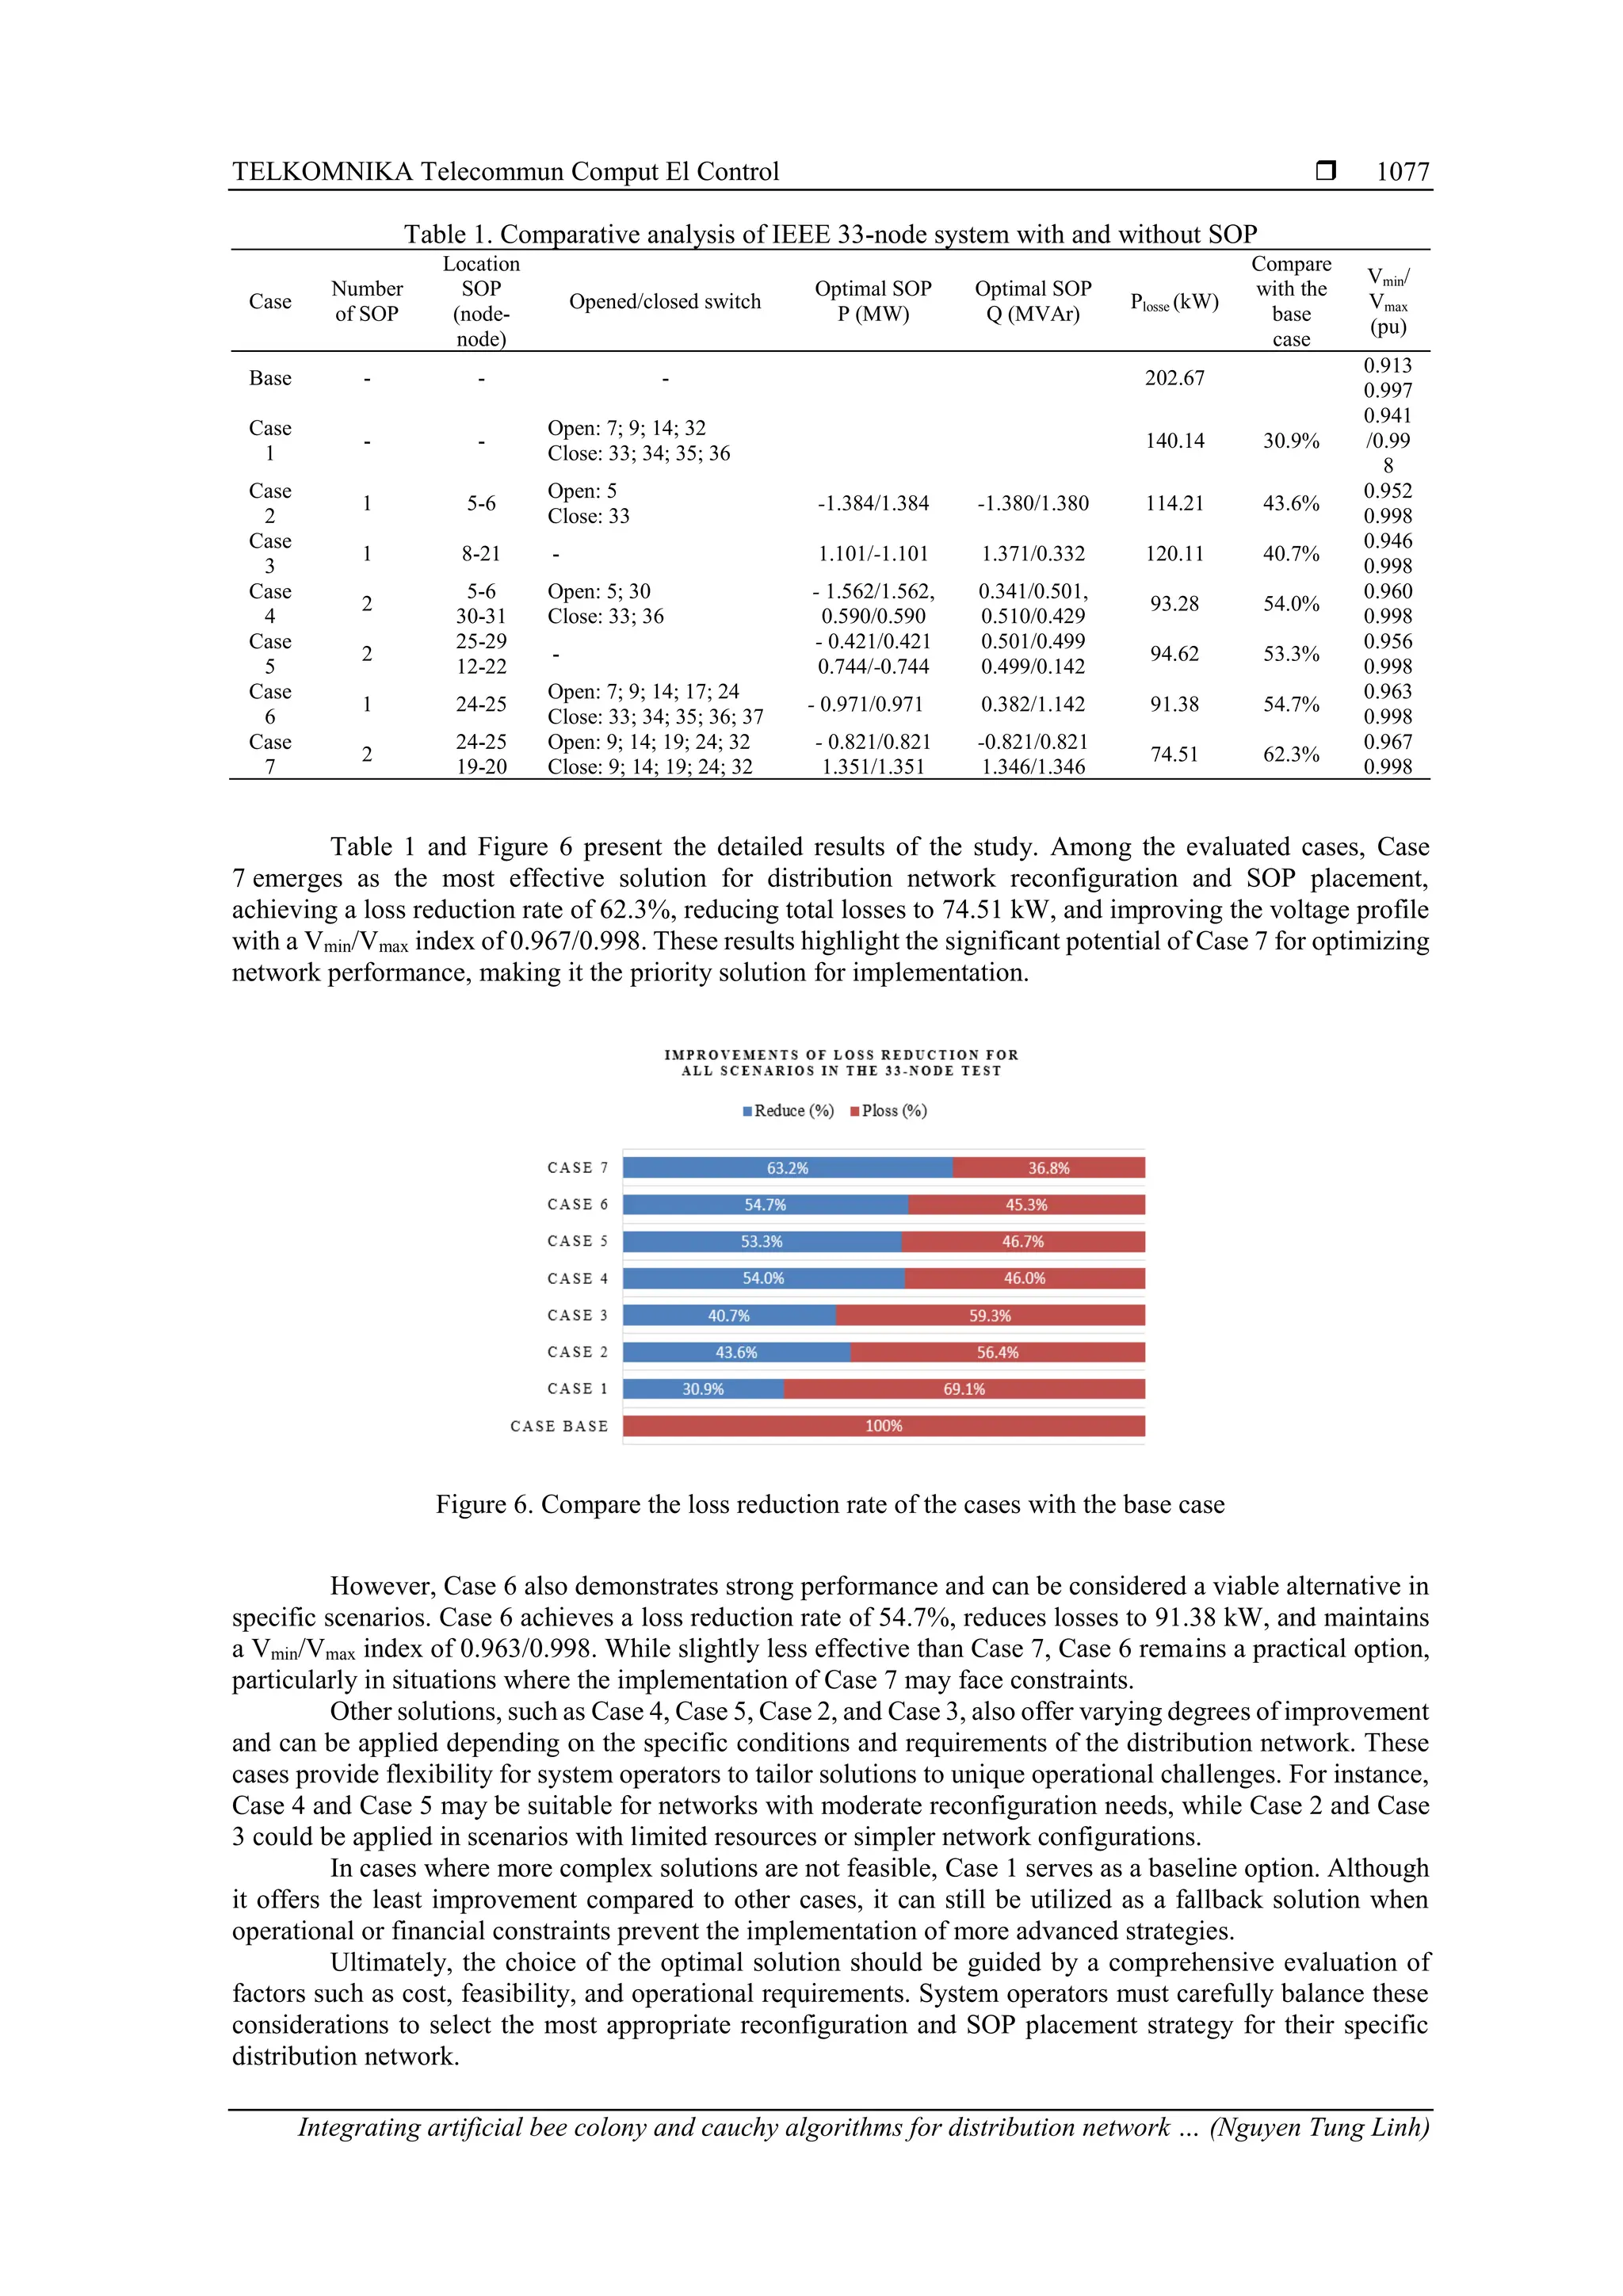
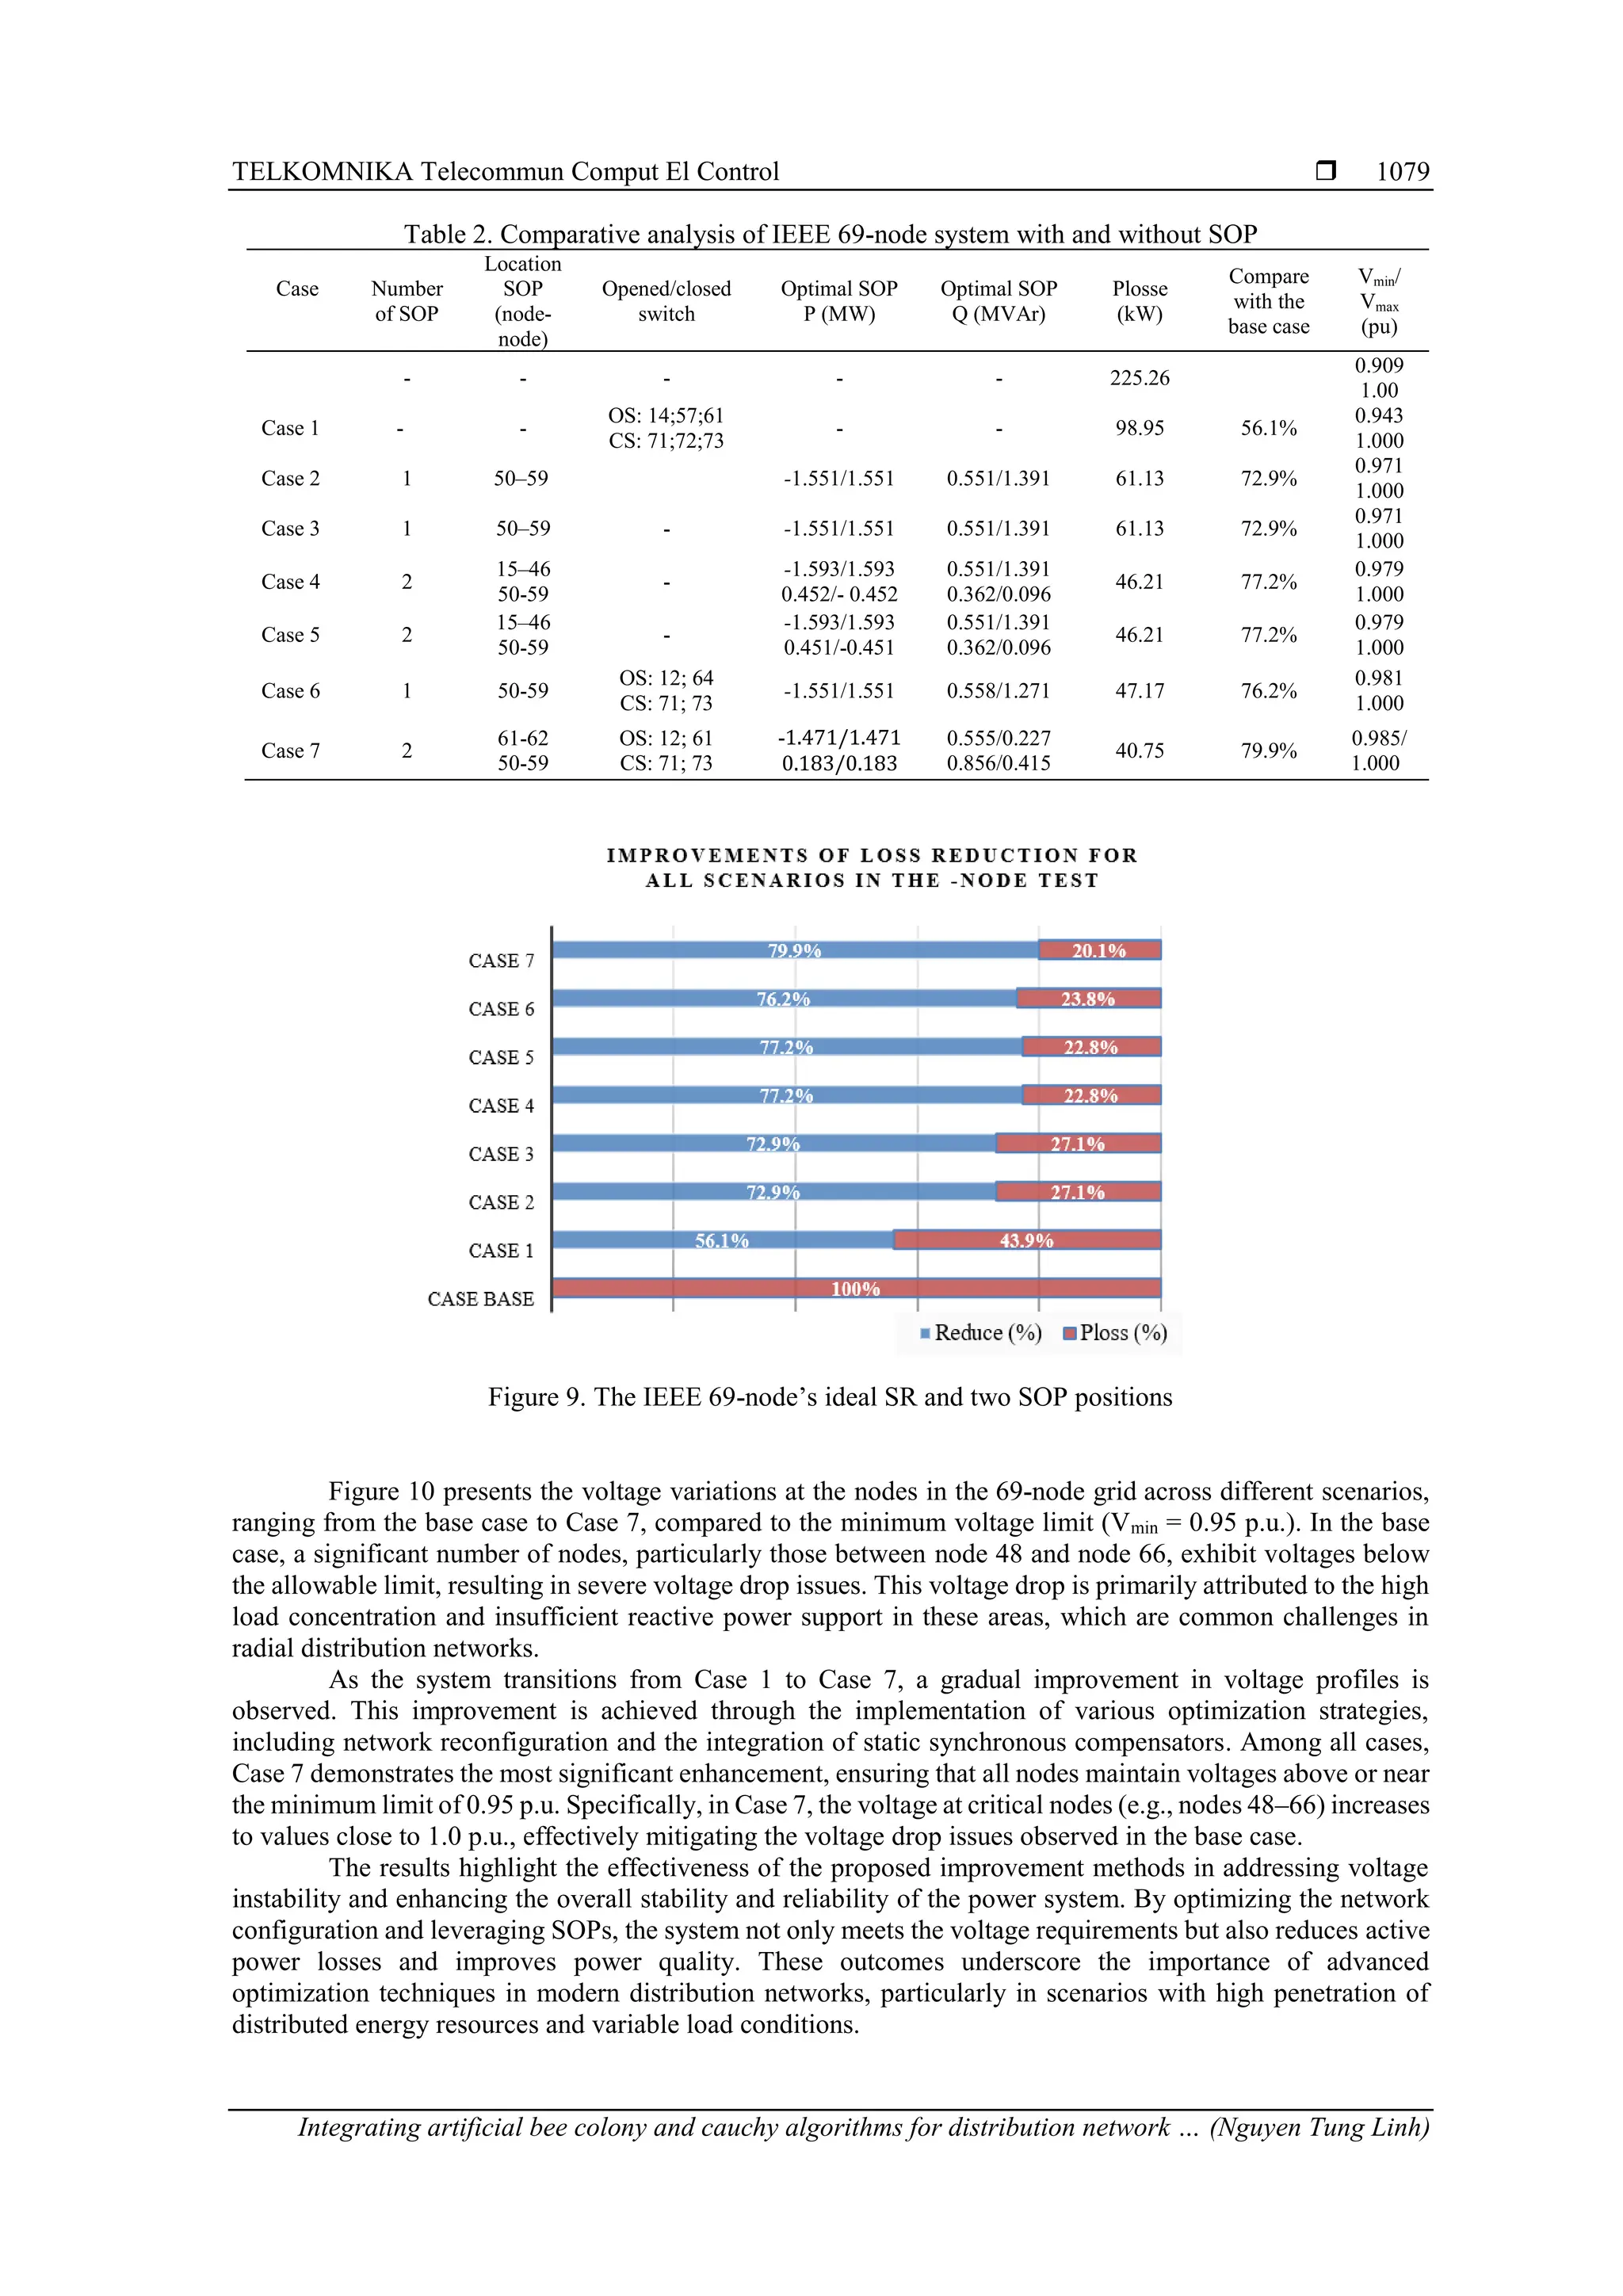
![ ISSN: 1693-6930 TELKOMNIKA Telecommun Comput El Control, Vol. 23, No. 4, August 2025: 1069-1083 1078 Figure 7 presents the voltage variations at the nodes in the 33-node grid across different scenarios, from Case Base to Case 7, compared to the lower voltage limit (Vmin = 0.95). In Case Base, some nodes (particularly from 19 to 23) have voltages below the limit, indicating voltage drop issues. However, from Case 1 to Case 7, the improvement measures gradually raise the voltage levels, with Case 7 achieving the best results, ensuring that most nodes have voltages above the minimum limit. This demonstrates that the improvement methods have significantly mitigated the voltage drop issues in the system. Figure 7. Voltage characteristic graph of nodes in different cases – 33 Nodes 3.2. Results from the IEEE 69-node simulation The IEEE 69-bus test system is initially configured with 69 nodes, 73 branches, 68 sectionalizing switches that are normally closed, and 5 tie switches (T69 to T73) that are normally open, operating at a base voltage of 12.6 kV (or 1 p.u.), as depicted in Figure 8 [29], [30]. The system accommodates a total active power load of 3.80 MW and a reactive power load of 2.70 MVAR, with an initial active power loss of 224.69 kW. The operational constraints for the SOPs include active and reactive power injection limits of 0 to 2.5 MW and 0 to 2.5 MVAR, respectively. Furthermore, the voltage magnitude at each bus is regulated within the permissible range of 0.95 to 1.05 p.u. The Table 2 and Figure 9 present the results obtained, Case 7 should be considered a priority for implementing distribution network reconfiguration and SOP placement (79.9% loss reduction, losses reduced to 40.75 kW, Vmin/Vmax of 0.985/1.000). Case 4 and Case 5 are also highly effective (both with 77.2% loss reduction, losses reduced to 46.21 kW, Vmin/Vmax of 0.979/1.000). Case 6 is a good option (76.2% loss reduction, losses reduced to 47.17 kW, Vmin/Vmax of 0.981/1.000). Cases 2 and 3 offer significant loss reduction (both 72.9%, losses reduced to 61.13 kW, Vmin/Vmax of 0.971/1.000). Case 1, with a 56.1% loss reduction, losses reduced to 98.95 kW, and Vmin/Vmax of 0.943/1.000, can be used when more complex solutions are not feasible. The choice of the optimal solution should consider factors such as cost, feasibility, and operational requirements of the distribution network. Figure 8. Optimal system reconfiguration and SOP placement in the IEEE 69-node test system](https://image.slidesharecdn.com/21id26129-251016060059-cbe165fe/75/Integrating-artificial-bee-colony-and-cauchy-algorithms-for-distribution-network-reconfiguration-with-soft-open-points-10-2048.jpg)
![ ISSN: 1693-6930 TELKOMNIKA Telecommun Comput El Control, Vol. 23, No. 4, August 2025: 1069-1083 1080 Figure 10. Voltage characteristic graph of nodes in different cases – 69 nodes 3.3. Compare IABC algorithm with other algorithms Table 3 summarizes the results of the proposed IABC algorithm’s comparison with the GA and WCA algorithms for Case 6, in the IEEE 33 node and 69 node distribution network, the IABC method demonstrates the best performance with the lowest power loss (91.31 kW) and the fewest iterations (117), while maintaining a stable Vmin/Vmax index (0.963/0.998). Compared to GA (93.02 kW, 172 iterations) and WCA (92.24 kW, 122 iterations), IABC is superior in reducing losses and convergence speed. Similarly, in the 69-node network, IABC has the lowest power loss (47.17 kW) and the fewest iterations (79), with a Vmin/Vmax index of 0.981/1.000. WCA is also effective but not as much as IABC (47.89 kW, 81 iterations), while GA has higher losses and more iterations (49.66 kW, 204 iterations). IABC proves its ability to reduce losses and improve computational speed compared to other methods. Table 3. Comparative analysis of case 6 results for IEEE 33- and 69-node distribution networks Method Location SOP (node-node) Opened closed Plosse (kW) Number of iterations Vmin/ Vmax (pu) Compared result case 6 for distribution network – IEEE 33 nodes GA [25] 24-25 Oen: 17;24; 7; 9;14 Close 33;34;35;36;37 93.02 172 0.963 0.998 WCA [33] 24-25 Oen: 17;24; 7; 9;14 Close 33;34;35;36;37 92.24 122 0.963 0.998 IABC 24-25 Oen: 17;24; 7; 9;14 Close 33;34;35;36;37 91.31 117 0.963 0.998 Compared result case 6 for distribution network – IEEE 69 nodes GA [25] 50-59 Open: 12; 64 Close: 71; 73 49.66 204 0.982 1.000 WCA [33] 50-59 Open: 12; 64 Close: 71; 73 47.89 81 0.981 1.000 IABC 50-59 Open: 12; 61 Close: 71; 73 47.17 79 0.981 1.000 4. CONCLUSION This paper proposes a method to determine the optimal location and capacity of SOPs in the multi- objective DRN problem, based on a combination of the ABC with Cauchy OBL. The objective function aims to reduce power losses and improve voltage quality. The proposed algorithm is applied to the IEEE 33-node and 69-node distribution networks. The results of simulations, carried out under eight distinct scenarios, reveal varying levels of loss reduction and voltage enhancement, influenced by the positioning and capacity of the SOPs. For the 33-node network, scenario 7 is identified as the optimal case, achieving a loss reduction rate of 62.3% and voltage improvement (Vmin/Vmax of 0.967/0.998). Similarly, for the 69-node network, scenario 7 is also found to be optimal, with a loss reduction rate of 79.9% and voltage improvement (Vmin/Vmax of 0.985/1.000). Comparative analysis with the GA and water cycle algorithm (WCA) shows that the Improved](https://image.slidesharecdn.com/21id26129-251016060059-cbe165fe/75/Integrating-artificial-bee-colony-and-cauchy-algorithms-for-distribution-network-reconfiguration-with-soft-open-points-12-2048.jpg)
![TELKOMNIKA Telecommun Comput El Control Integrating artificial bee colony and cauchy algorithms for distribution network … (Nguyen Tung Linh) 1081 ABC method requires fewer iterations to achieve convergence. These consistent results highlight the effectiveness of the IABC-based method in determining the optimal location and capacity of SOPs for distribution network reconfiguration, with the primary goal of reducing power losses. The findings of this paper can serve as a valuable reference to support decision-making in various operational scenarios. This study demonstrates that combining the strengths of artificial intelligence algorithms can significantly improve computational efficiency for multi-objective problems and large solution spaces. Future research could expand on this work by incorporating additional objectives, such as system reliability, power supply costs, or considering uncertainties related to distributed generation (e.g., photovoltaic and wind turbine and electric vehicle loads. FUNDING INFORMATION This research did not receive any specific grant from funding agencies in the public, commercial, or not-for-profit sectors. AUTHOR CONTRIBUTIONS STATEMENT This journal uses the Contributor Roles Taxonomy (CRediT) to recognize individual author contributions, reduce authorship disputes, and facilitate collaboration. Name of Author C M So Va Fo I R D O E Vi Su P Fu Nguyen Tung Linh ✓ ✓ ✓ ✓ ✓ ✓ ✓ ✓ ✓ ✓ ✓ Nguyen Quynh Anh ✓ ✓ ✓ ✓ ✓ ✓ C : Conceptualization M : Methodology So : Software Va : Validation Fo : Formal analysis I : Investigation R : Resources D : Data Curation O : Writing - Original Draft E : Writing - Review & Editing Vi : Visualization Su : Supervision P : Project administration Fu : Funding acquisition CONFLICT OF INTEREST STATEMENT The authors declare that they have no known competing financial interests or personal relationships that could have appeared to influence the work reported in this paper. INFORMED CONSENT We have obtained informed consent from all individuals included in this study. DATA AVAILABILITY The data that support the findings of this study are openly available in [R. D. Zimmerman et al., “MATPOWER: Steady-State Operations, Planning, and Analysis Tools for Power Systems Research and Education,” IEEE Transactions on Power Systems, vol. 26, no. 1, pp. 12-19, Feb. 2011, doi: 10.1109/TPWRS.2010.2051168]. Moreover, the sample grid data employed are from open-source repositories and have been widely adopted in several previous studies, including those in references [31] and [32]. REFERENCES [1] X. Wang et al., “Optimal voltage regulation for distribution networks with multi-microgrids,” Applied Energy, vol. 210, pp. 1027– 1036, Jan. 2018, doi: 10.1016/j.apenergy.2017.08.113. [2] A. El-Fergany, “Optimal allocation of multi-type distributed generators using backtracking search optimization algorithm,” International Journal of Electrical Power & Energy Systems, vol. 64, pp. 1197–1205, Jan. 2015, doi: 10.1016/j.ijepes.2014.09.020. [3] A. R. Al-Ali, A. A. Al-Rashidi, và M. F. Al-Hajri, “A Hybrid Algorithm of Particle Swarm Optimization and Tabu Search for Optimal Distribution Network Reconfiguration,” The Scientific World Journal, vol. 2016, Art. no. 7410293, 2016, doi: 10.1155/2016/7410293. [4] N. T. Linh, T. T. Chuong, and T. V. Anh, “A study on the effect of distributed generation on the reconfiguration of distribution networks,” Journal of Electrical Engineering and Technology, vol. 12, no. 4, pp. 1435–1441, 2017. https://doi.org/10.5370/JEET.2017.12.4.1435 [5] M. A. Hossain, A. Mohammad, and D. Z. K. Hossain, “A review on renewable energy sources and their application in power systems,” Renewable and Sustainable Energy Reviews, vol. 80, pp. 136–156, 2017. [6] H. Morais, Z. Vale, J. Soares, và T. Sousa, “Integration of Renewable Energy in Smart Grid,” in Applications of Modern Heuristic](https://image.slidesharecdn.com/21id26129-251016060059-cbe165fe/75/Integrating-artificial-bee-colony-and-cauchy-algorithms-for-distribution-network-reconfiguration-with-soft-open-points-13-2048.jpg)
![ ISSN: 1693-6930 TELKOMNIKA Telecommun Comput El Control, Vol. 23, No. 4, August 2025: 1069-1083 1082 Optimization Methods in Power and Energy Systems, Wiley, 2020, pp. 613–773, doi: 10.1002/9781119602286.ch6 [7] W. Cao, J. Wu, N. Jenkins, C. Wang, and T. Green, “Operating principle of soft open points for electrical distribution network operation,” Applied Energy, vol. 164, pp. 245–257, Feb. 2016, doi: 10.1016/j.apenergy.2015.12.005. [8] J. Zhao, M. Yao, H. Yu, G. Song, H. Ji, and P. Li, “Decentralized voltage control strategy of soft open points in active distribution networks based on sensitivity analysis,” Electronics, vol. 9, no. 2, Feb. 2020, doi: 10.3390/electronics9020295. [9] P. Cong, Z. Hu, W. Tang, C. Lou, and L. Zhang, “Optimal allocation of soft open points in active distribution network with high penetration of renewable energy generations,” IET Generation, Transmission & Distribution, vol. 14, no. 26, pp. 6732–6740, Dec. 2020, doi: 10.1049/iet-gtd.2020.0704. [10] A. Farzamnia, S. Marjani, S. Galvani, and K. T. T. Kin, “Optimal allocation of soft open point devices in renewable energy integrated distribution systems,” IEEE Access, vol. 10, pp. 9309–9320, 2022, doi: 10.1109/ACCESS.2022.3144349. [11] P. Cong, Z. Hu, W. Tang, and C. Lou, “Optimal allocation of soft open points in distribution networks based on candidate location opitimization,” in 8th Renewable Power Generation Conference (RPG 2019), 2019, pp. 13 (6 pp.)-13 (6 pp.). doi: 10.1049/cp.2019.0270. [12] Q. Qin, B. Han, G. Li, K. Wang, J. Xu, and L. Luo, “Capacity allocations of SOPs considering distribution network resilience through elastic models,” International Journal of Electrical Power & Energy Systems, vol. 134, Jan. 2022, doi: 10.1016/j.ijepes.2021.107371. [13] M. O. Khan, A. Wadood, M. I. Abid, T. Khurshaid, and S. B. Rhee, “Minimization of network power losses in the AC-DC hybrid distribution network through network reconfiguration using soft open point,” Electronics, vol. 10, no. 3, Feb. 2021, doi: 10.3390/electronics10030326. [14] Z. M. Ali, I. M. Diaaeldin, A. El-Rafei, H. M. Hasanien, S. H. E. A. Aleem, and A. Y. Abdelaziz, “A novel distributed generation planning algorithm via graphically-based network reconfiguration and soft open points placement using Archimedes optimization algorithm,” Ain Shams Engineering Journal, vol. 12, no. 2, pp. 1923–1941, Jun. 2021, doi: 10.1016/j.asej.2020.12.006. [15] I. Diaaeldin, S. A. Aleem, A. El-Rafei, A. Abdelaziz, and A. F. Zobaa, “Optimal network reconfiguration in active distribution networks with soft open points and distributed generation,” Energies, vol. 12, no. 21, Nov. 2019, doi: 10.3390/en12214172. [16] I. M. Diaaeldin, S. H. E. A. Aleem, A. El-Rafei, A. Y. Abdelaziz, and A. F. Zobaa, “Enhancement of hosting capacity with soft open points and distribution system reconfiguration: Multi-objective bilevel stochastic optimization,” Energies, vol. 13, no. 20, Oct. 2020, doi: 10.3390/en13205446. [17] M. B. Shafik, G. I. Rashed, H. Chen, M. R. Elkadeem, and S. Wang, “Reconfiguration strategy for active distribution networks with soft open points,” in 2019 14th IEEE Conference on Industrial Electronics and Applications (ICIEA), Jun. 2019, pp. 330–334. doi: 10.1109/ICIEA.2019.8833865. [18] S. Ibrahim, S. Alwash, and A. Aldhahab, “Optimal network reconfiguration and DG integration in power distribution systems using enhanced water cycle algorithm,” International Journal of Intelligent Engineering and Systems, vol. 13, no. 1, pp. 379–389, Feb. 2020, doi: 10.22266/ijies2020.0229.35. [19] M. E. Baran and F. F. Wu, “Network reconfiguration in distribution systems for loss reduction and load balancing,” IEEE Transactions on Power Delivery, vol. 4, no. 2, pp. 1401–1407, Apr. 1989, doi: 10.1109/61.25627. [20] K. S. Fuad, H. Hafezi, K. Kauhaniemi, and H. Laaksonen, “Soft open point in distribution networks,” IEEE Access, vol. 8, pp. 210550–210565, 2020, doi: 10.1109/ACCESS.2020.3039552. [21] N. Linh, “Optimal location and size of distributed generation in distribution system by artificial bees colony algorithm,” International Journal of Information and Electronics Engineering, vol. 3, no. 1, pp. 63–67, 2013, doi: 10.7763/IJIEE.2013.V3.267. [22] D. Karaboga, An Idea Based on Honey Bee Swarm for Numerical Optimization, Technical Report TR06, Department of Computer Engineering, Erciyes University, Kayseri, Turkey, 2005. https://abc.erciyes.edu.tr/pub/tr06_2005.pdf [23] X. Chen, X. Wei, G. Yang, and W. Du, “Fireworks explosion based artificial bee colony for numerical optimization,” Knowledge- Based Systems, vol. 188, Jan. 2020, doi: 10.1016/j.knosys.2019.105002. [24] N. Sharma, H. Sharma, and A. Sharma, “Beer froth artificial bee colony algorithm for job-shop scheduling problem,” Applied Soft Computing, vol. 68, pp. 507–524, Jul. 2018, doi: 10.1016/j.asoc.2018.04.001. [25] W. Xiang, Y. Li, R. He, M. Gao, and M. An, “A novel artificial bee colony algorithm based on the cosine similarity,” Computers & Industrial Engineering, vol. 115, pp. 54–68, Jan. 2018, doi: 10.1016/j.cie.2017.10.022. [26] K. E. Fahim, L. C. De Silva, V. Andiappan, S. A. Shezan, H. Yassin, và J. Shi, “A Novel Hybrid Algorithm for Solving Economic Load Dispatch in Power Systems,” International Journal of Energy Research, vol. 2024, Art. no. 8420107, 2024, doi: 10.1155/2024/8420107. [27] D. R. Ivic and P. C. Stefanov, “An extended control strategy for weakly meshed distribution networks with soft open points and distributed generation,” IEEE Access, vol. 9, pp. 137886–137901, 2021, doi: 10.1109/ACCESS.2021.3116982. [28] P. Li et al., “Combined decentralized and local voltage control strategy of soft open points in active distribution networks,” Applied Energy, vol. 241, pp. 613–624, May 2019, doi: 10.1016/j.apenergy.2019.03.031. [29] P. Cong, W. Tang, C. Lou, B. Zhang, and X. Zhang, “Multi‐stage coordination optimisation control in hybrid AC/DC distribution network with high‐penetration renewables based on SOP and VSC,” The Journal of Engineering, vol. 2019, no. 16, pp. 2725–2731, Mar. 2019, doi: 10.1049/joe.2018.8527. [30] J. Zhu, Y. Yuan, and W. Wang, “Multi-stage active management of renewable-rich power distribution network to promote the renewable energy consumption and mitigate the system uncertainty,” International Journal of Electrical Power & Energy Systems, vol. 111, pp. 436–446, Oct. 2019, doi: 10.1016/j.ijepes.2019.04.028. [31] H. Ji, H. Yu, G. Song, P. Li, C. Wang, and J. Wu, “A decentralized voltage control strategy of soft open points in active distribution networks,” Energy Procedia, vol. 159, pp. 412–417, Feb. 2019, doi: 10.1016/j.egypro.2018.12.067. [32] C. K. Das, O. Bass, G. Kothapalli, T. S. Mahmoud, and D. Habibi, “Overview of energy storage systems in distribution networks: Placement, sizing, operation, and power quality,” Renewable and Sustainable Energy Reviews, vol. 91, pp. 1205–1230, Aug. 2018, doi: 10.1016/j.rser.2018.03.068. [33] C. S. Lai, Y. Jia, L. L. Lai, Z. Xu, M. D. McCulloch, and K. P. Wong, “A comprehensive review on large-scale photovoltaic system with applications of electrical energy storage,” Renewable and Sustainable Energy Reviews, vol. 78, pp. 439–451, Oct. 2017, doi: 10.1016/j.rser.2017.04.078.](https://image.slidesharecdn.com/21id26129-251016060059-cbe165fe/75/Integrating-artificial-bee-colony-and-cauchy-algorithms-for-distribution-network-reconfiguration-with-soft-open-points-14-2048.jpg)