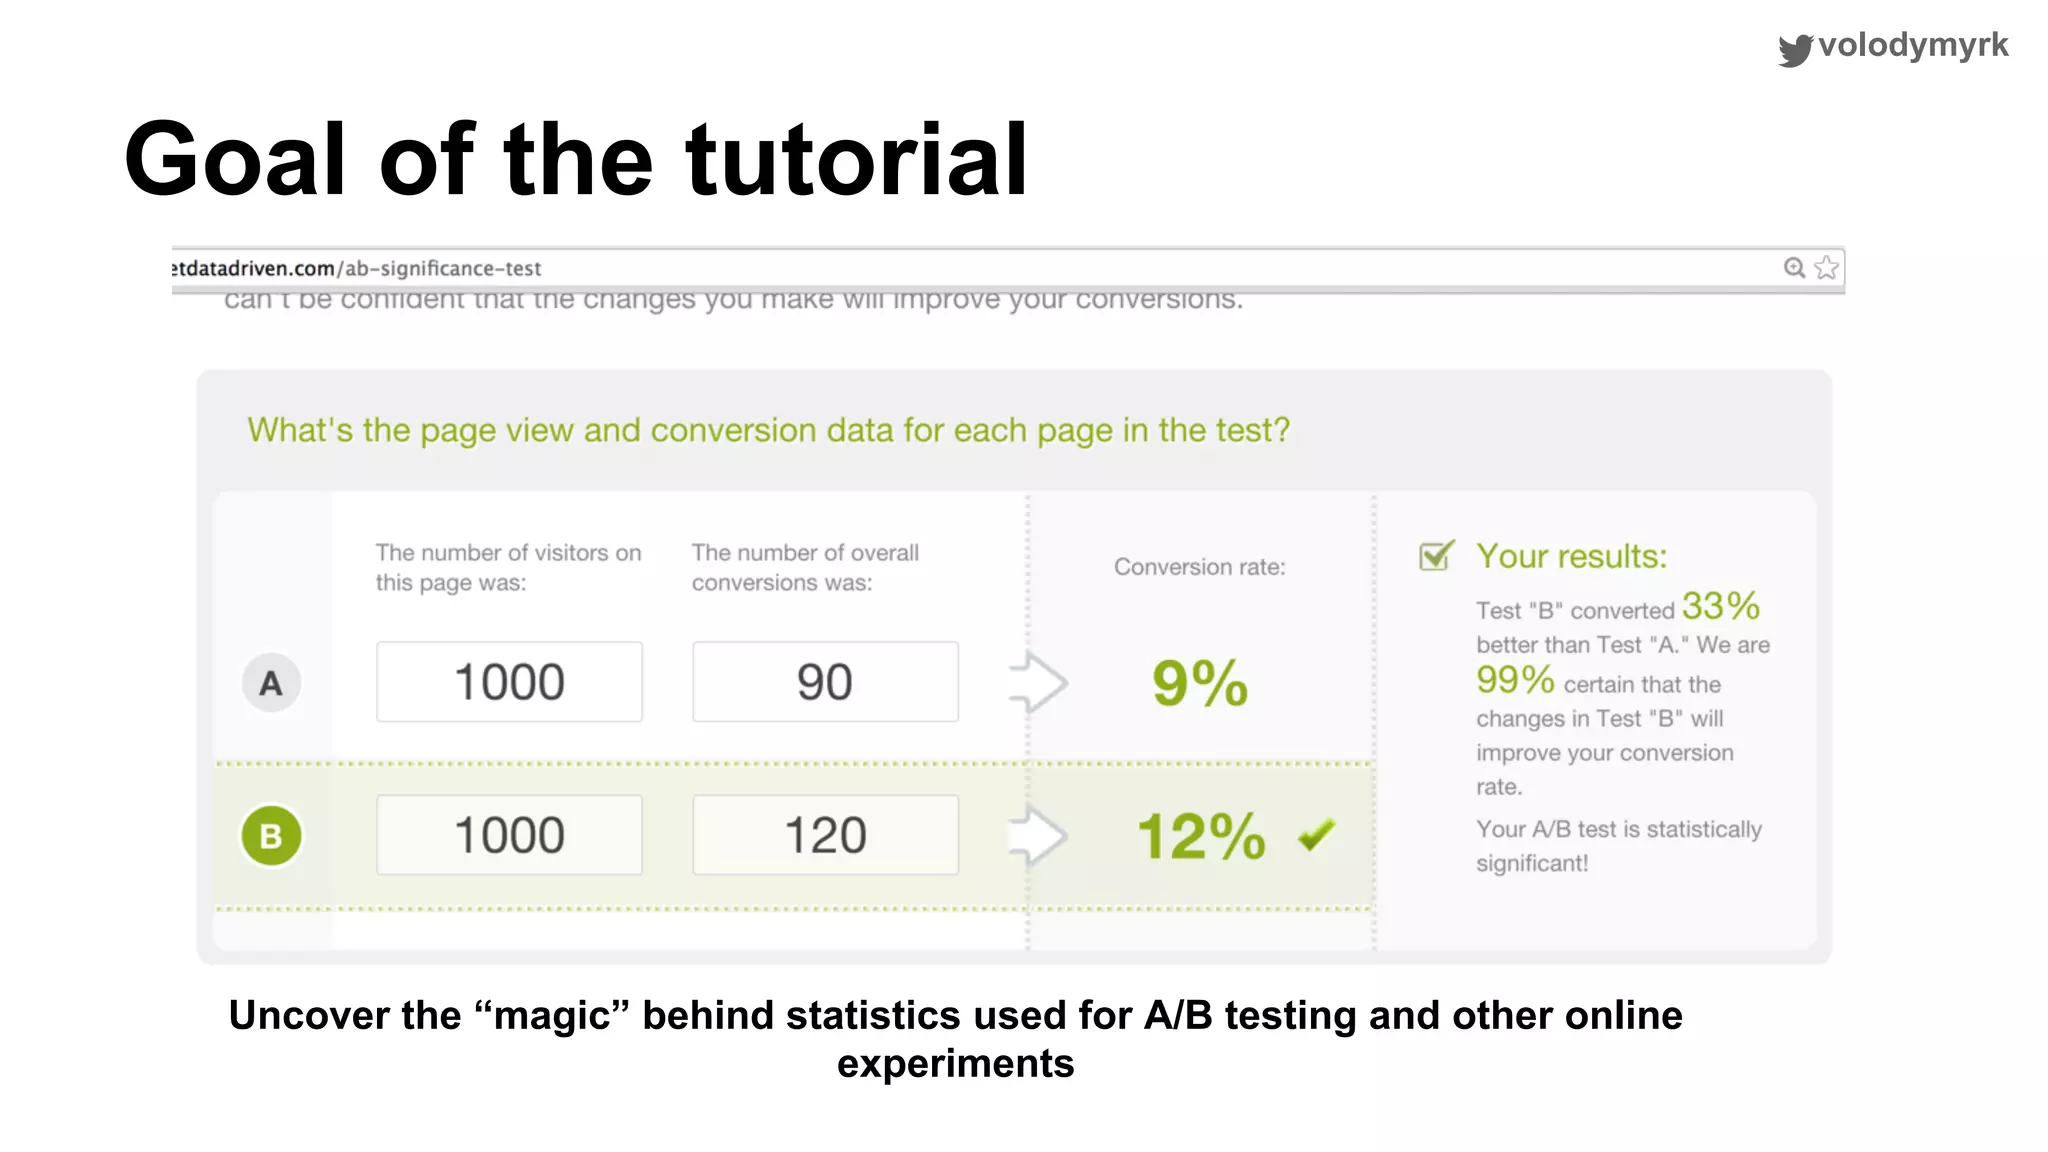
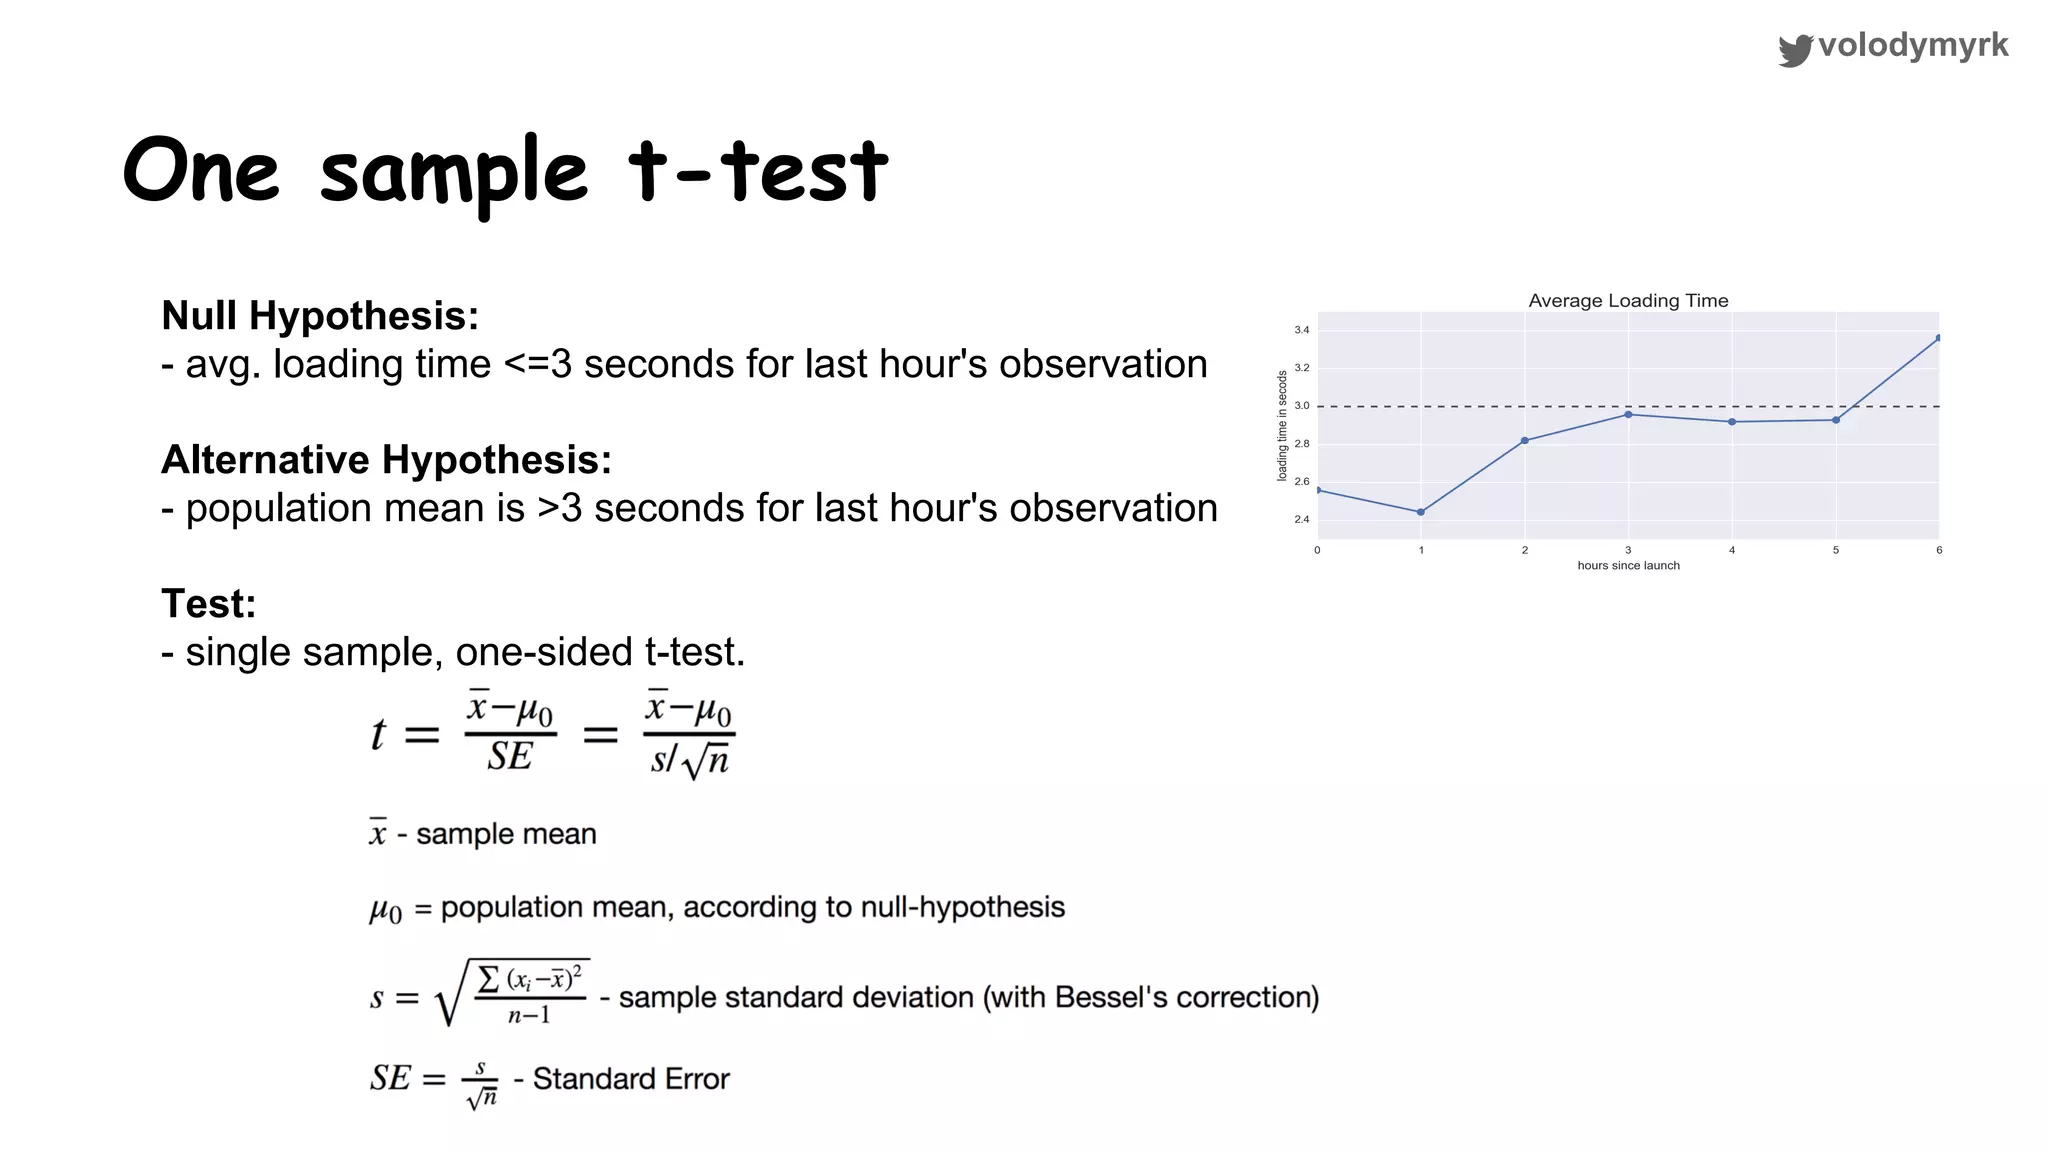
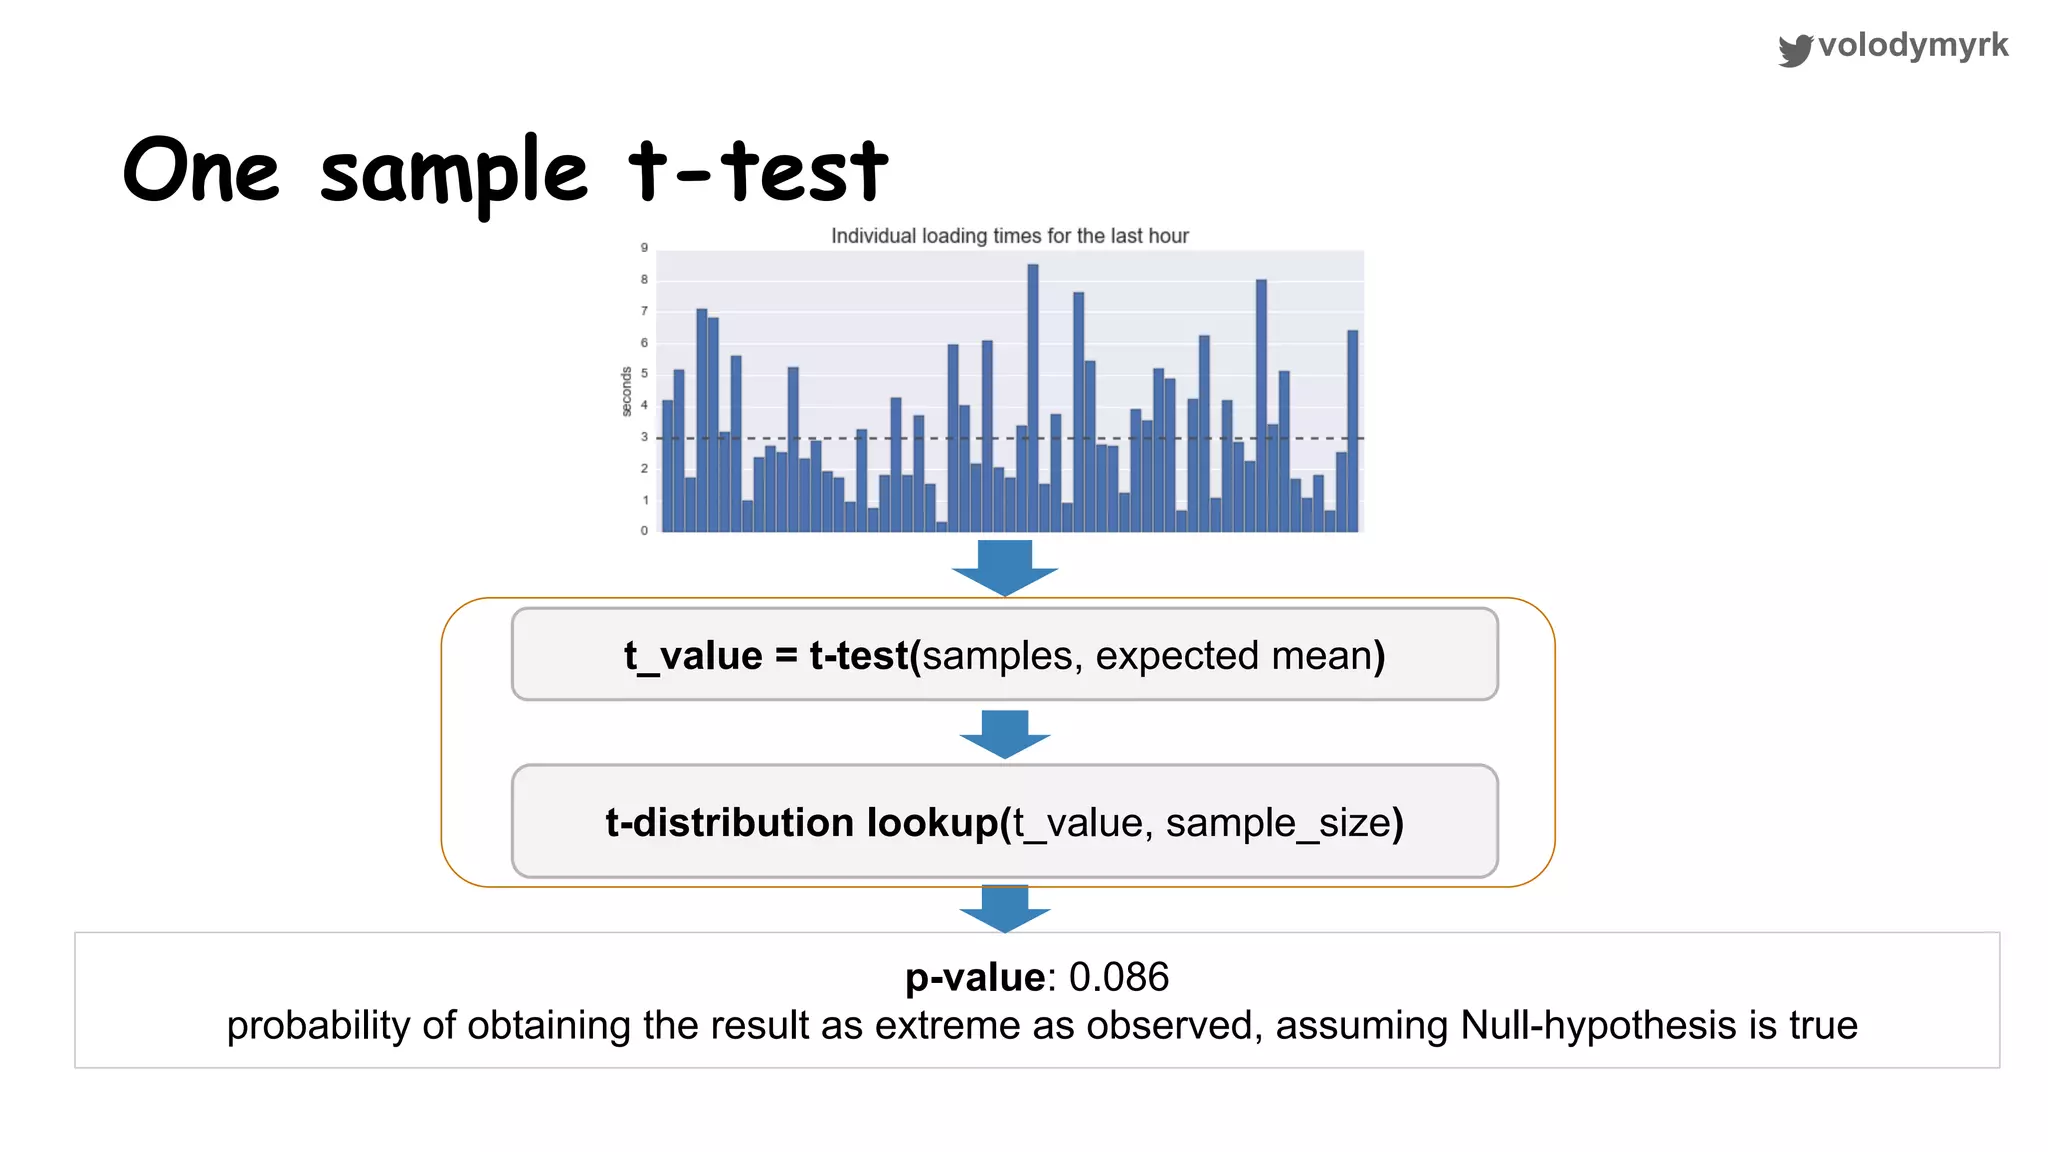
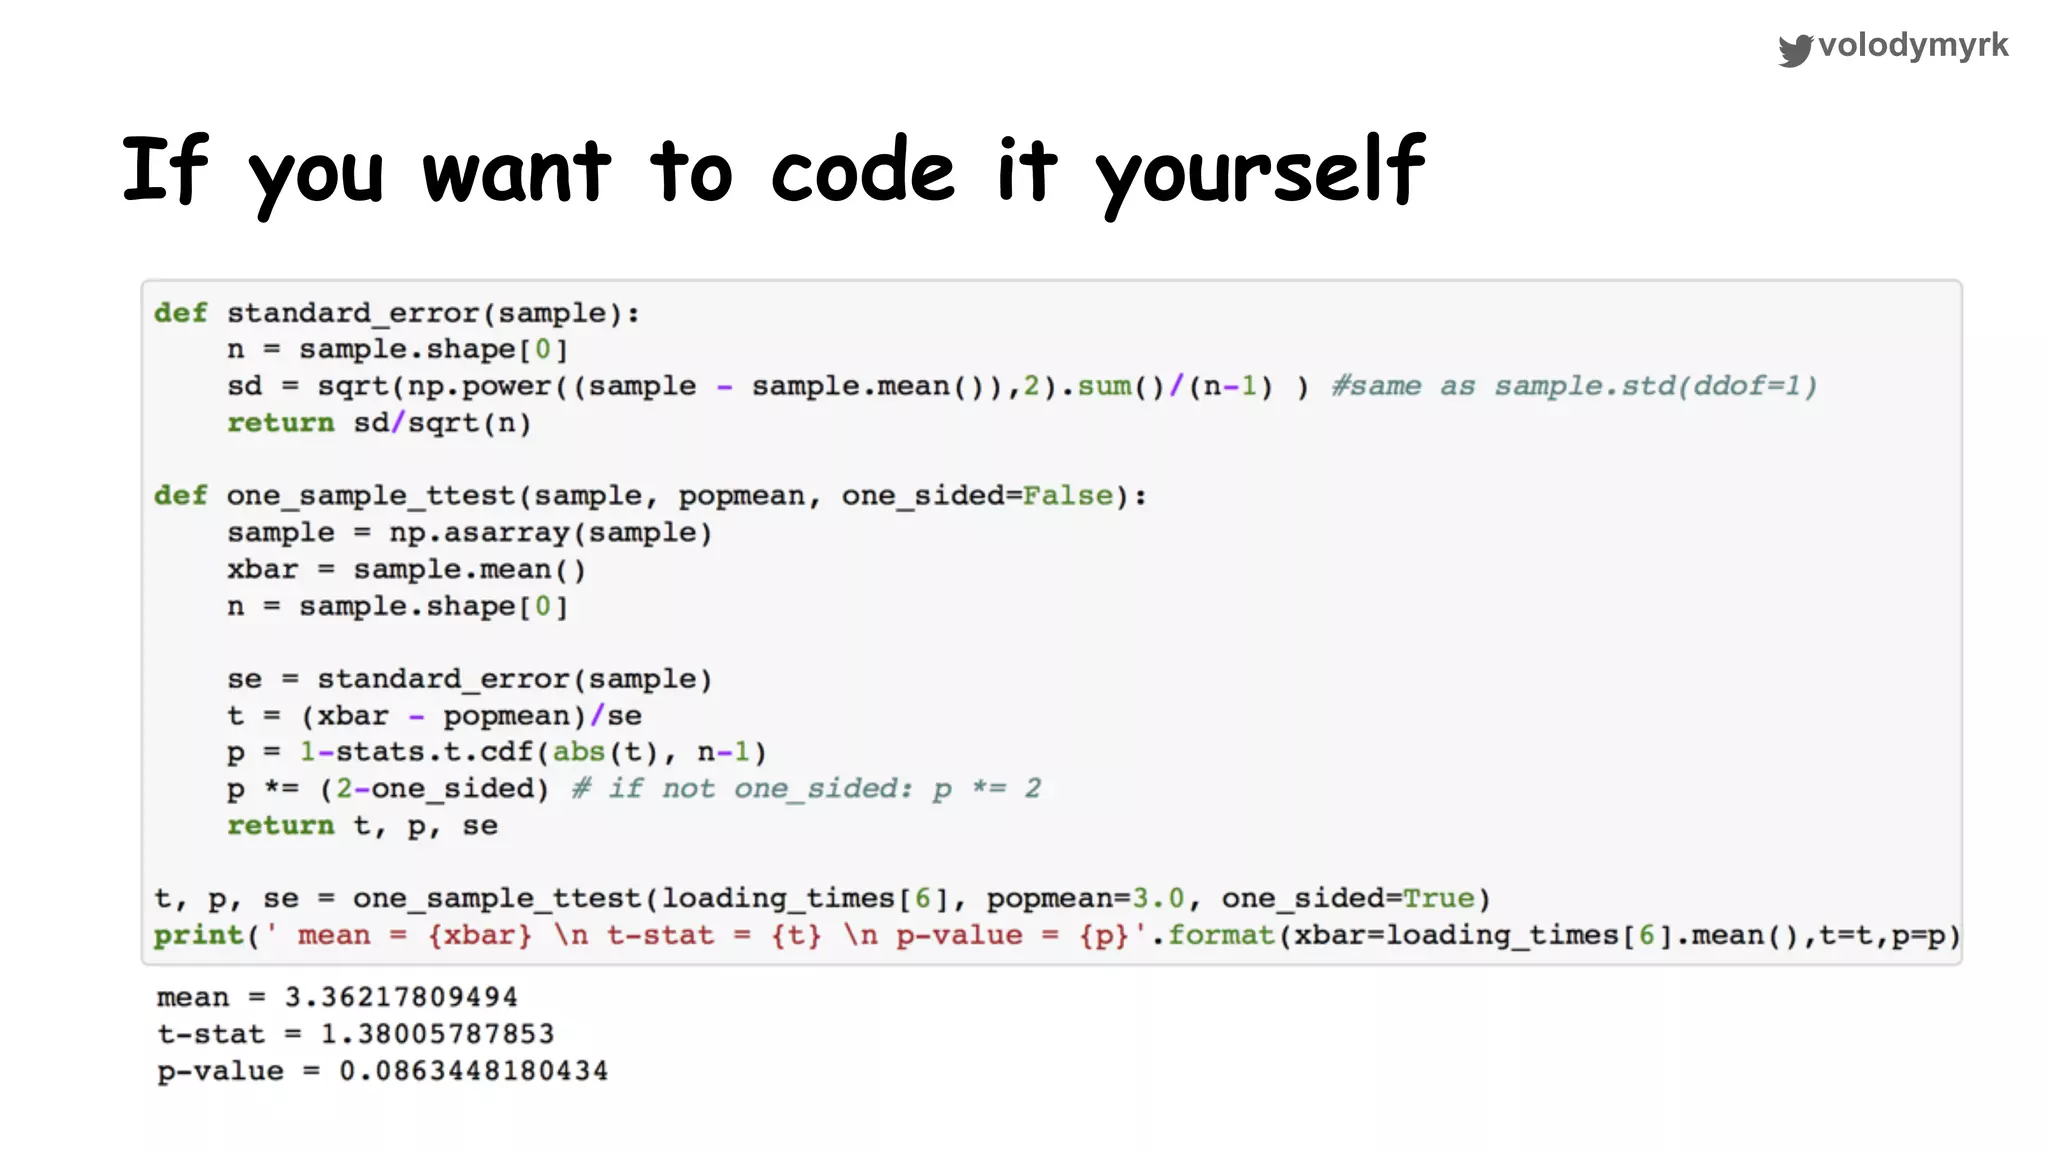
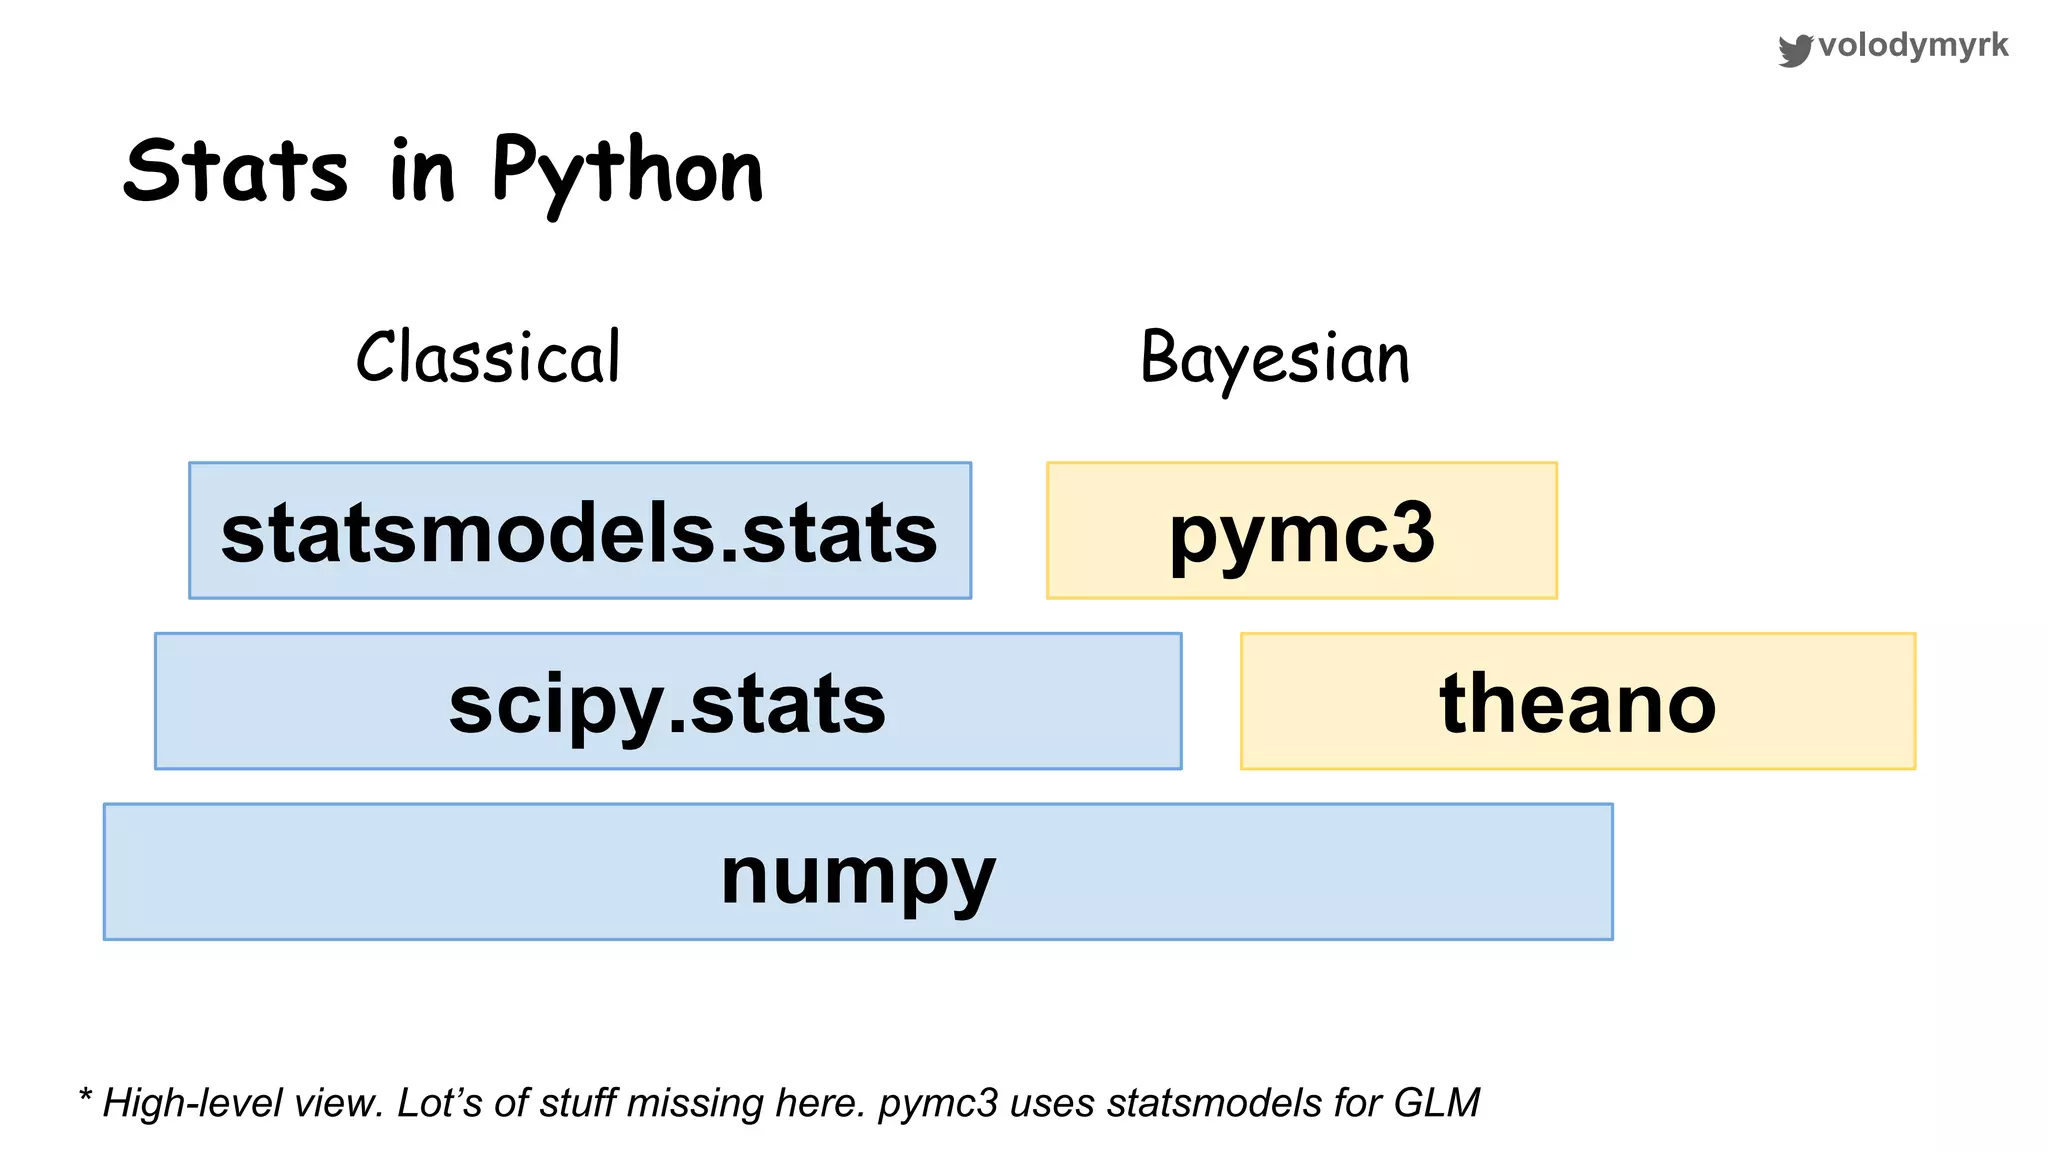
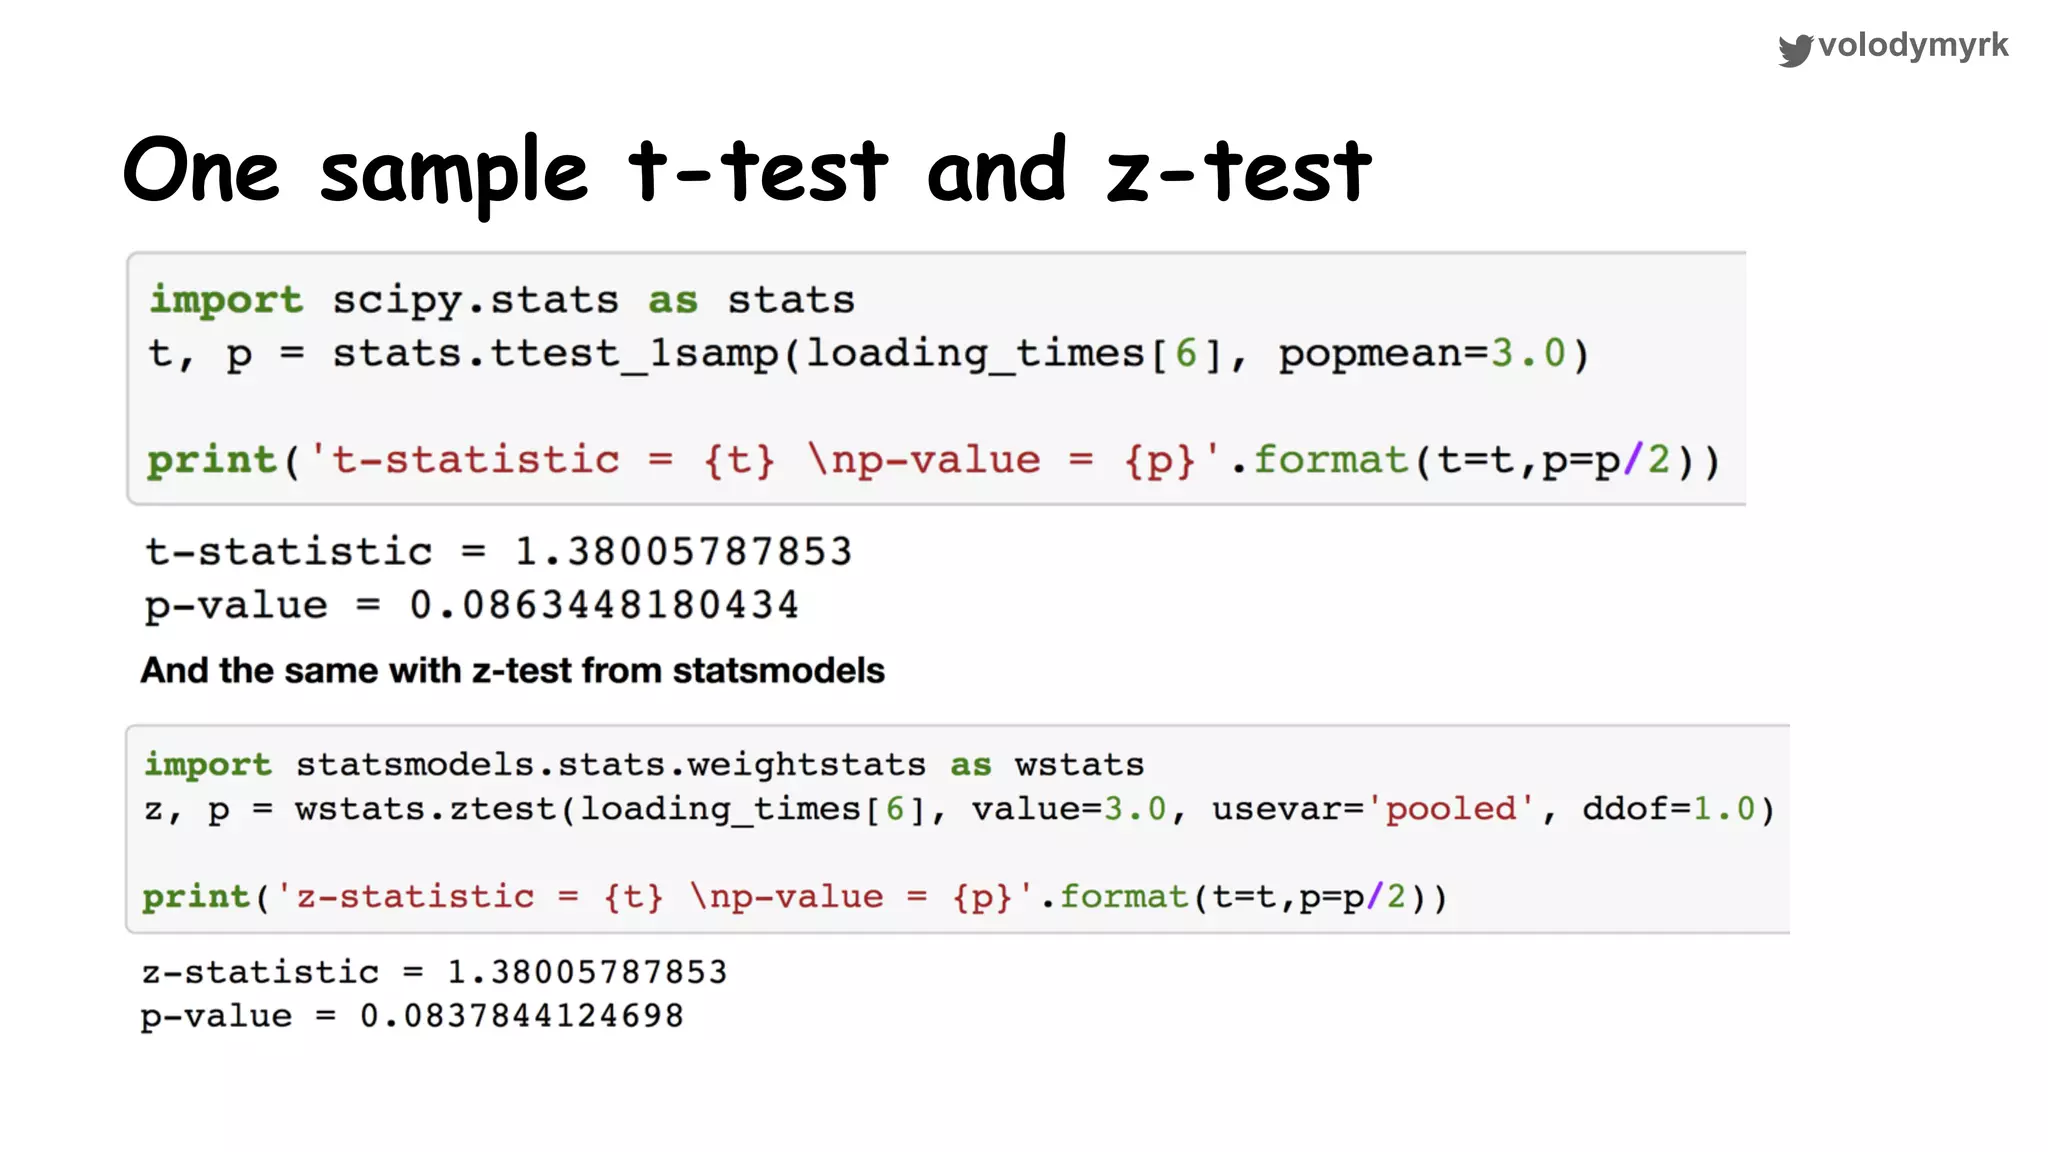
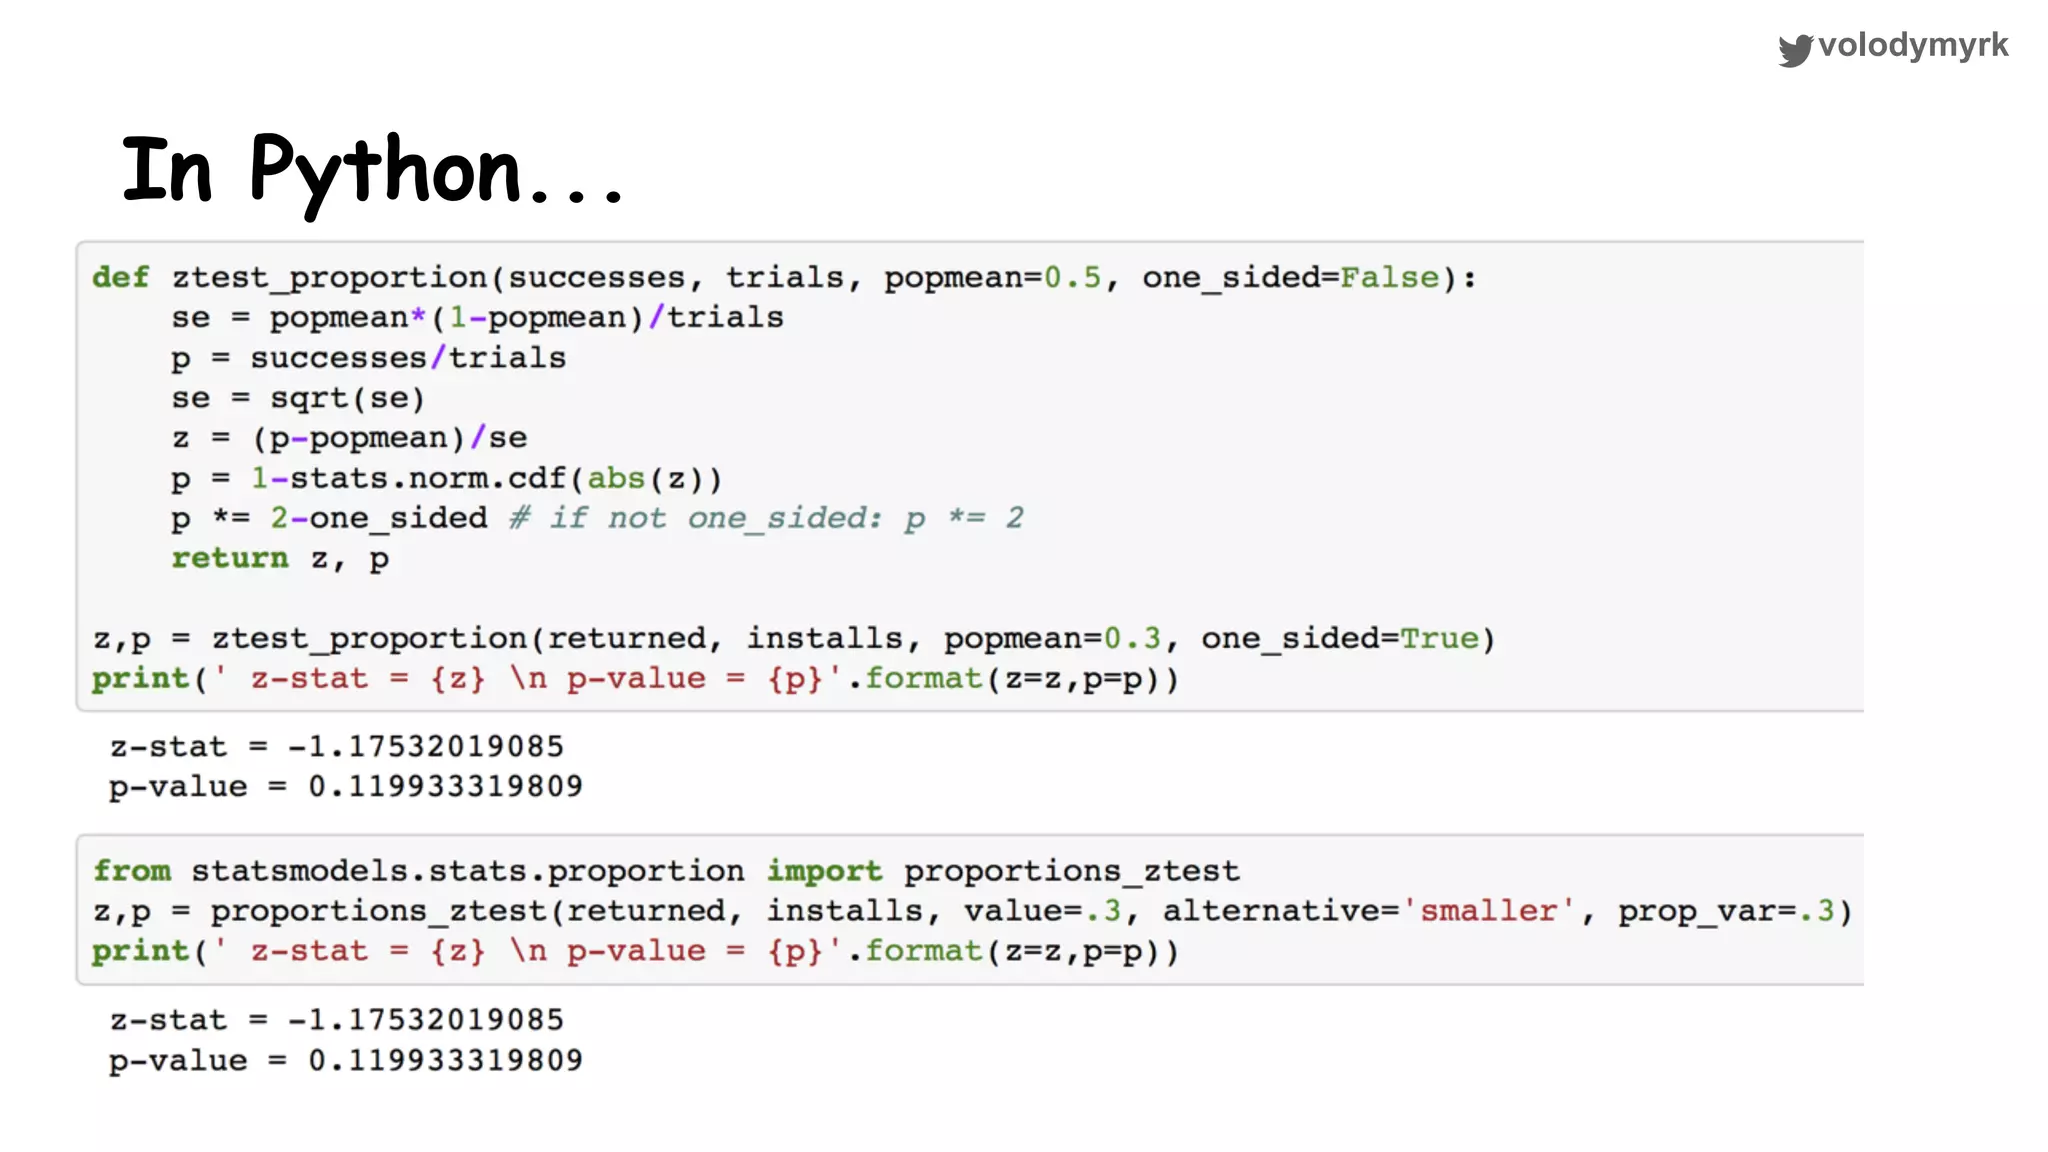
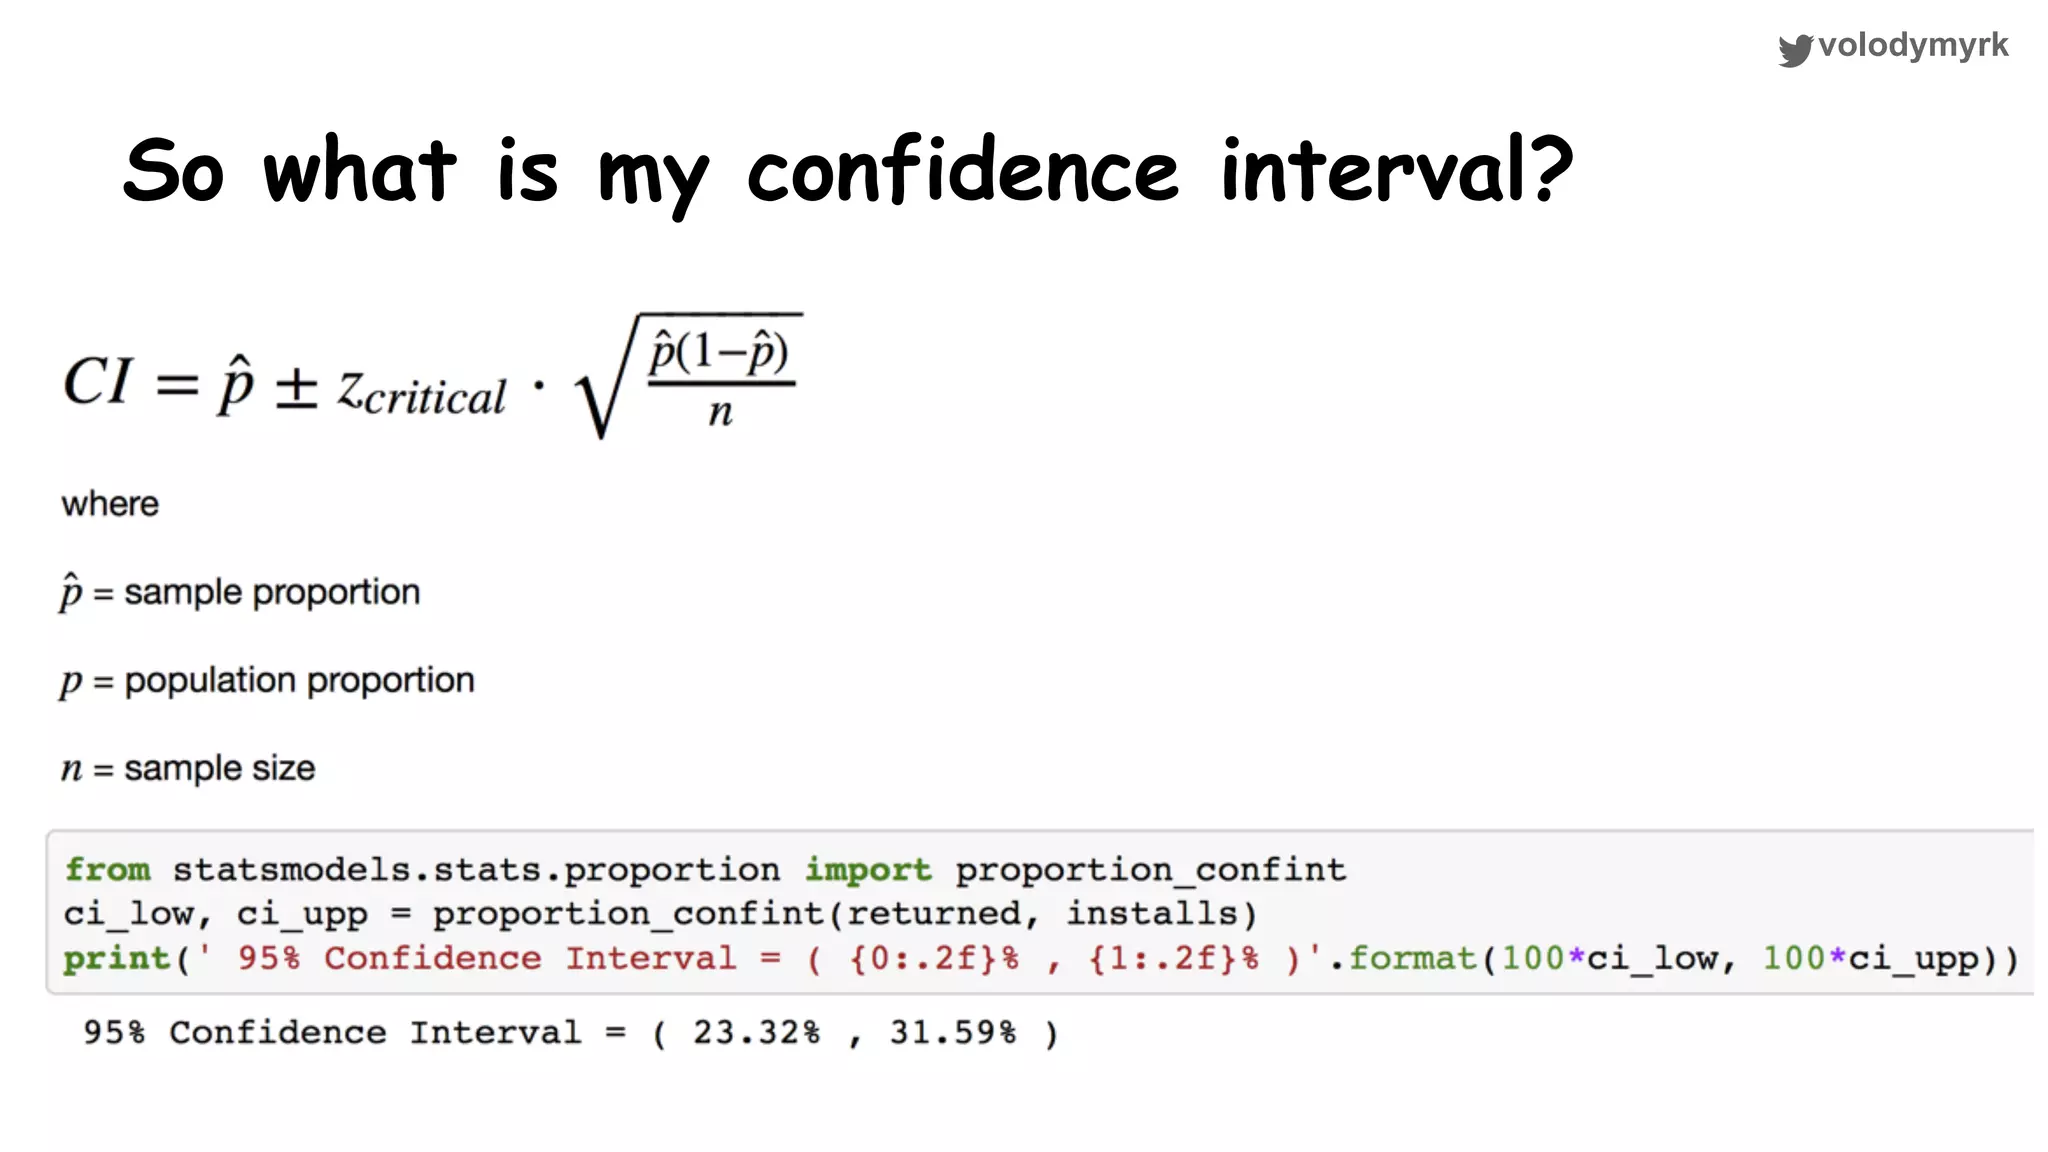
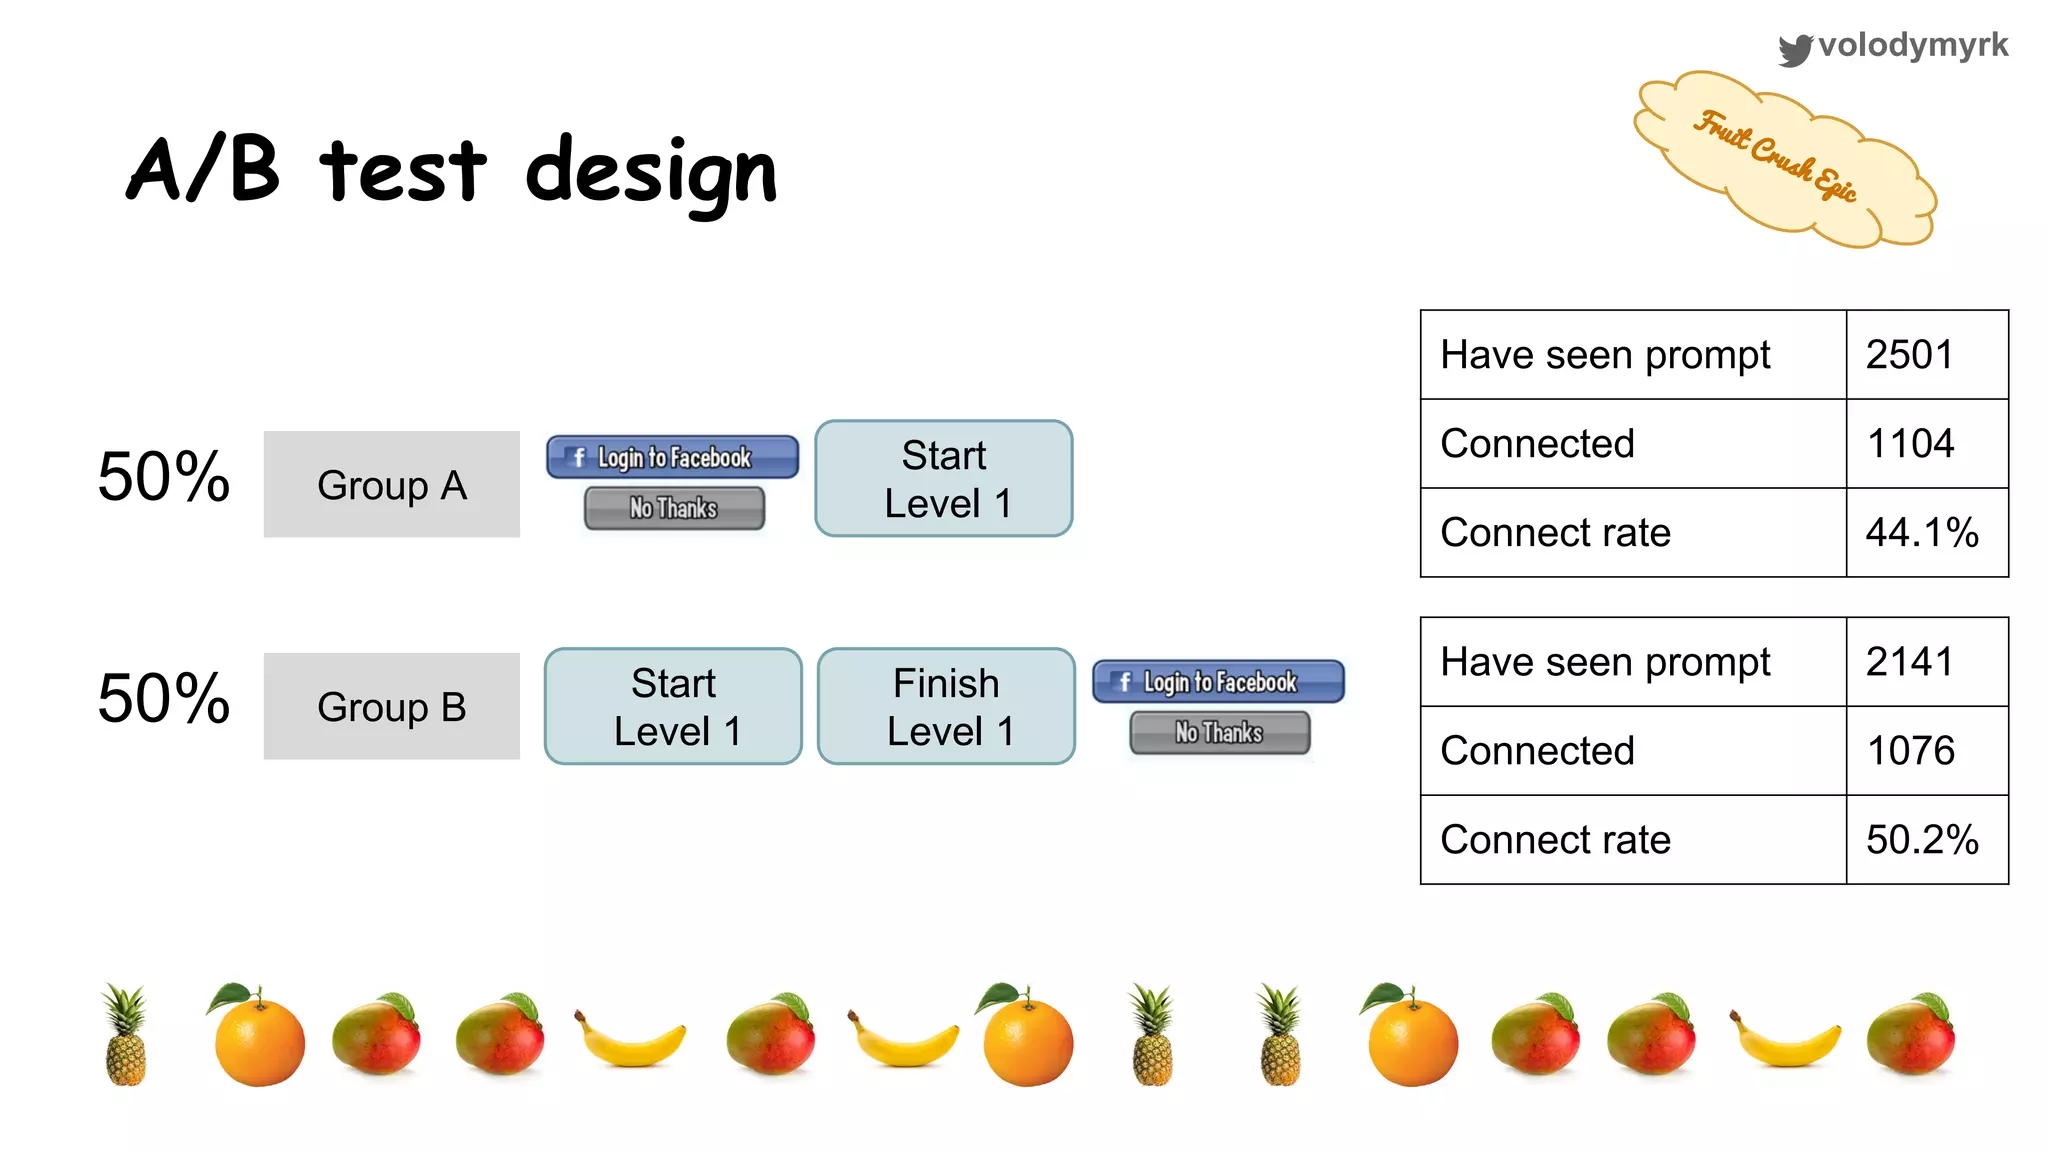
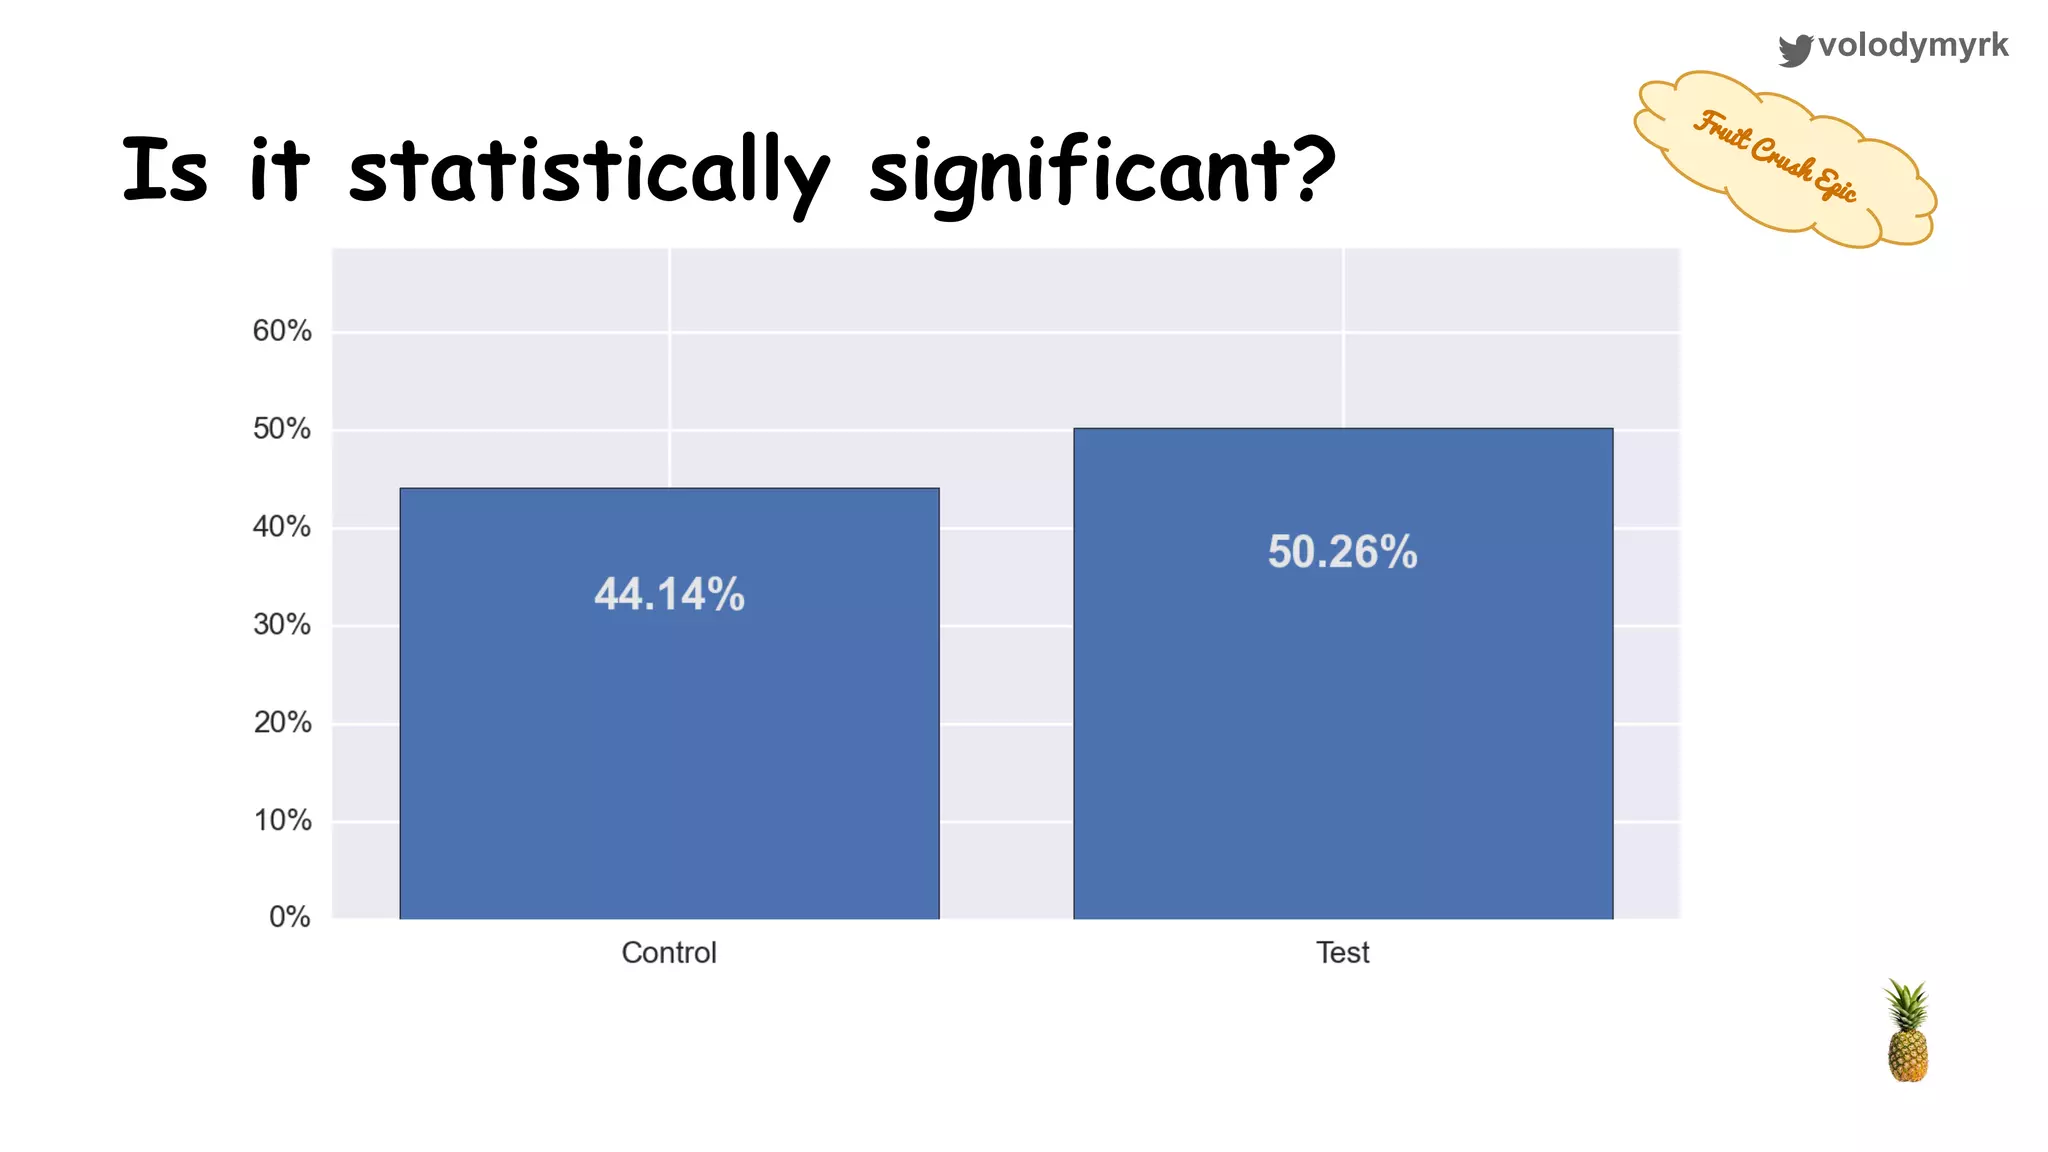
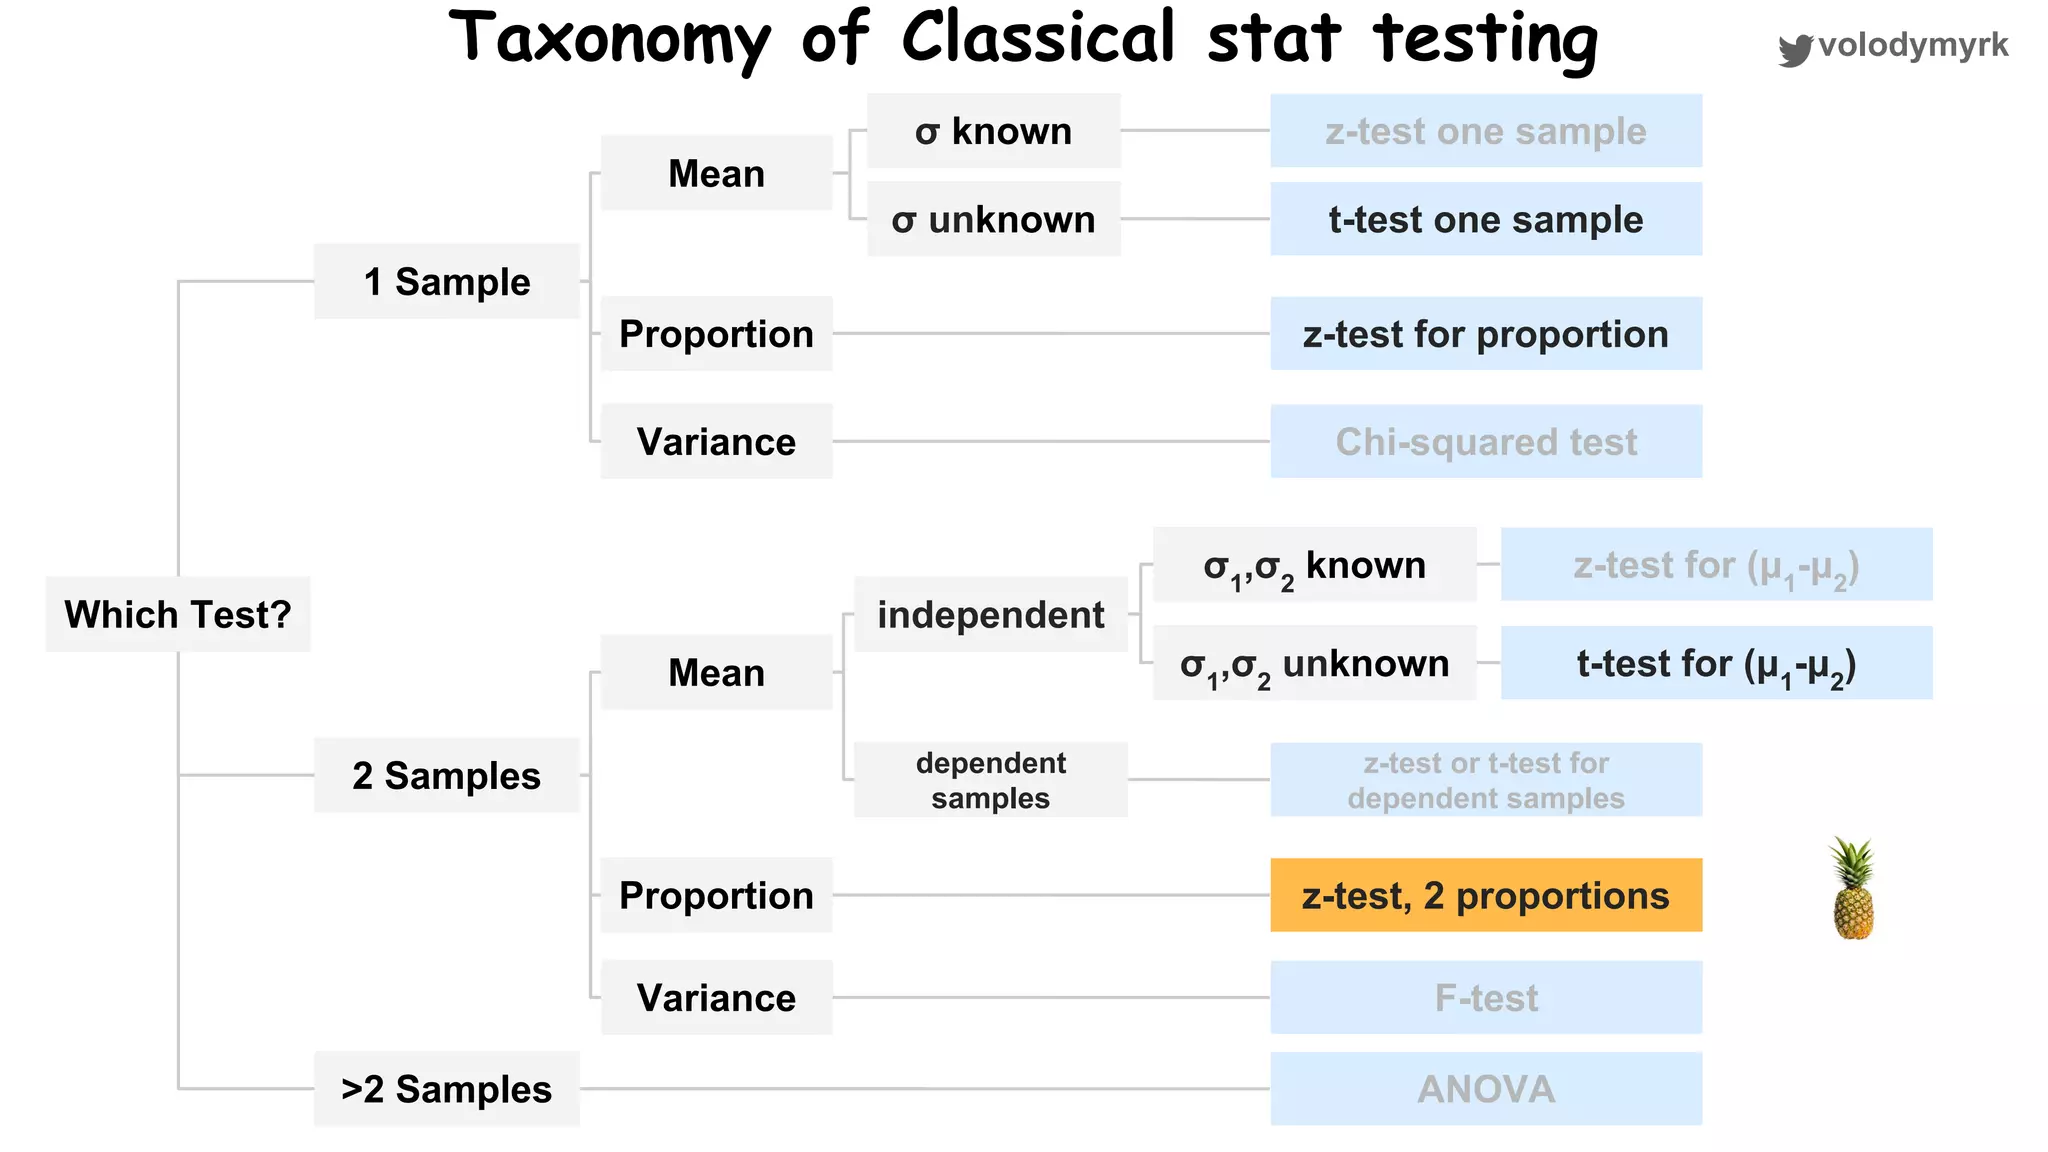
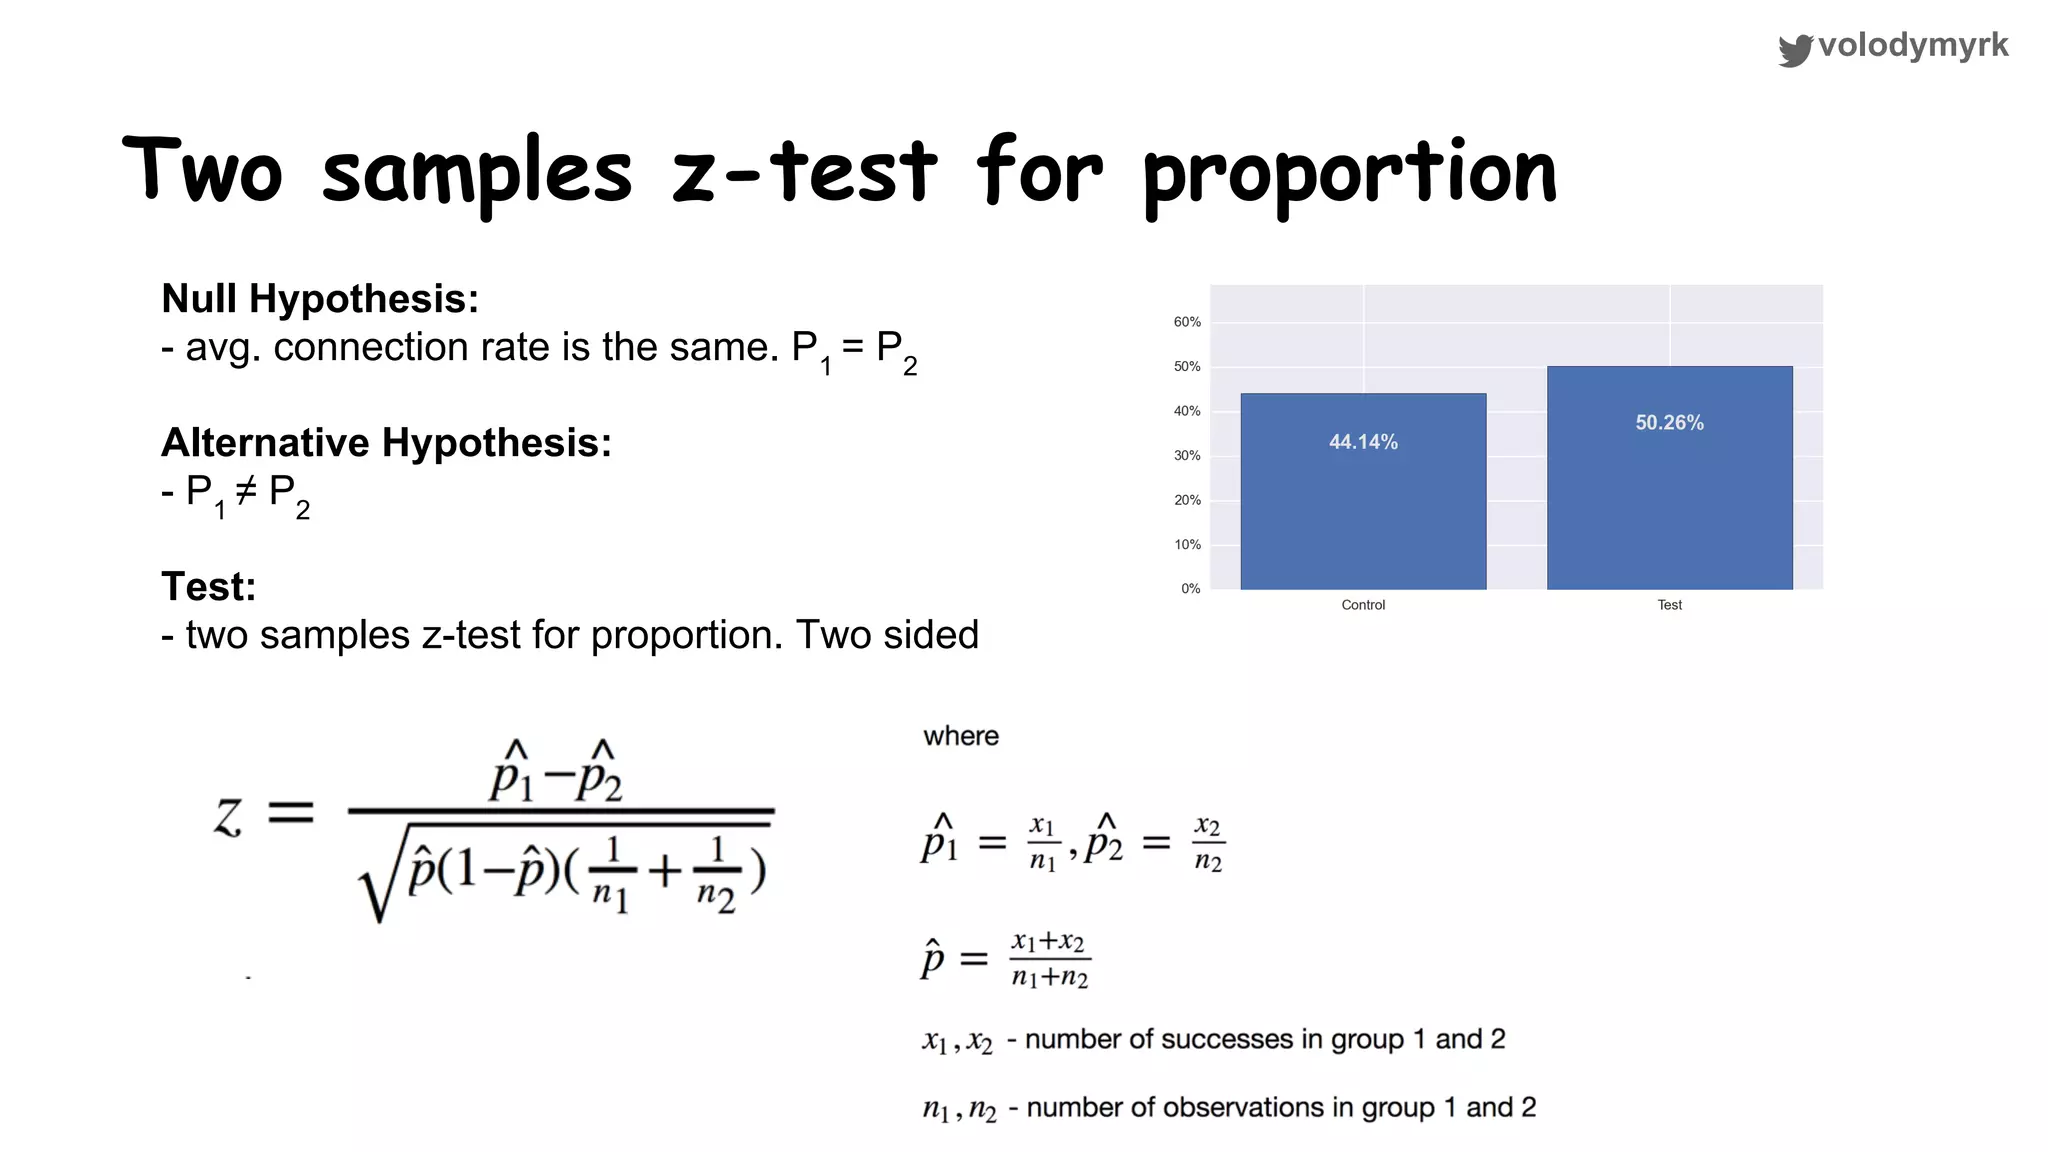
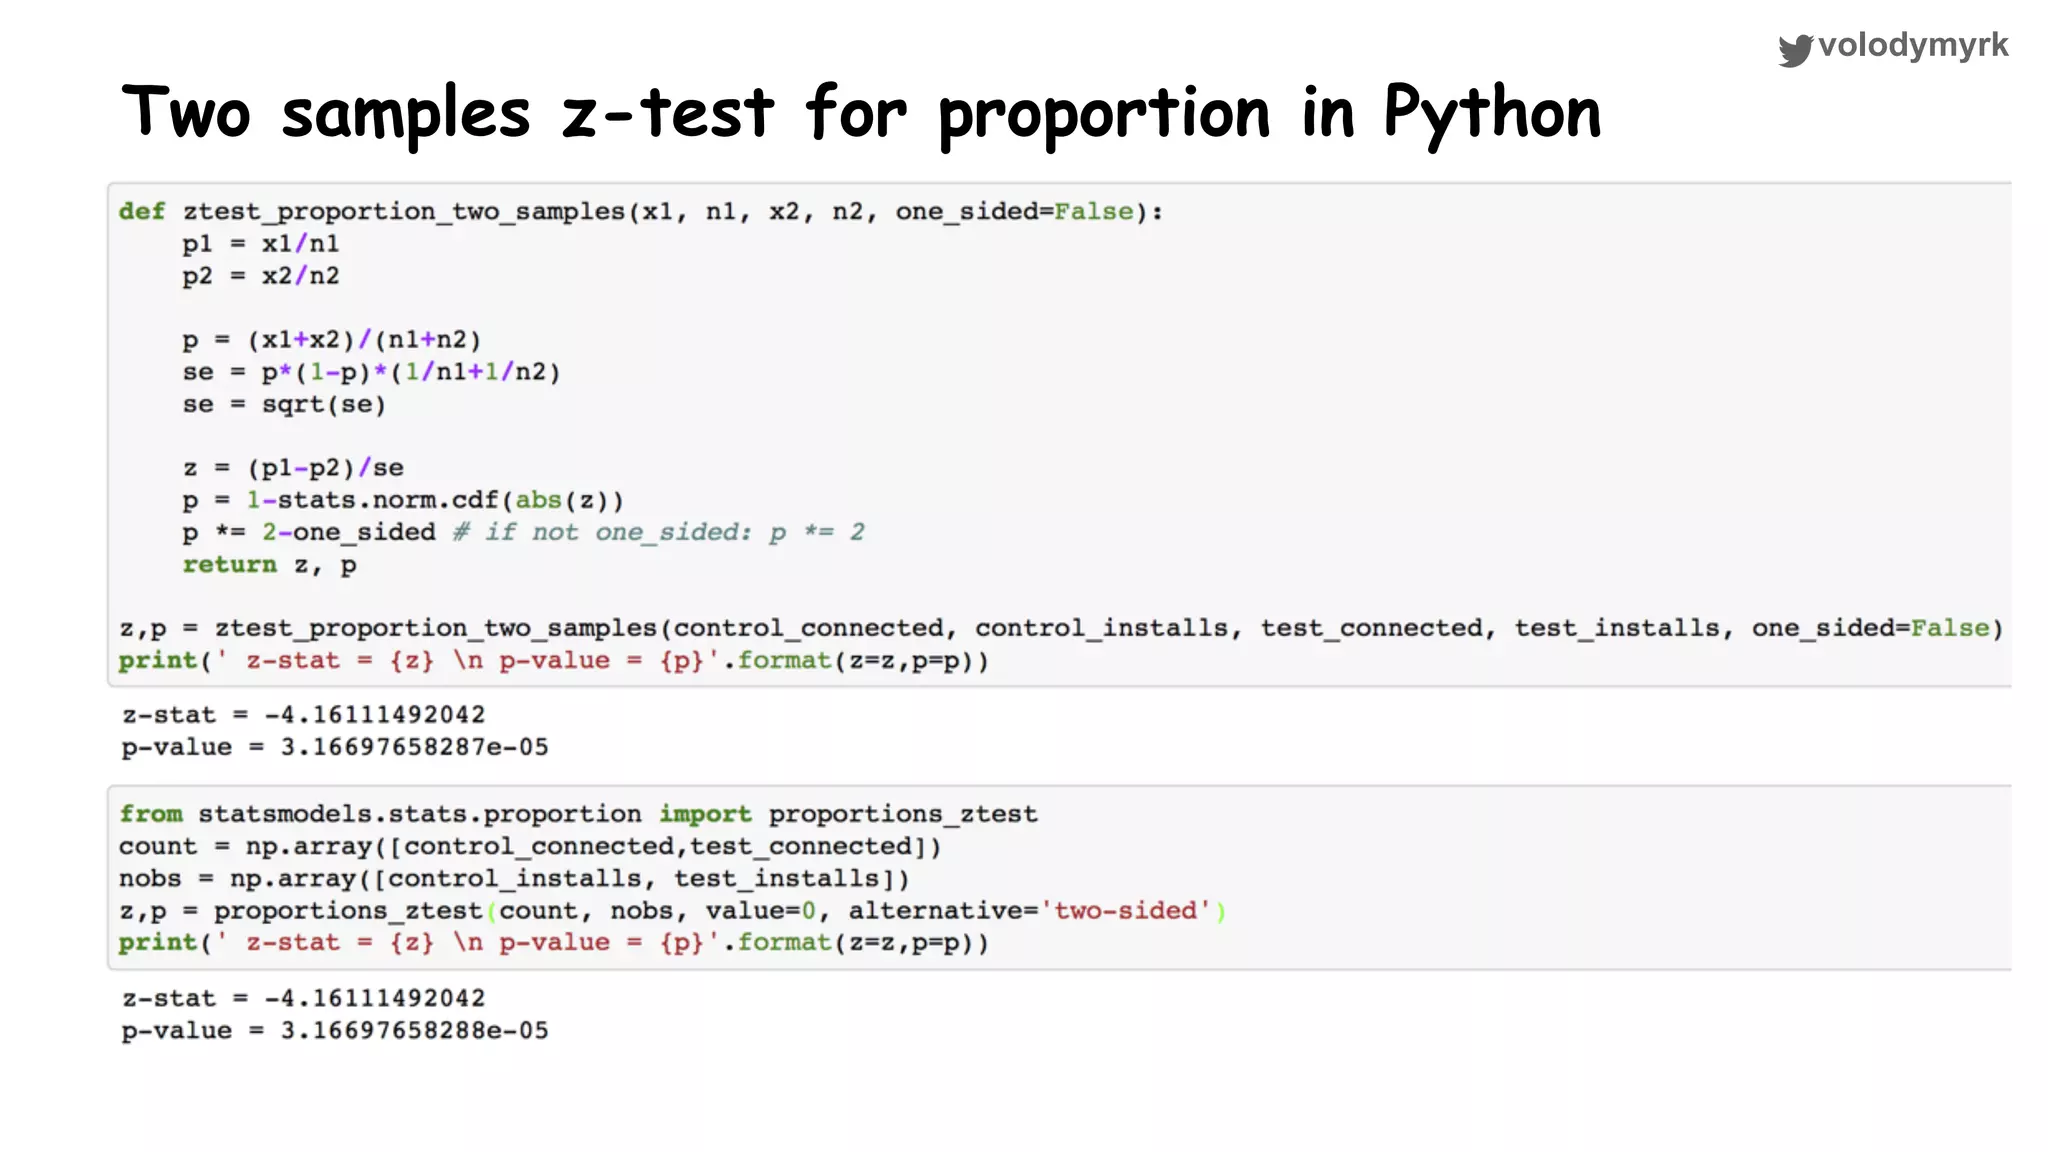
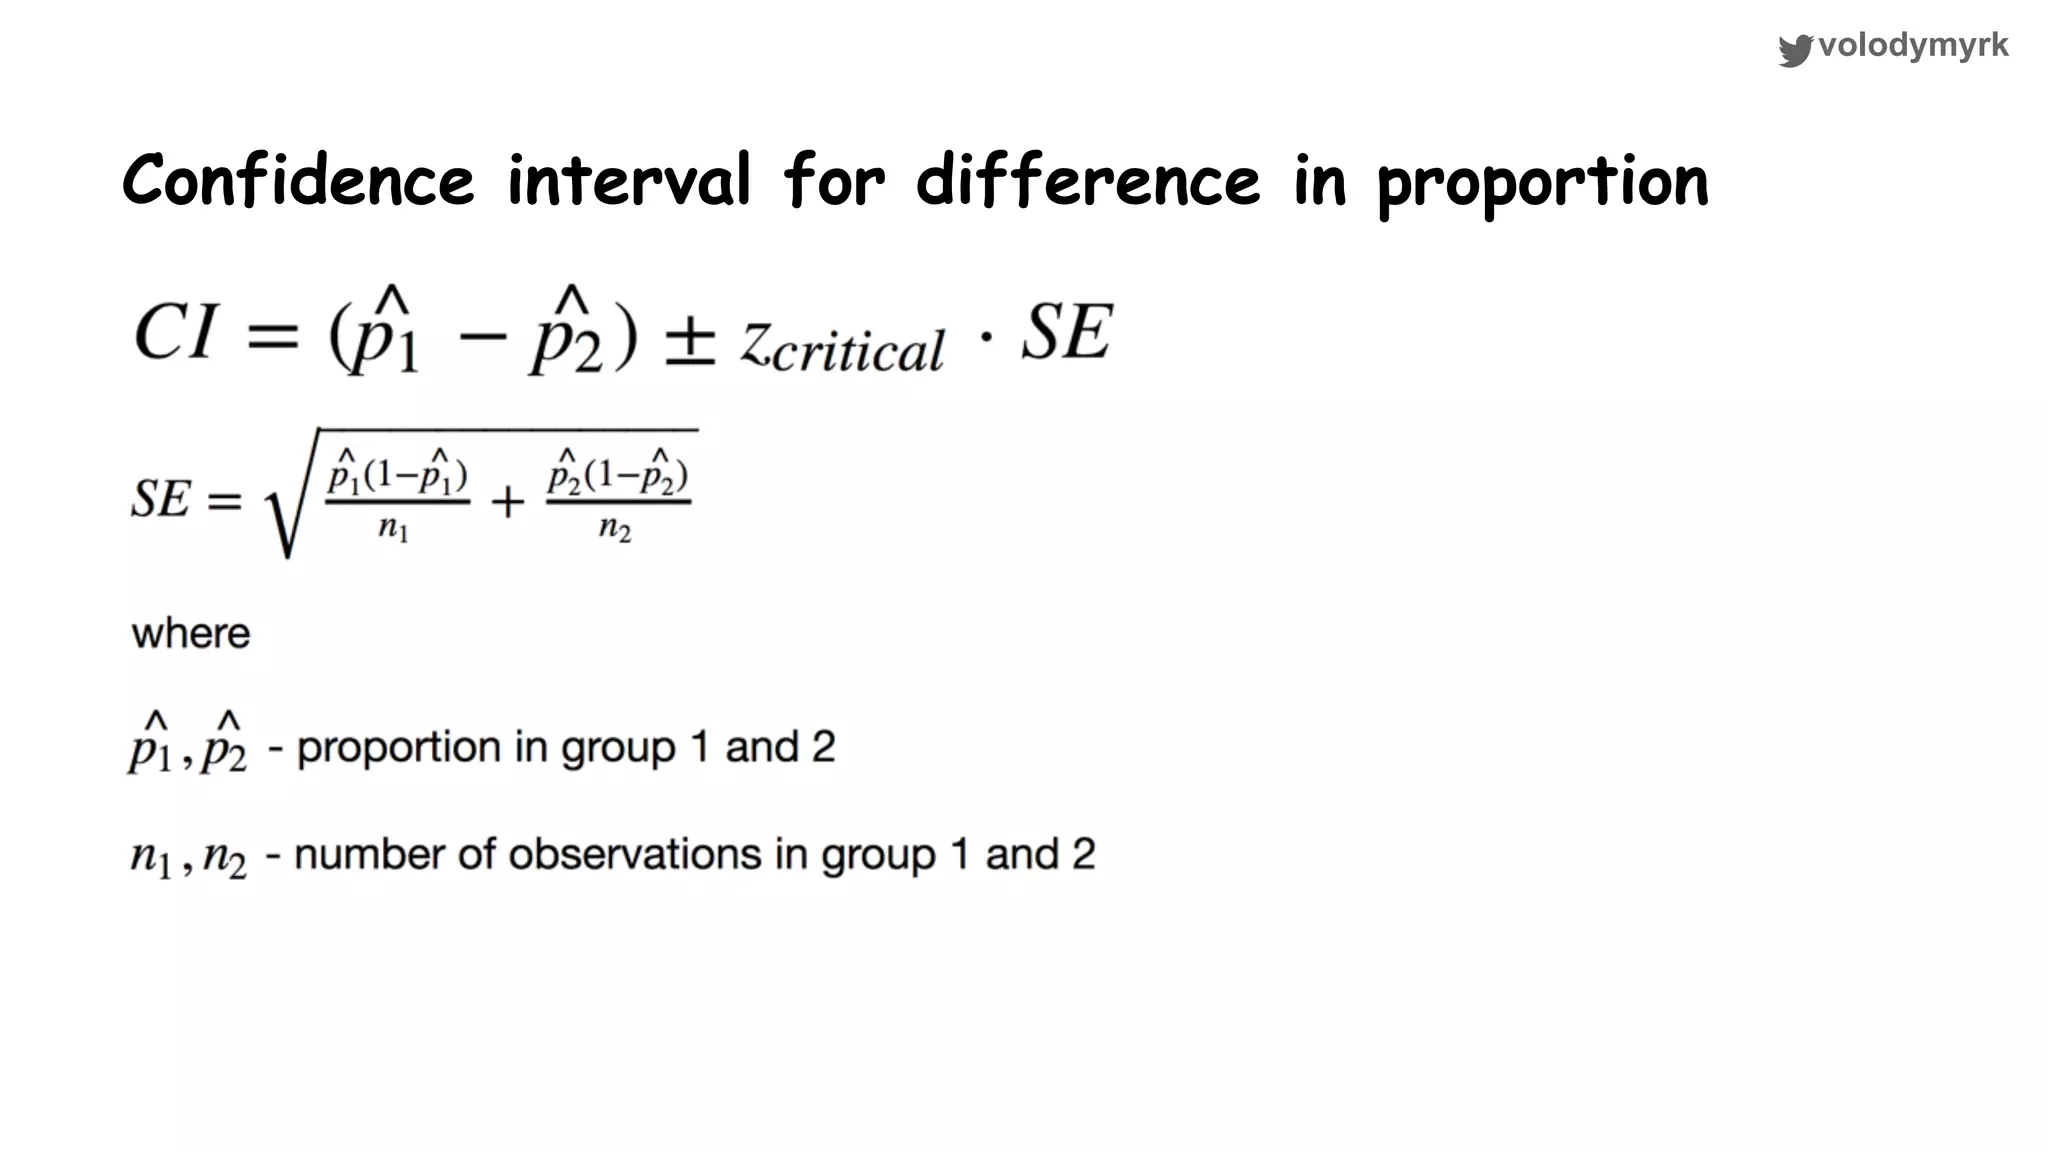
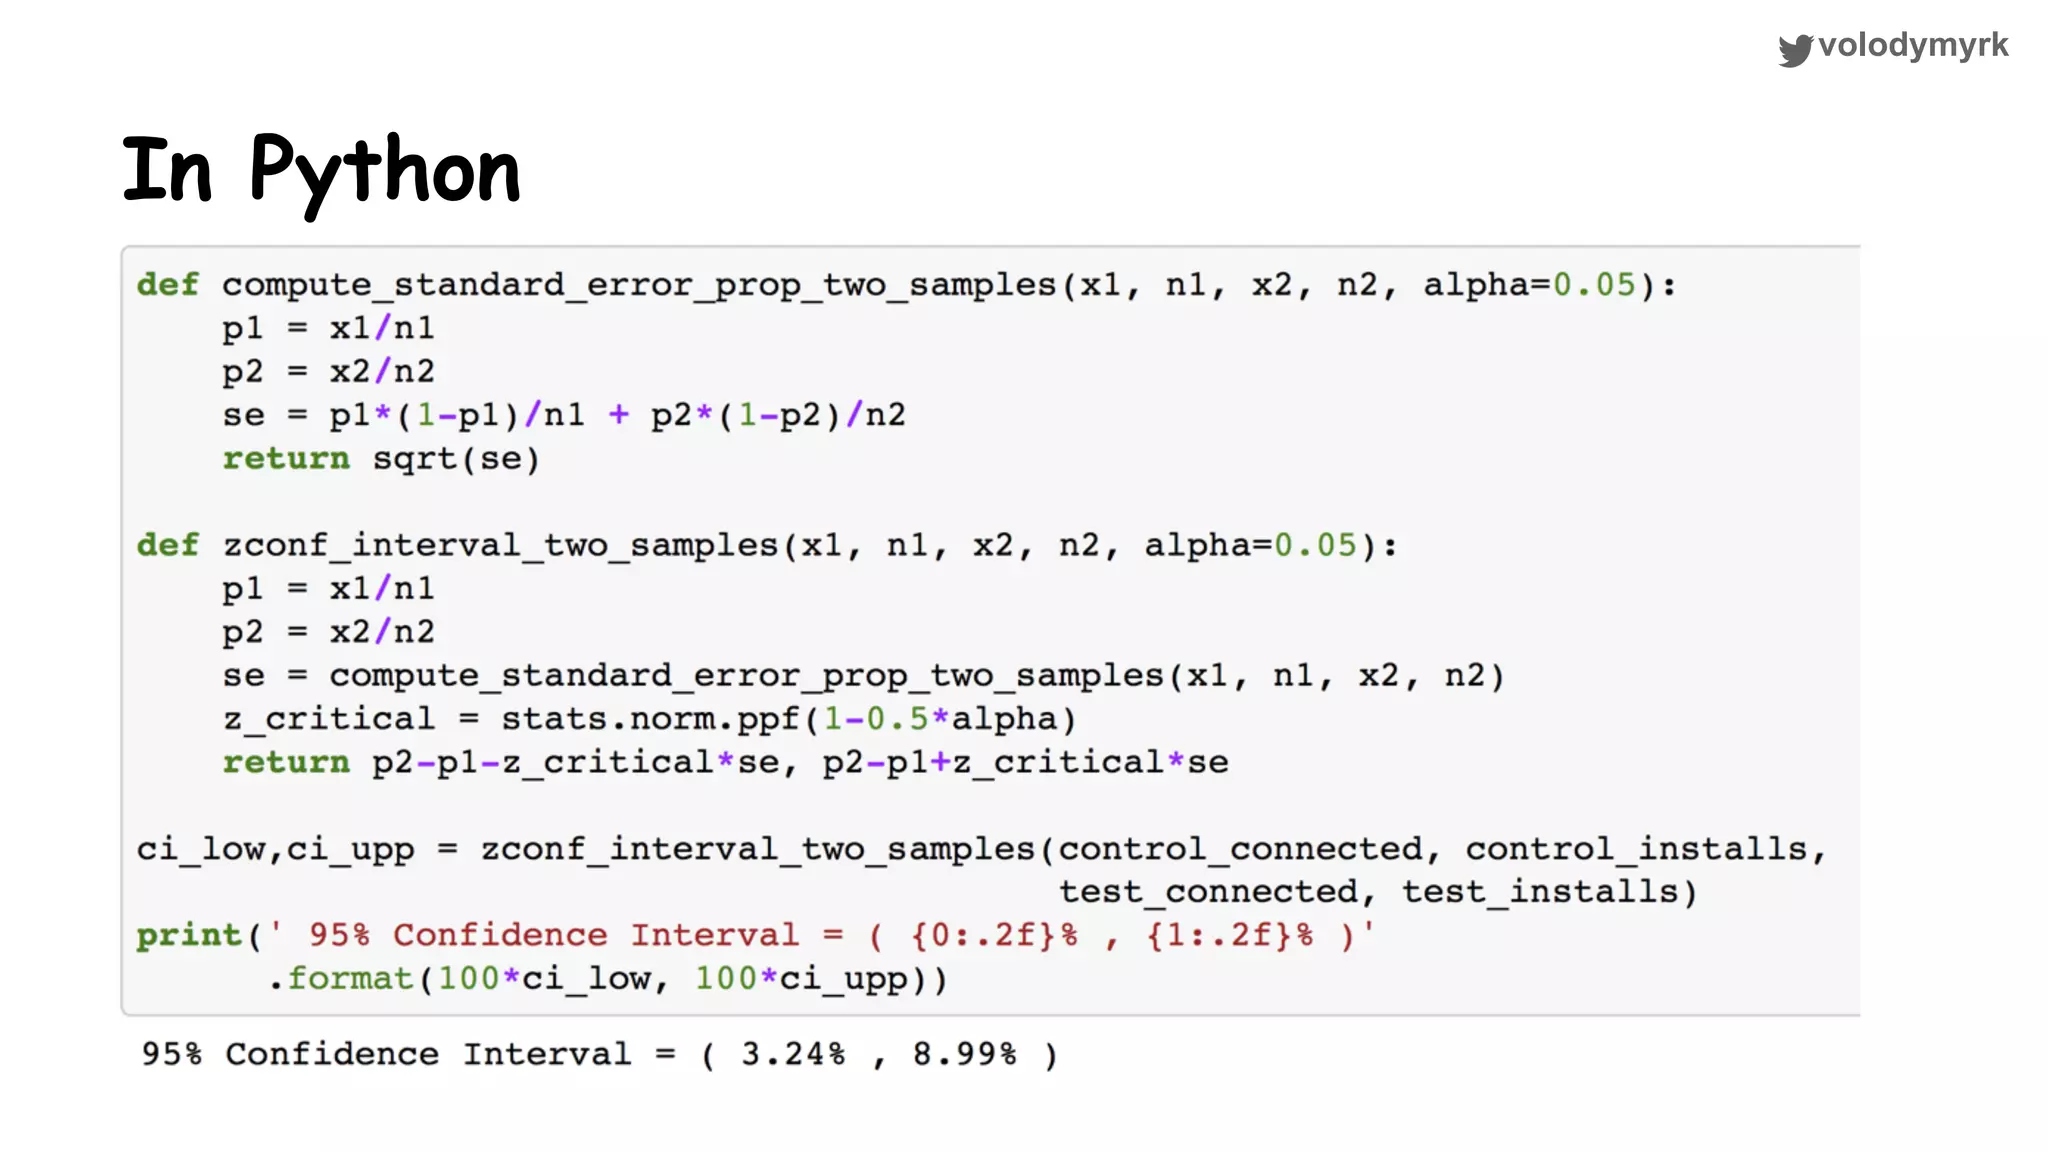
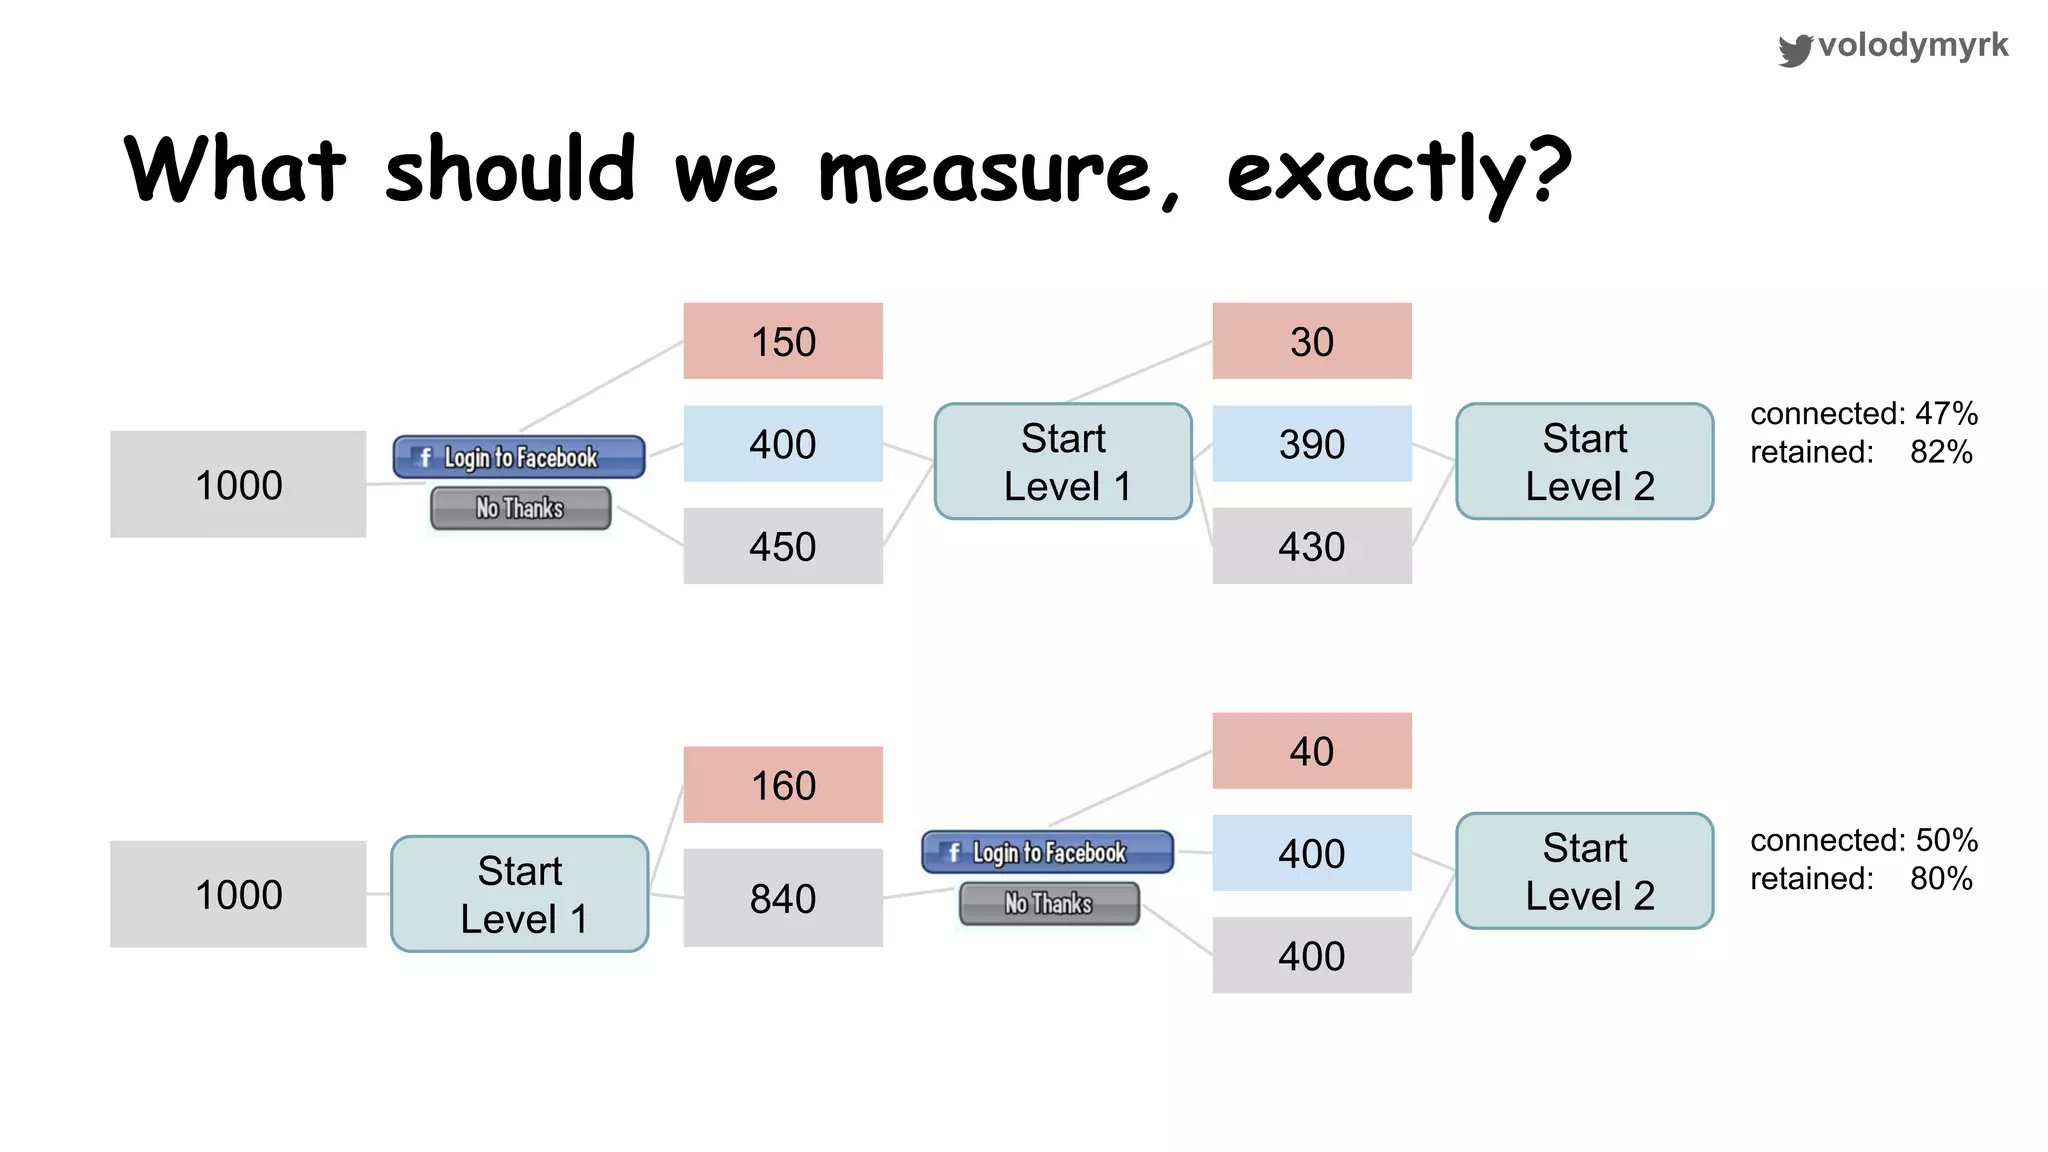
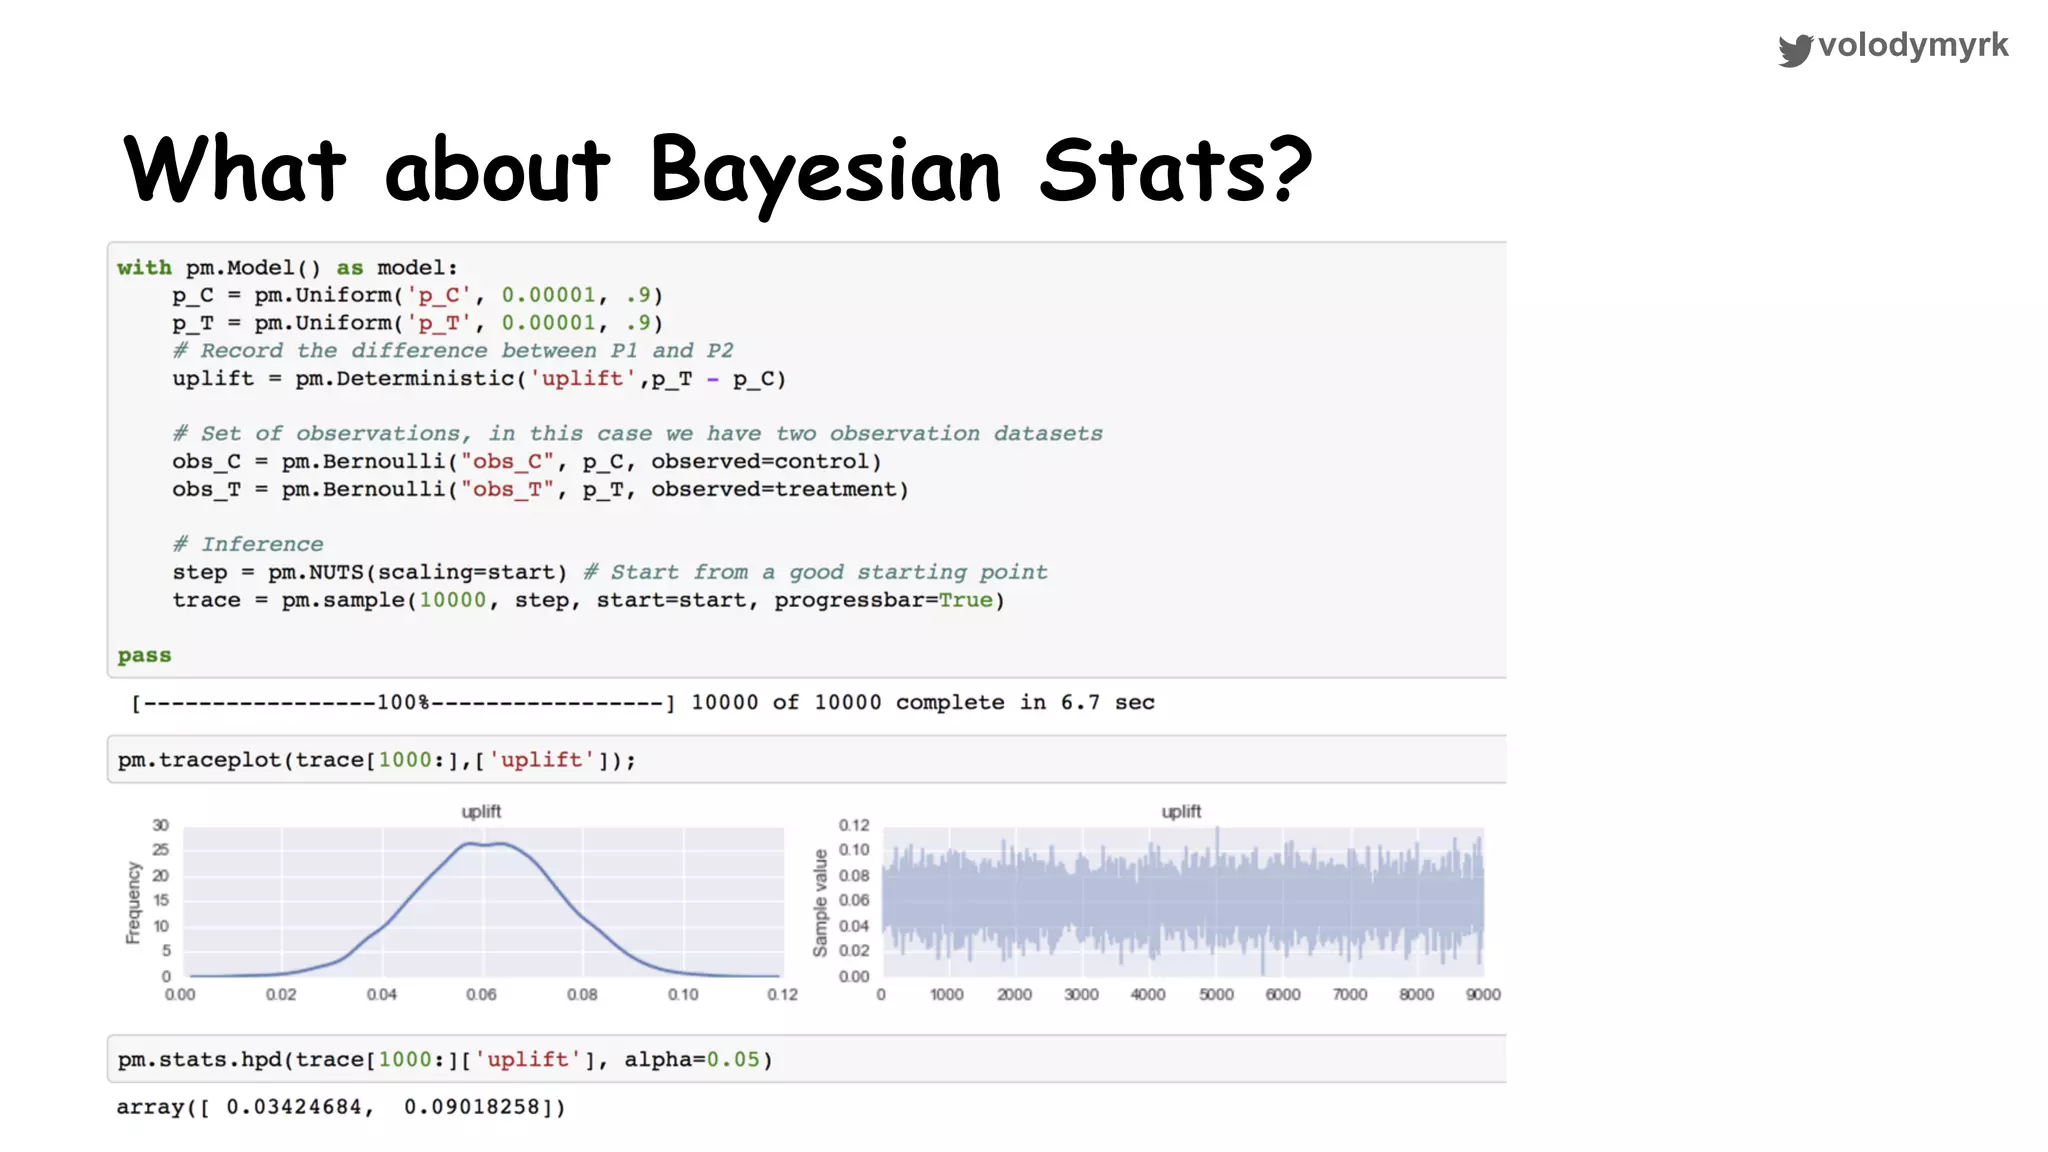
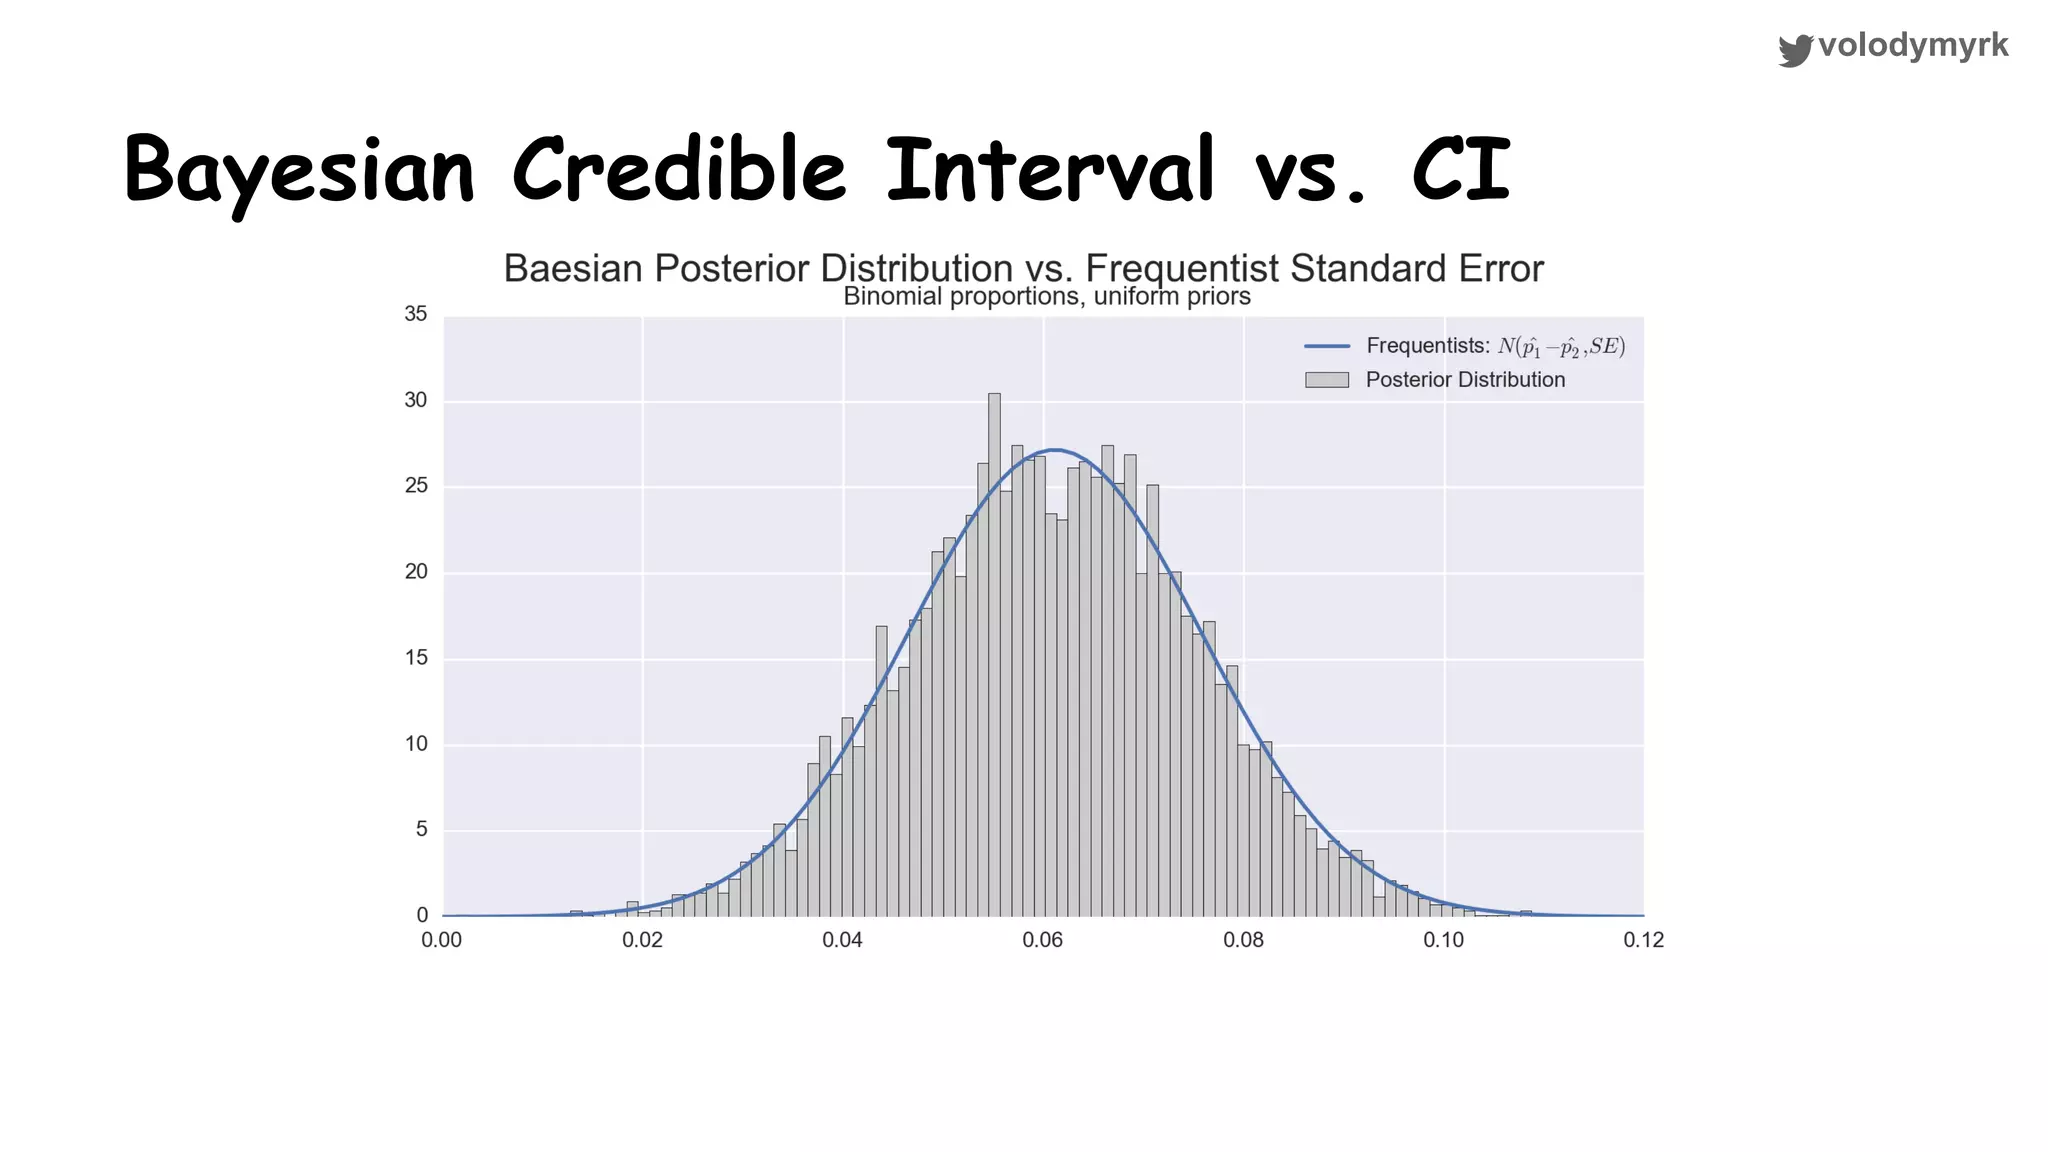
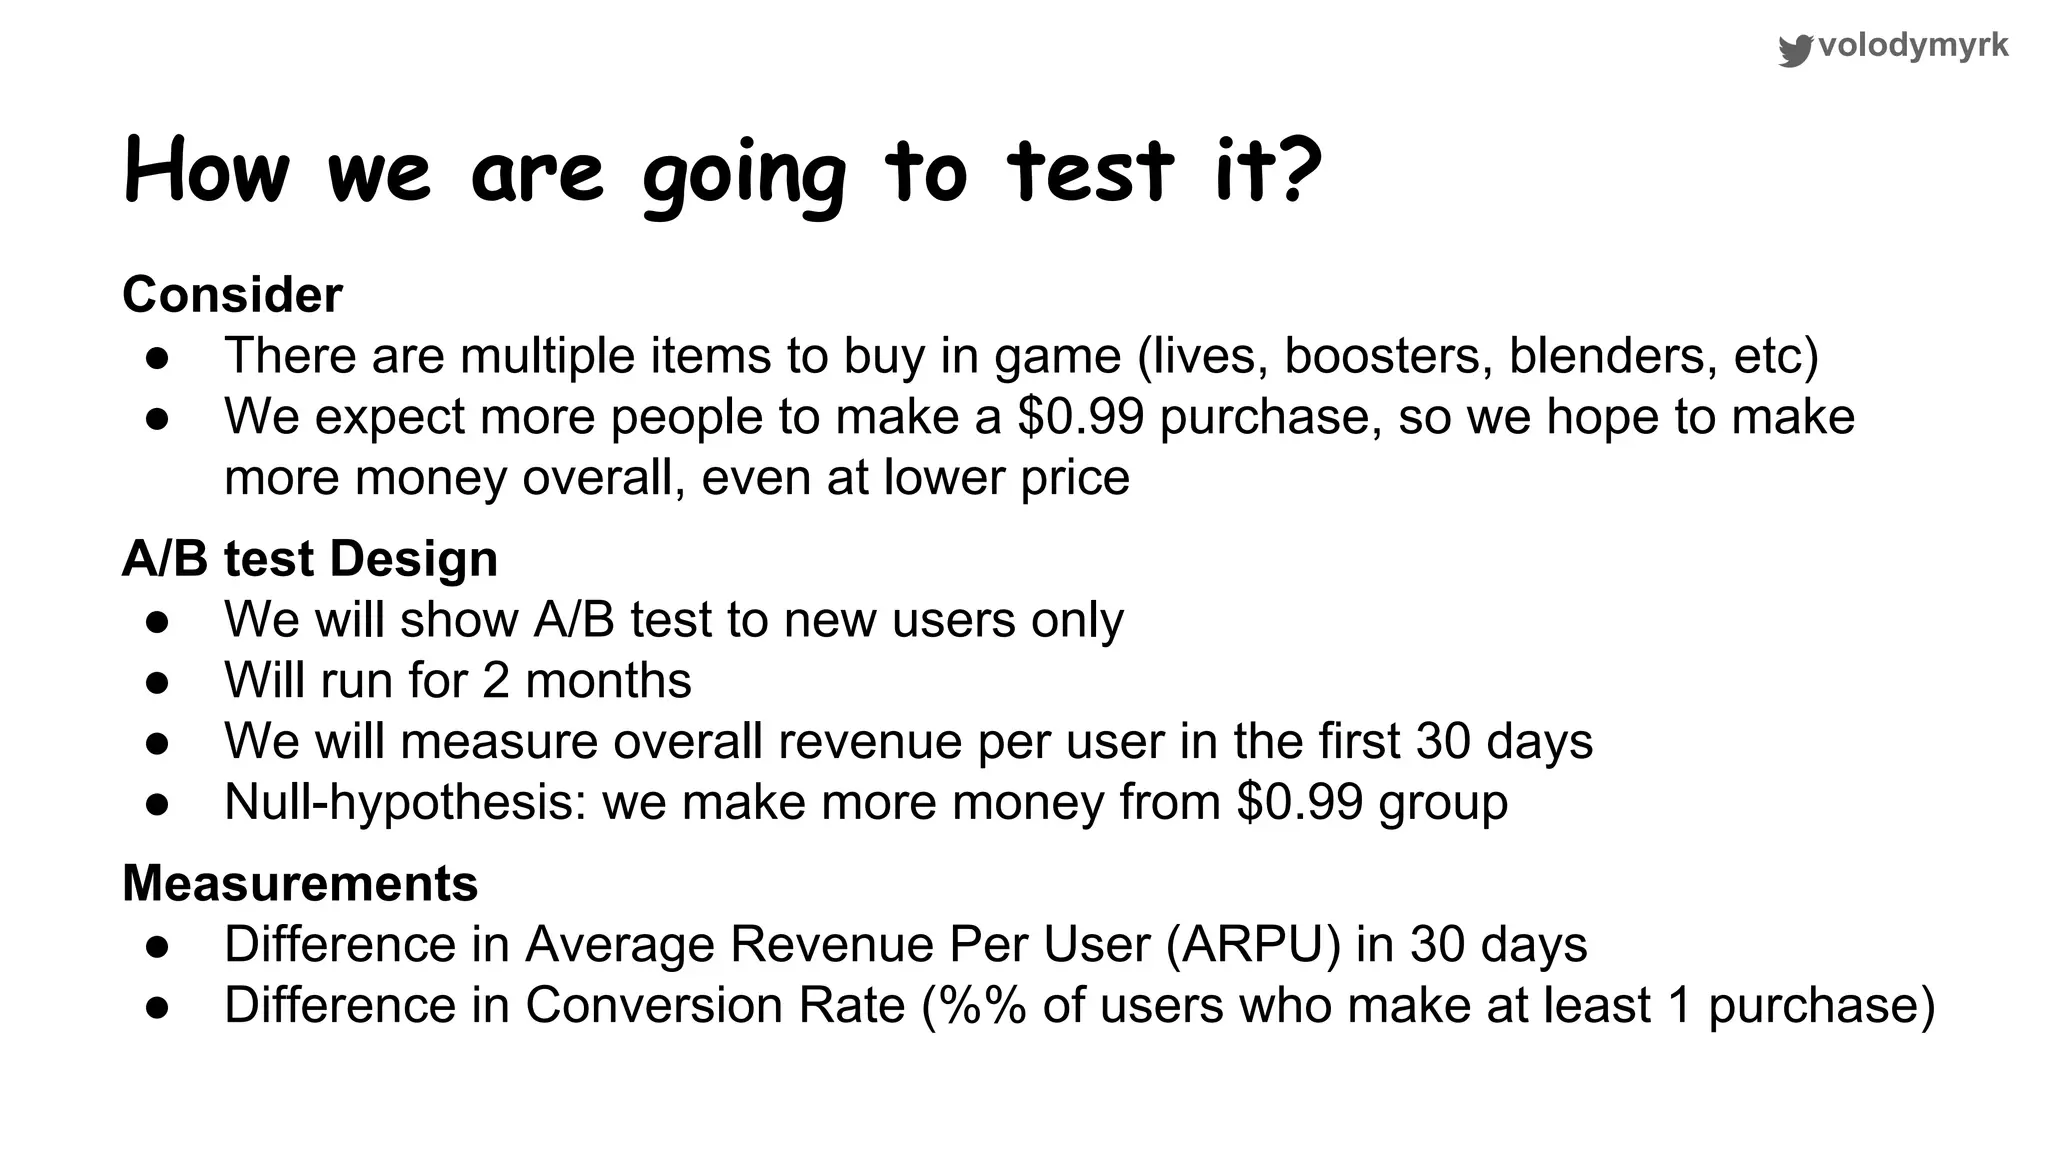
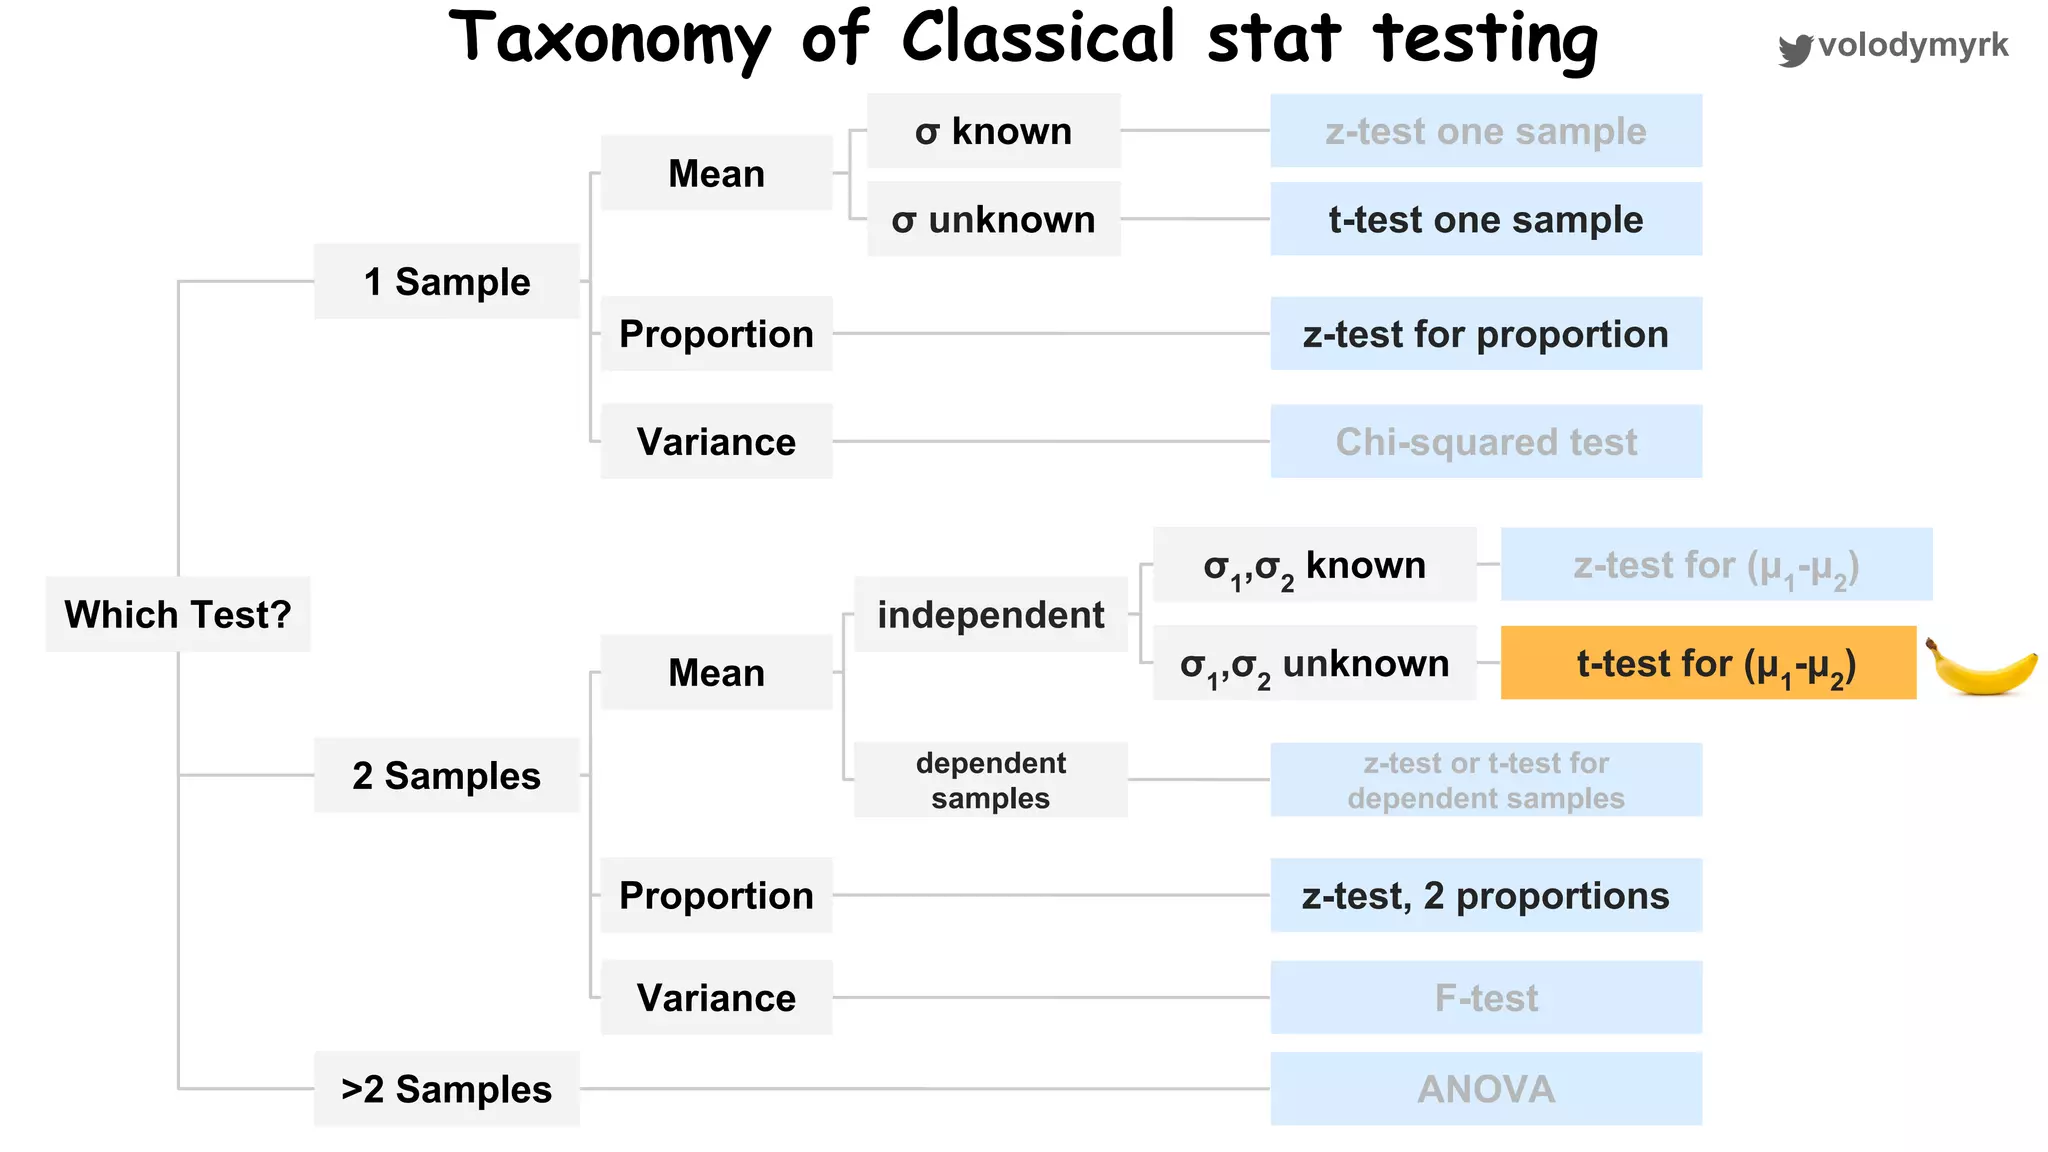
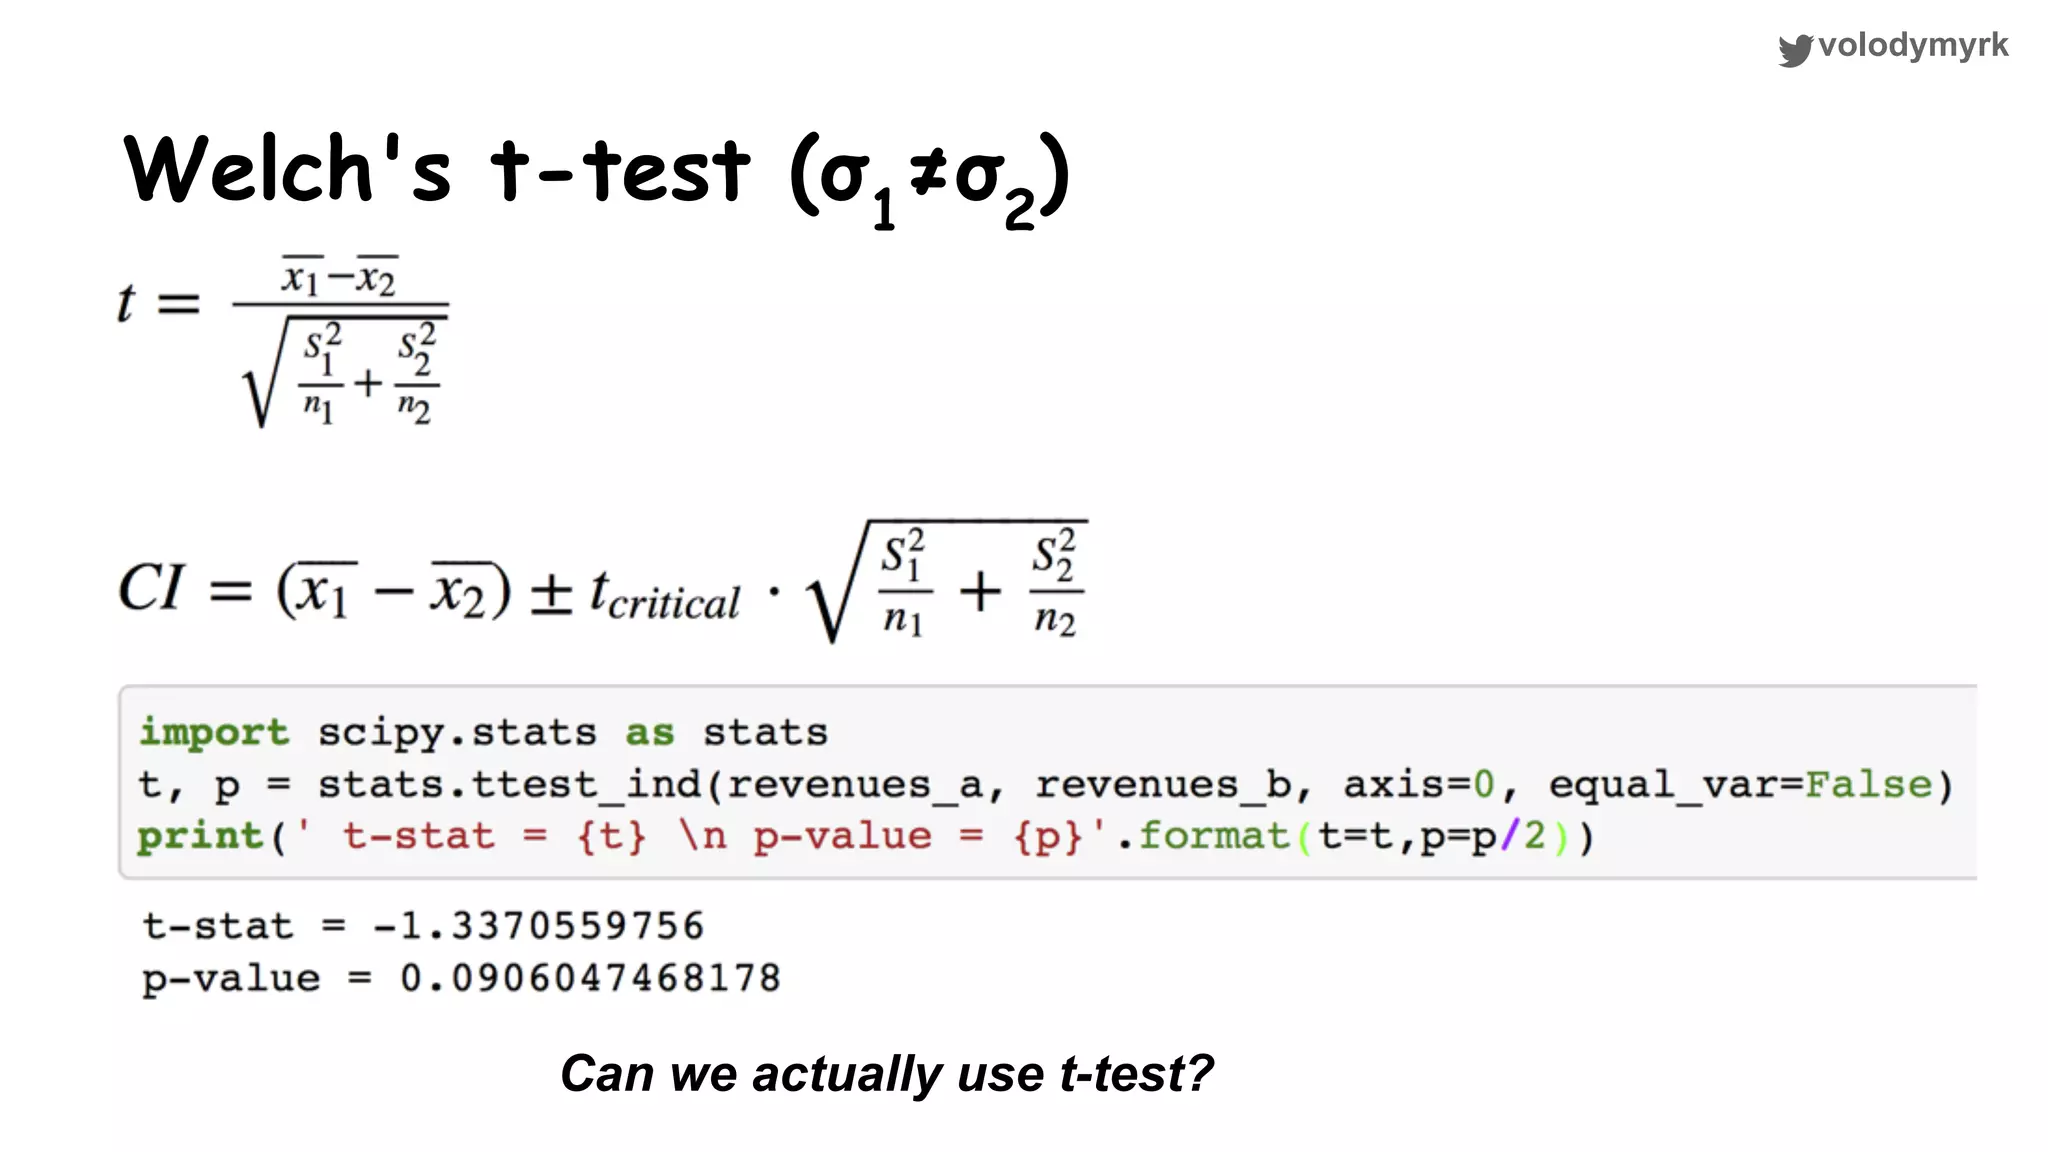
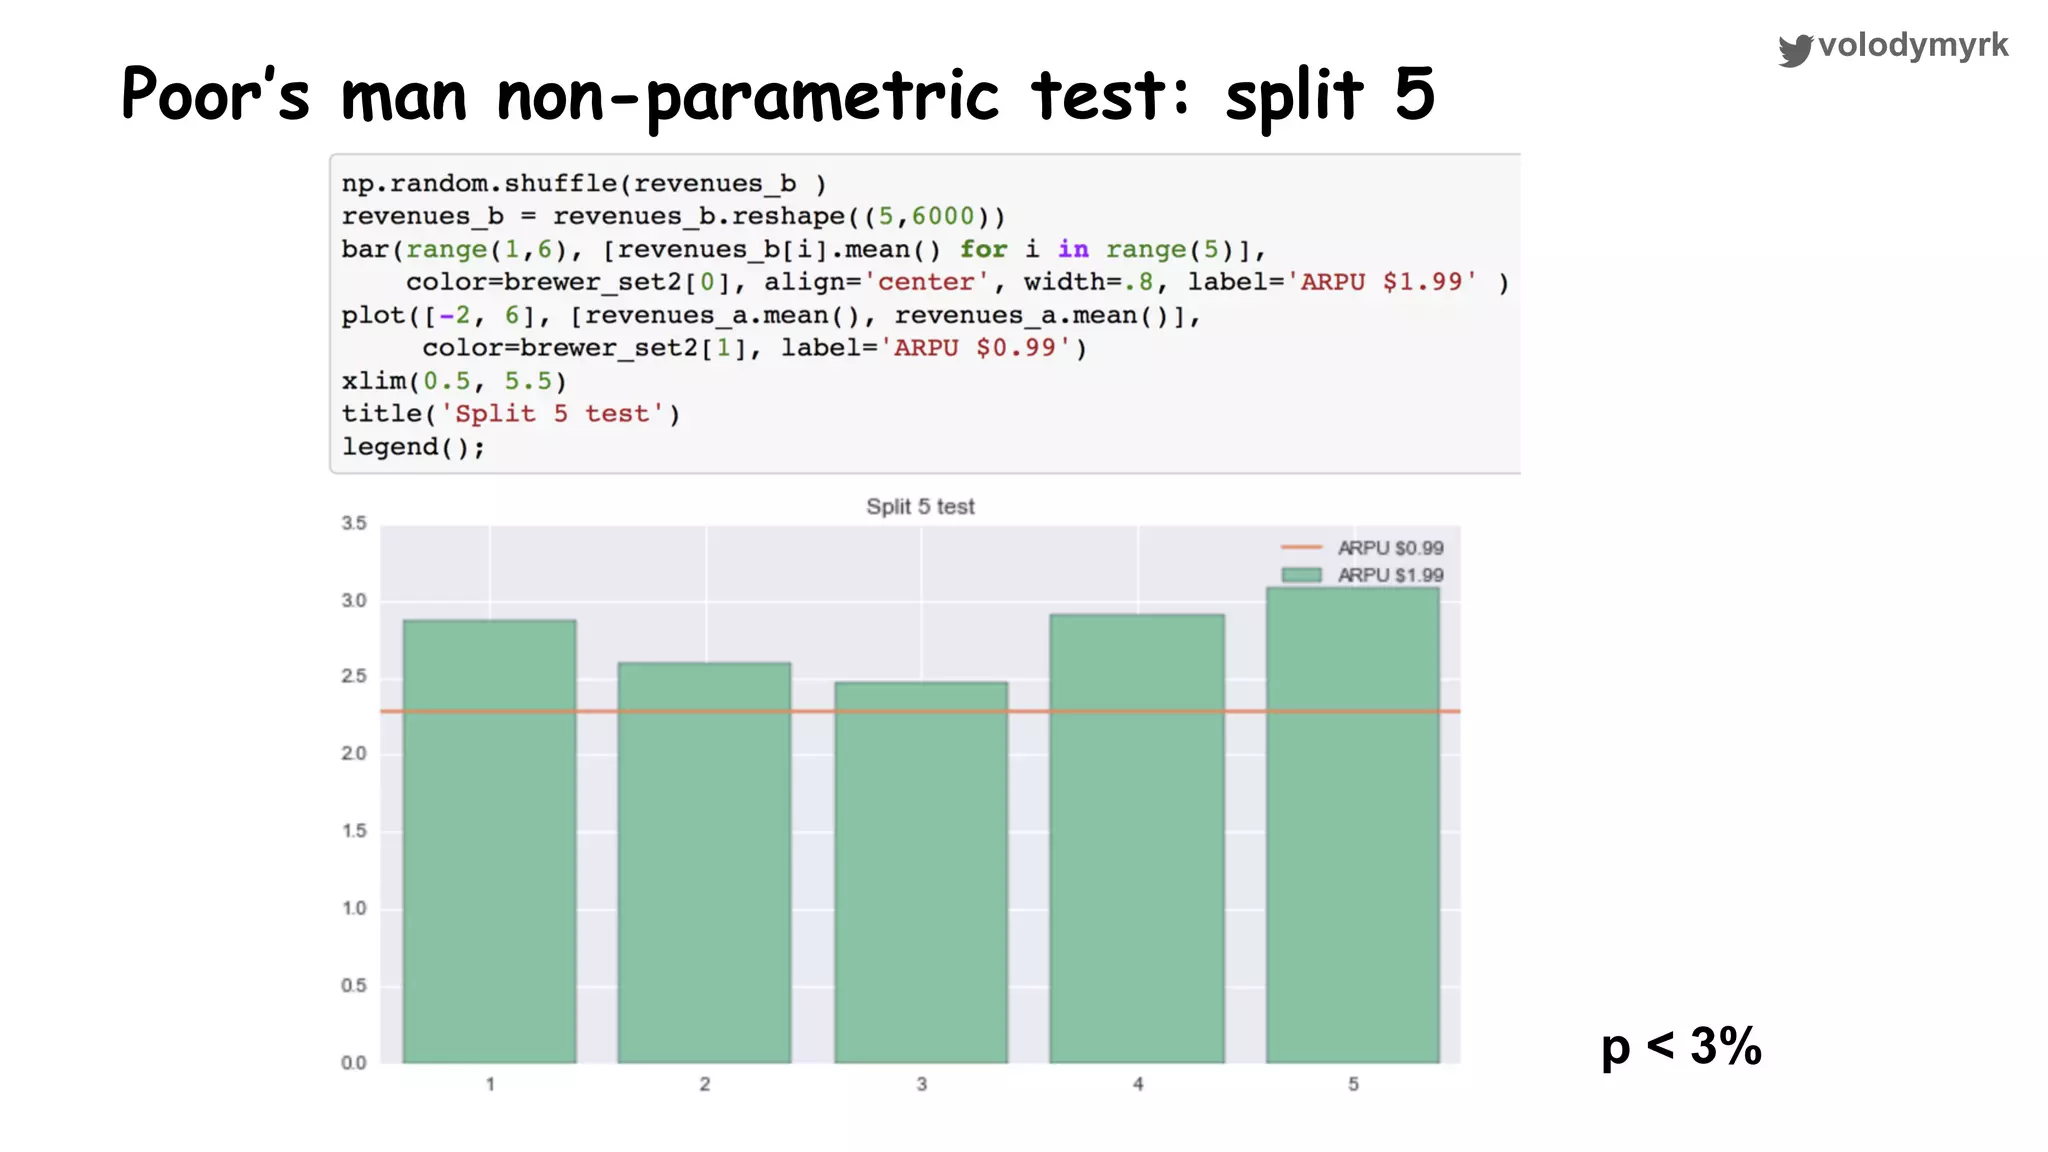
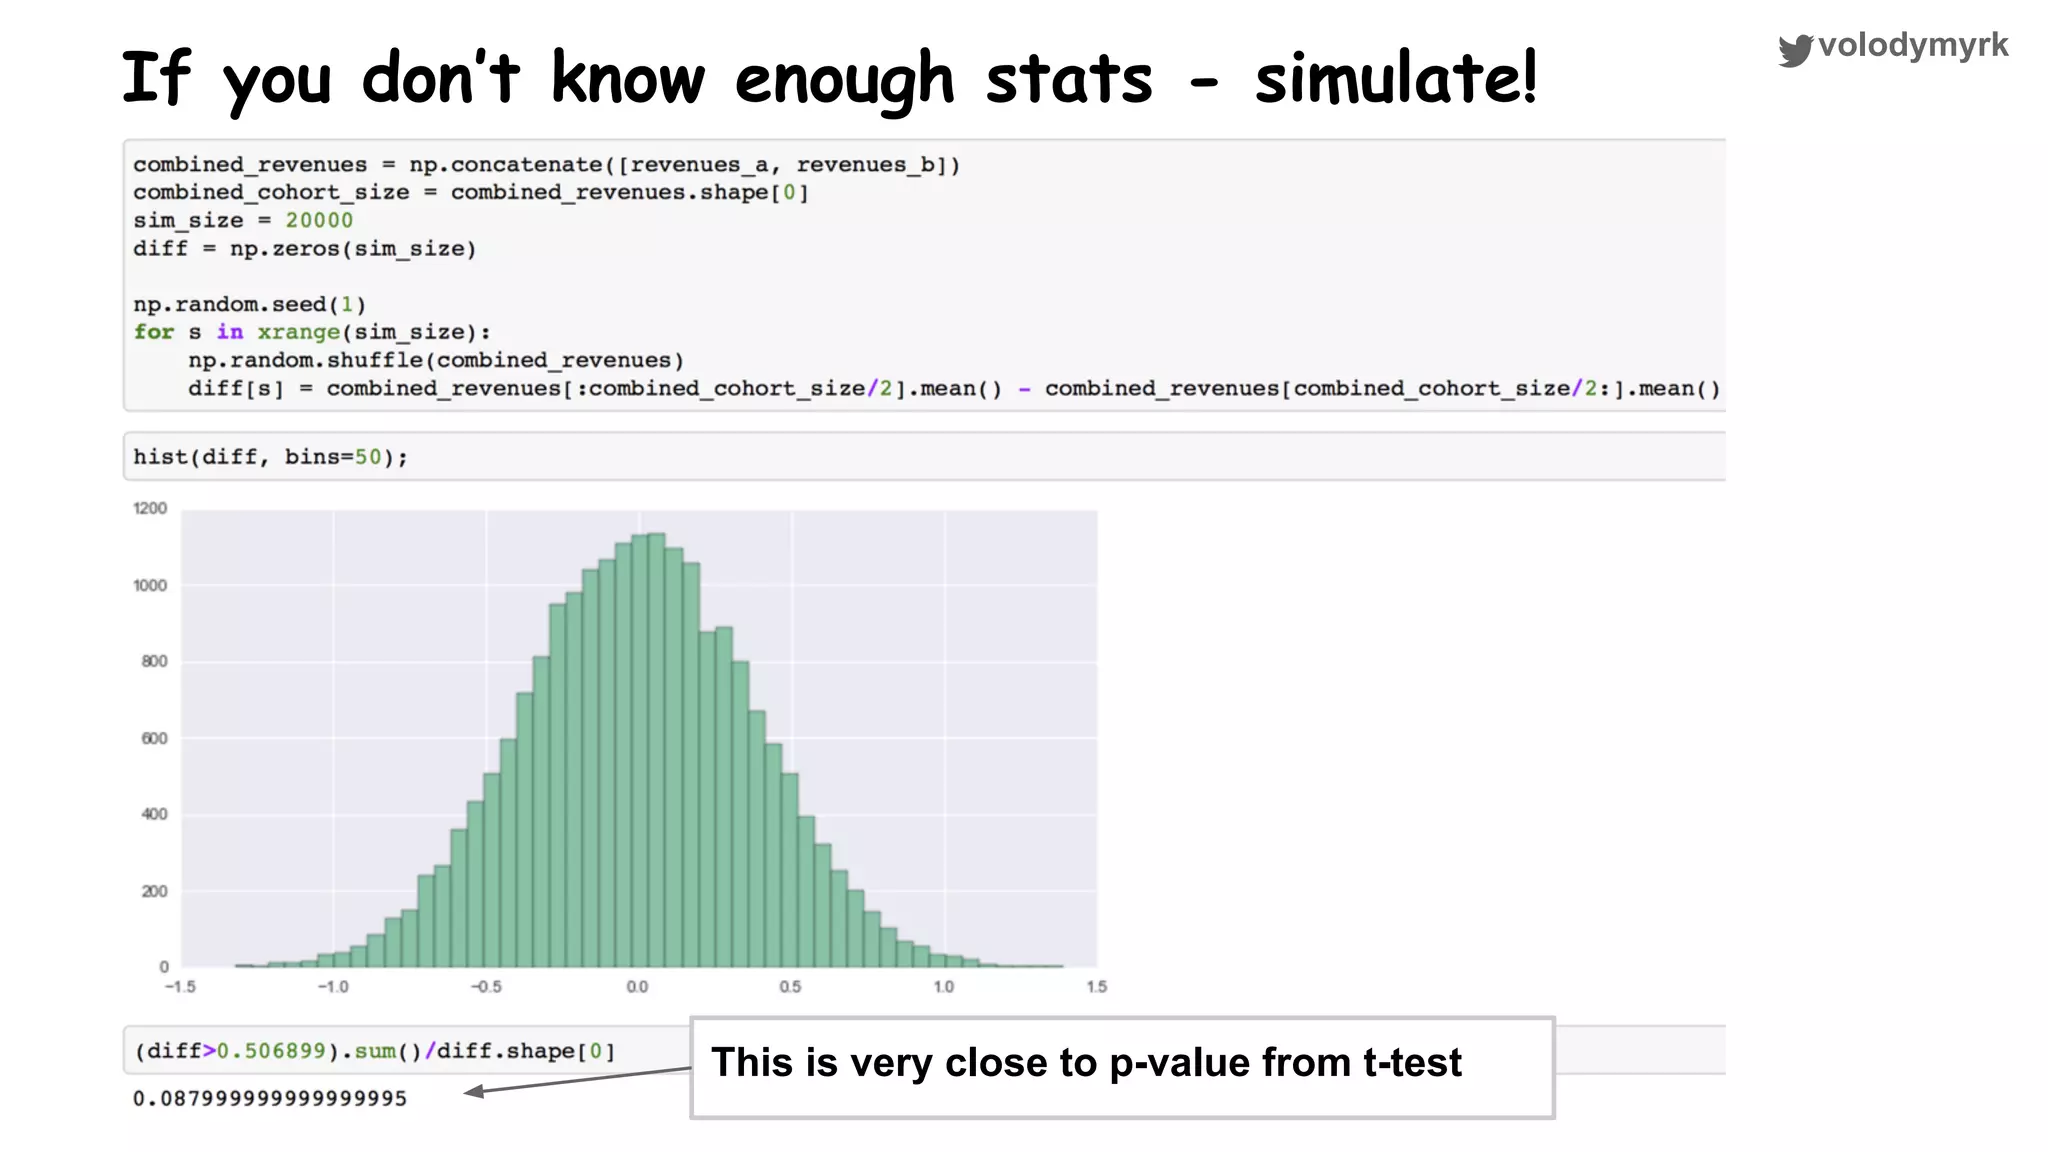
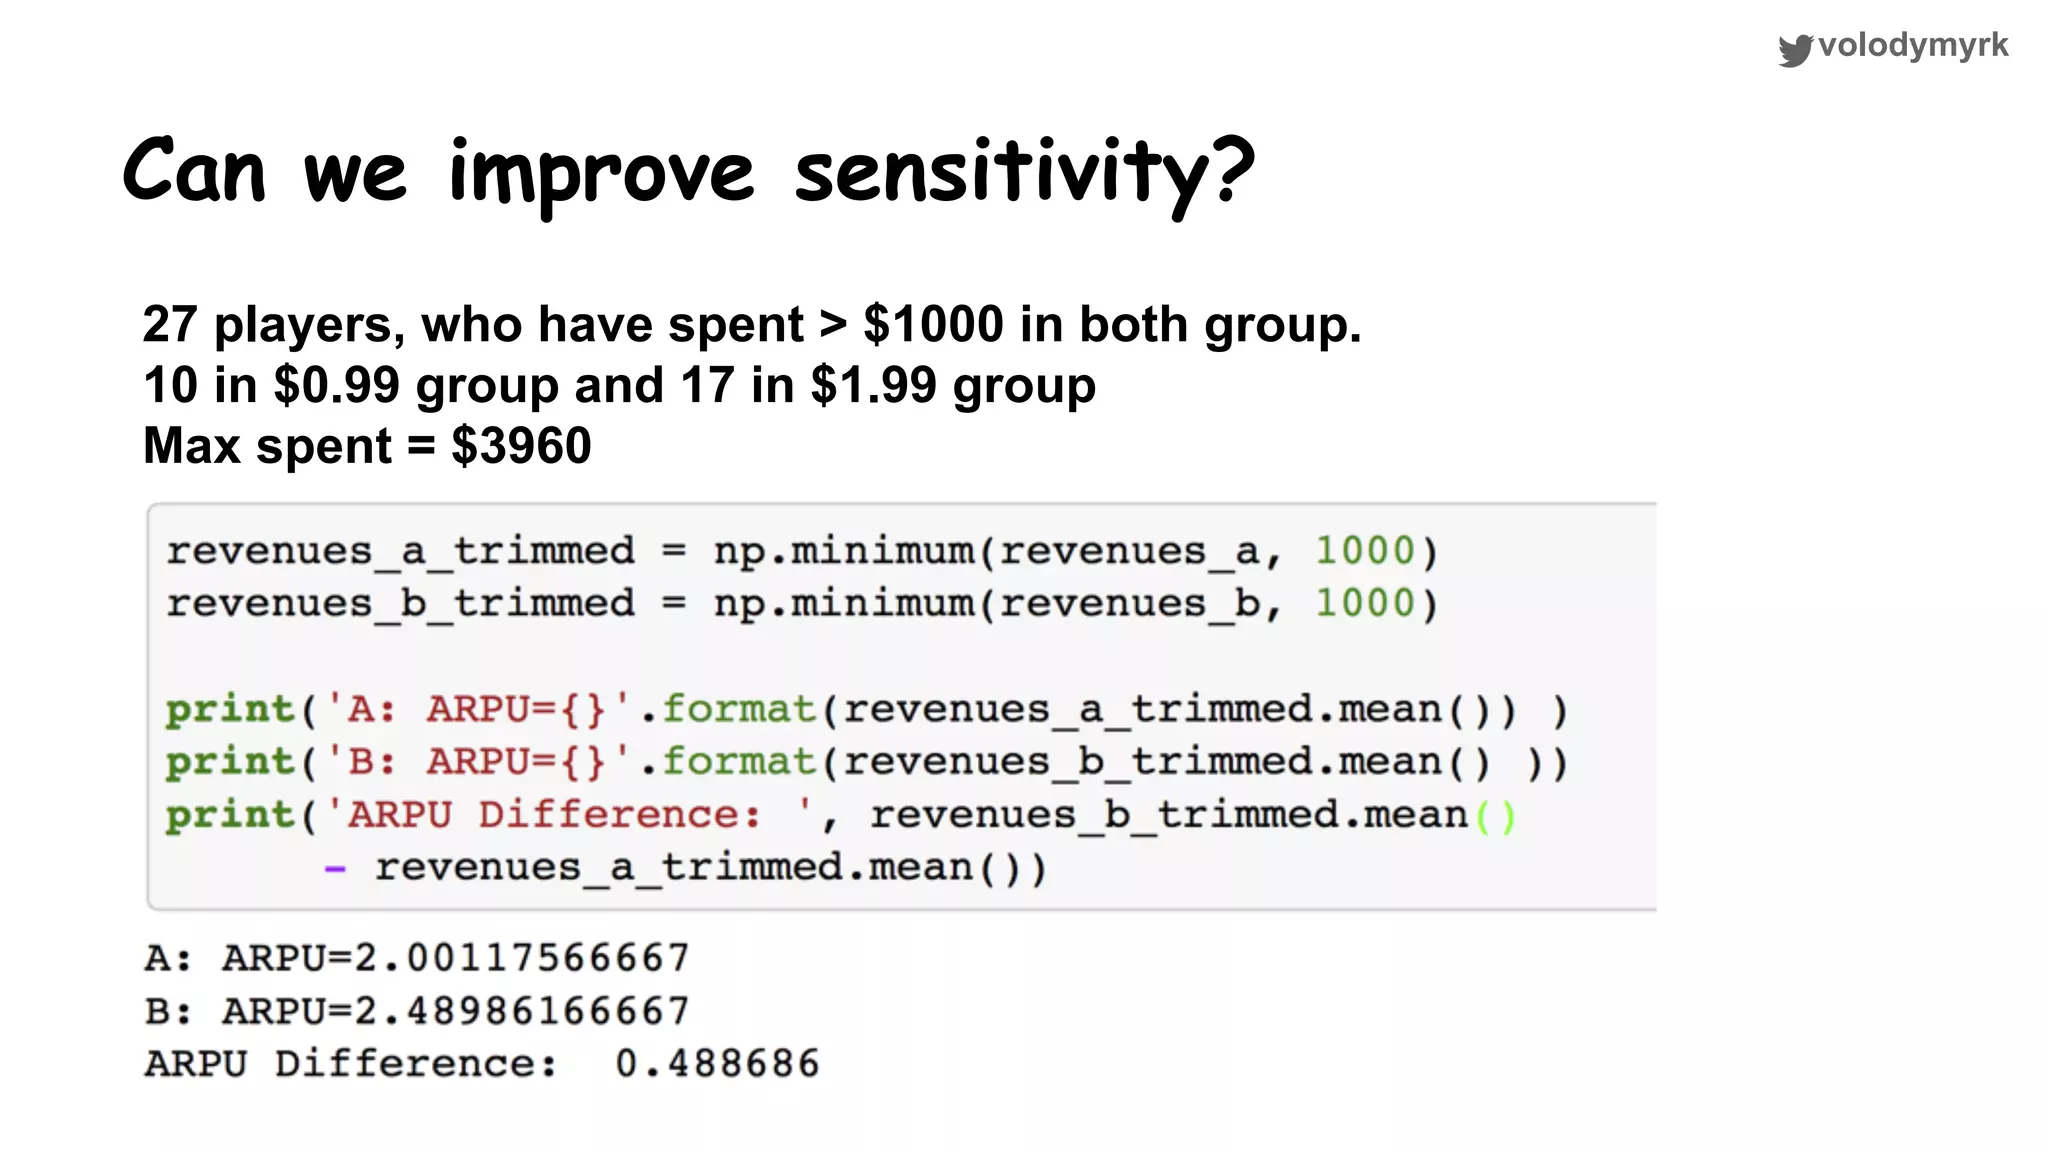
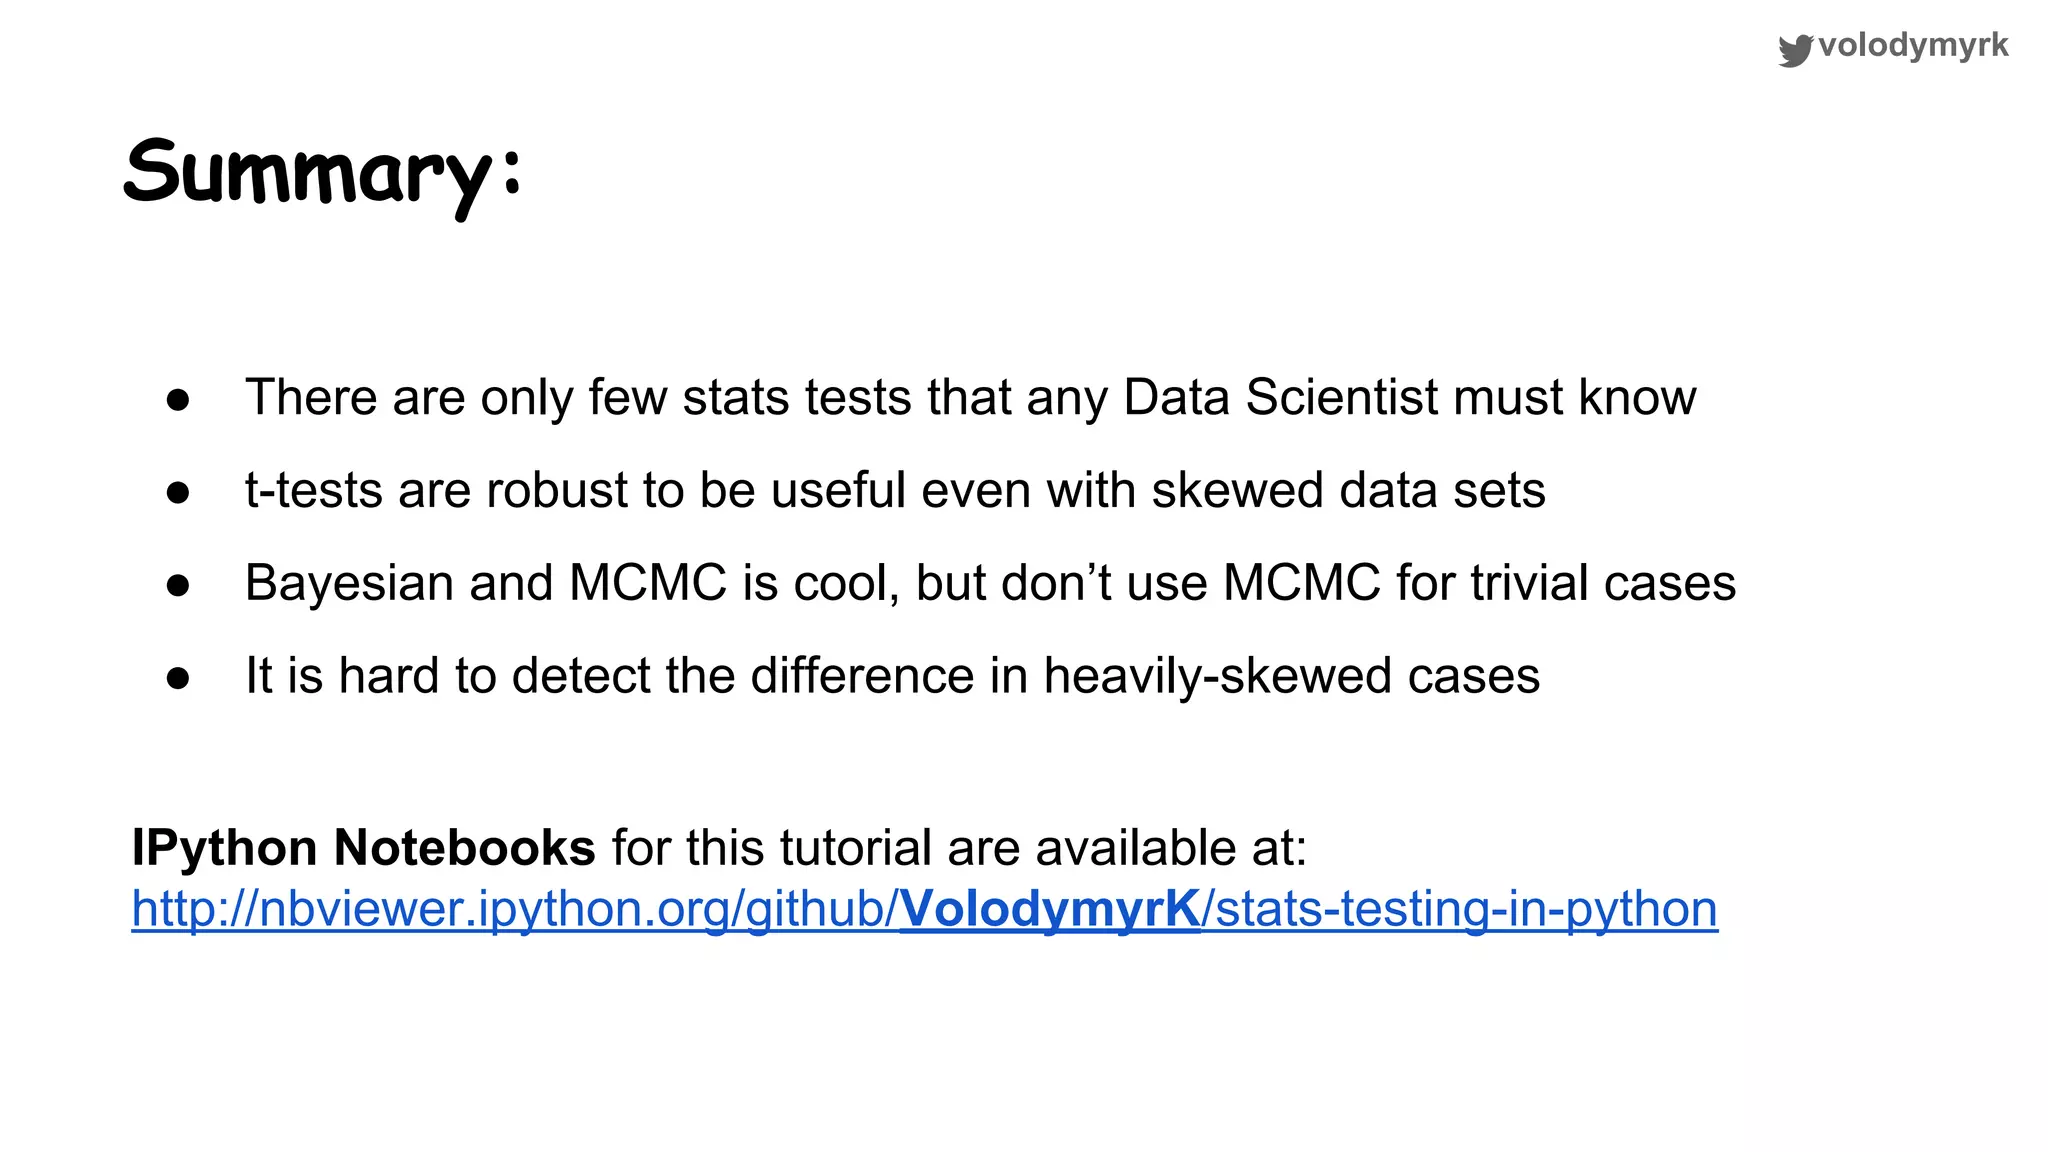
volodymyrk How to conclude online experiments in Python Volodymyr (Vlad) Kazantsev Head of Data Science at Product Madness
volodymyrk
volodymyrk Goal of the tutorial Uncover the “magic” behind statistics used for A/B testing and other online experiments
volodymyrk ● Head of Data Science (Social Gaming) ● Product Manager at King ● MBA at London Business School ● Visual Effect developer (Avatar, Batman, ...) ● MSc in Probability (Kiev Uni, Ukraine) A quick bio Now 2004
volodymyrk Different kinds of tests ● Classic A/B tests ● Long running activities with control groups ● Longitudinal tests
volodymyrk Why bother? ● To test your hypothesis and learn ● To avoid blindly following HiPPOs ● To audit performance of product and marketing teams
volodymyrk Why Stats? ● To separate data from the noise ● To quantify uncertainty
volodymyrk Fruit Crush Epic The Story of almost real mobile game, in the almost real gaming company.. and one Data Scientist
volodymyrk Day-1 3 seconds panic-attack
volodymyrk Day 1 - loading time panic-attack! Fruit Crush Epic
volodymyrkTaxonomy of Classical stat testing Which Test? 1 Sample 2 Samples >2 Samples Mean Proportion Variance σ known σ unknown z-test one sample t-test one sample z-test for proportion Chi-squared test Mean Proportion Variance ANOVA z-test for (μ1 -μ2 ) t-test for (μ1 -μ2 ) z-test or t-test for dependent samples z-test, 2 proportions independent dependent samples σ1 ,σ2 known σ1 ,σ2 unknown F-test
volodymyrk One sample t-test Null Hypothesis: - avg. loading time <=3 seconds for last hour's observation Alternative Hypothesis: - population mean is >3 seconds for last hour's observation Test: - single sample, one-sided t-test.
volodymyrk One sample t-test t_value = t-test(samples, expected mean) p-value: 0.086 probability of obtaining the result as extreme as observed, assuming Null-hypothesis is true t-distribution lookup(t_value, sample_size)
volodymyrk If you want to code it yourself
volodymyrk Stats in Python numpy scipy.stats statsmodels.stats theano pymc3 Classical Bayesian * High-level view. Lot’s of stuff missing here. pymc3 uses statsmodels for GLM
volodymyrk One sample t-test and z-test
volodymyrk Confidence Interval
volodymyrk Confidence Interval for the Mean
volodymyrk Standard Error of the Mean in Python
volodymyrk Next Day
volodymyrk Day-2 OMG, my Retention is low!
volodymyrk Is my day-1 retention low? Day-1 results: installs 448 returned next day 123 Day-1 retention 27.46% Retention target 30% Fruit Crush Epic
volodymyrkTaxonomy of Classical stat testing Which Test? 1 Sample 2 Samples >2 Samples Mean Proportion Variance σ known σ unknown z-test one sample t-test one sample z-test for proportion Chi-squared test Mean Proportion Variance ANOVA z-test for (μ1 -μ2 ) t-test for (μ1 -μ2 ) z-test or t-test for dependent samples z-test, 2 proportions independent dependent samples σ1 ,σ2 known σ1 ,σ2 unknown F-test
volodymyrk One sample z-test for proportion Null Hypothesis: - avg. retention >=30% Alternative Hypothesis: - avg. retention <30% Test: - single sample, one-sided z-test for proportion
volodymyrk In Python...
volodymyrk So what is my confidence interval?
volodymyrk Day-5 Connect with Facebook or Die! The First A/B test
volodymyrk A/B test 1 - connect to Facebook
volodymyrk A/B test design Group A Group B Start Level 1 Start Level 1 Finish Level 1 50% 50% Have seen prompt 2501 Connected 1104 Connect rate 44.1% Have seen prompt 2141 Connected 1076 Connect rate 50.2% Fruit Crush Epic
volodymyrk Is it statistically significant? Fruit Crush Epic
volodymyrkTaxonomy of Classical stat testing Which Test? 1 Sample 2 Samples >2 Samples Mean Proportion Variance σ known σ unknown z-test one sample t-test one sample z-test for proportion Chi-squared test Mean Proportion Variance ANOVA z-test for (μ1 -μ2 ) t-test for (μ1 -μ2 ) z-test or t-test for dependent samples z-test, 2 proportions independent dependent samples σ1 ,σ2 known σ1 ,σ2 unknown F-test
volodymyrk Two samples z-test for proportion Null Hypothesis: - avg. connection rate is the same. P1 = P2 Alternative Hypothesis: - P1 ≠ P2 Test: - two samples z-test for proportion. Two sided
volodymyrk Two samples z-test for proportion in Python
volodymyrk Confidence interval for difference in proportion
volodymyrk In Python
volodymyrk What should we measure, exactly? 1000 1000 150 400 450 30 390 430 160 840 40 400 400 connected: 47% retained: 82% connected: 50% retained: 80%Start Level 1 Start Level 1 Start Level 2 Start Level 2
volodymyrk What about Bayesian Stats?
volodymyrk Bayesian Credible Interval vs. CI
volodymyrk Day-30 Do you want to buy last chance? A/B testing Revenue
volodymyrk How much an extra life is worth? LOSER!!! Purchase another chance for only.. $0.99 LOSER!!! Purchase another chance for only.. $1.99 Fruit Crush Epic
volodymyrk How we are going to test it? Consider ● There are multiple items to buy in game (lives, boosters, blenders, etc) ● We expect more people to make a $0.99 purchase, so we hope to make more money overall, even at lower price A/B test Design ● We will show A/B test to new users only ● Will run for 2 months ● We will measure overall revenue per user in the first 30 days ● Null-hypothesis: we make more money from $0.99 group Measurements ● Difference in Average Revenue Per User (ARPU) in 30 days ● Difference in Conversion Rate (%% of users who make at least 1 purchase)
volodymyrk Results count 450 390 mean 151.9 214.2 25% 20.8 26.5 50% 55.3 69.4 75% 147.3 231.3 max 3960 3647.8 Fruit Crush Epic * random generator used in the example is available in ipython notebooks ** distribution is made more extreme than what is normally observed in casual game, like our imaginary match-3 title
volodymyrk Results 30,000 users in each group 450 payers 390 payers p-value = 0.037 Significant p-value = ??? Is it Significant?
volodymyrkTaxonomy of Classical stat testing Which Test? 1 Sample 2 Samples >2 Samples Mean Proportion Variance σ known σ unknown z-test one sample t-test one sample z-test for proportion Chi-squared test Mean Proportion Variance ANOVA z-test for (μ1 -μ2 ) t-test for (μ1 -μ2 ) z-test or t-test for dependent samples z-test, 2 proportions independent dependent samples σ1 ,σ2 known σ1 ,σ2 unknown F-test
volodymyrk Welch's t-test (σ1 ≠σ2 ) Can we actually use t-test?
volodymyrk Poor’s man non-parametric test: split 5 p < 3%
volodymyrk If you don’t know enough stats - simulate! This is very close to p-value from t-test
volodymyrk Can we improve sensitivity? 27 players, who have spent > $1000 in both group. 10 in $0.99 group and 17 in $1.99 group Max spent = $3960
volodymyrk And we re-run our analysis Again, we can use t-test
volodymyrk Final Thoughts
volodymyrk Can we analyse distributions? You can quantify difference between two curves Area under the curve is Average Revenue per User Fruit Crush Epic * random generator used in the example is available in ipython notebooks ** distribution is made more extreme than what is normally observed in casual game, like our imaginary match-3 title
volodymyrk Is 30 day revenue a good metric? LTV projection A LTV projection B Fruit Crush Epic
volodymyrk Summary: ● There are only few stats tests that any Data Scientist must know ● t-tests are robust to be useful even with skewed data sets ● Bayesian and MCMC is cool, but don’t use MCMC for trivial cases ● It is hard to detect the difference in heavily-skewed cases IPython Notebooks for this tutorial are available at: http://nbviewer.ipython.org/github/VolodymyrK/stats-testing-in-python

How to conclude online experiments in python

  • 1.
    volodymyrk How to conclude onlineexperiments in Python Volodymyr (Vlad) Kazantsev Head of Data Science at Product Madness
  • 2.
  • 3.
    volodymyrk Goal of thetutorial Uncover the “magic” behind statistics used for A/B testing and other online experiments
  • 4.
    volodymyrk ● Head ofData Science (Social Gaming) ● Product Manager at King ● MBA at London Business School ● Visual Effect developer (Avatar, Batman, ...) ● MSc in Probability (Kiev Uni, Ukraine) A quick bio Now 2004
  • 5.
    volodymyrk Different kinds oftests ● Classic A/B tests ● Long running activities with control groups ● Longitudinal tests
  • 6.
    volodymyrk Why bother? ● Totest your hypothesis and learn ● To avoid blindly following HiPPOs ● To audit performance of product and marketing teams
  • 7.
    volodymyrk Why Stats? ● Toseparate data from the noise ● To quantify uncertainty
  • 8.
    volodymyrk Fruit Crush Epic TheStory of almost real mobile game, in the almost real gaming company.. and one Data Scientist
  • 9.
  • 10.
    volodymyrk Day 1 -loading time panic-attack! Fruit Crush Epic
  • 11.
    volodymyrkTaxonomy of Classicalstat testing Which Test? 1 Sample 2 Samples >2 Samples Mean Proportion Variance σ known σ unknown z-test one sample t-test one sample z-test for proportion Chi-squared test Mean Proportion Variance ANOVA z-test for (μ1 -μ2 ) t-test for (μ1 -μ2 ) z-test or t-test for dependent samples z-test, 2 proportions independent dependent samples σ1 ,σ2 known σ1 ,σ2 unknown F-test
  • 12.
    volodymyrkTaxonomy of Classicalstat testing Which Test? 1 Sample 2 Samples >2 Samples Mean Proportion Variance σ known σ unknown z-test one sample t-test one sample z-test for proportion Chi-squared test Mean Proportion Variance ANOVA z-test for (μ1 -μ2 ) t-test for (μ1 -μ2 ) z-test or t-test for dependent samples z-test, 2 proportions independent dependent samples σ1 ,σ2 known σ1 ,σ2 unknown F-test
  • 13.
    volodymyrk One sample t-test NullHypothesis: - avg. loading time <=3 seconds for last hour's observation Alternative Hypothesis: - population mean is >3 seconds for last hour's observation Test: - single sample, one-sided t-test.
  • 14.
    volodymyrk One sample t-test t_value= t-test(samples, expected mean) p-value: 0.086 probability of obtaining the result as extreme as observed, assuming Null-hypothesis is true t-distribution lookup(t_value, sample_size)
  • 15.
    volodymyrk If you wantto code it yourself
  • 16.
    volodymyrk Stats in Python numpy scipy.stats statsmodels.stats theano pymc3 ClassicalBayesian * High-level view. Lot’s of stuff missing here. pymc3 uses statsmodels for GLM
  • 17.
  • 18.
  • 19.
  • 20.
    volodymyrk Standard Error ofthe Mean in Python
  • 21.
  • 22.
  • 23.
    volodymyrk Is my day-1retention low? Day-1 results: installs 448 returned next day 123 Day-1 retention 27.46% Retention target 30% Fruit Crush Epic
  • 24.
    volodymyrkTaxonomy of Classicalstat testing Which Test? 1 Sample 2 Samples >2 Samples Mean Proportion Variance σ known σ unknown z-test one sample t-test one sample z-test for proportion Chi-squared test Mean Proportion Variance ANOVA z-test for (μ1 -μ2 ) t-test for (μ1 -μ2 ) z-test or t-test for dependent samples z-test, 2 proportions independent dependent samples σ1 ,σ2 known σ1 ,σ2 unknown F-test
  • 25.
    volodymyrk One sample z-testfor proportion Null Hypothesis: - avg. retention >=30% Alternative Hypothesis: - avg. retention <30% Test: - single sample, one-sided z-test for proportion
  • 26.
  • 27.
    volodymyrk So what ismy confidence interval?
  • 28.
    volodymyrk Day-5 Connect with Facebookor Die! The First A/B test
  • 29.
    volodymyrk A/B test 1- connect to Facebook
  • 30.
    volodymyrk A/B test design GroupA Group B Start Level 1 Start Level 1 Finish Level 1 50% 50% Have seen prompt 2501 Connected 1104 Connect rate 44.1% Have seen prompt 2141 Connected 1076 Connect rate 50.2% Fruit Crush Epic
  • 31.
    volodymyrk Is it statisticallysignificant? Fruit Crush Epic
  • 32.
    volodymyrkTaxonomy of Classicalstat testing Which Test? 1 Sample 2 Samples >2 Samples Mean Proportion Variance σ known σ unknown z-test one sample t-test one sample z-test for proportion Chi-squared test Mean Proportion Variance ANOVA z-test for (μ1 -μ2 ) t-test for (μ1 -μ2 ) z-test or t-test for dependent samples z-test, 2 proportions independent dependent samples σ1 ,σ2 known σ1 ,σ2 unknown F-test
  • 33.
    volodymyrk Two samples z-testfor proportion Null Hypothesis: - avg. connection rate is the same. P1 = P2 Alternative Hypothesis: - P1 ≠ P2 Test: - two samples z-test for proportion. Two sided
  • 34.
    volodymyrk Two samples z-testfor proportion in Python
  • 35.
    volodymyrk Confidence interval fordifference in proportion
  • 36.
  • 37.
    volodymyrk What should wemeasure, exactly? 1000 1000 150 400 450 30 390 430 160 840 40 400 400 connected: 47% retained: 82% connected: 50% retained: 80%Start Level 1 Start Level 1 Start Level 2 Start Level 2
  • 38.
  • 39.
  • 40.
    volodymyrk Day-30 Do you wantto buy last chance? A/B testing Revenue
  • 41.
    volodymyrk How much anextra life is worth? LOSER!!! Purchase another chance for only.. $0.99 LOSER!!! Purchase another chance for only.. $1.99 Fruit Crush Epic
  • 42.
    volodymyrk How we aregoing to test it? Consider ● There are multiple items to buy in game (lives, boosters, blenders, etc) ● We expect more people to make a $0.99 purchase, so we hope to make more money overall, even at lower price A/B test Design ● We will show A/B test to new users only ● Will run for 2 months ● We will measure overall revenue per user in the first 30 days ● Null-hypothesis: we make more money from $0.99 group Measurements ● Difference in Average Revenue Per User (ARPU) in 30 days ● Difference in Conversion Rate (%% of users who make at least 1 purchase)
  • 43.
    volodymyrk Results count 450 390 mean151.9 214.2 25% 20.8 26.5 50% 55.3 69.4 75% 147.3 231.3 max 3960 3647.8 Fruit Crush Epic * random generator used in the example is available in ipython notebooks ** distribution is made more extreme than what is normally observed in casual game, like our imaginary match-3 title
  • 44.
    volodymyrk Results 30,000 users ineach group 450 payers 390 payers p-value = 0.037 Significant p-value = ??? Is it Significant?
  • 45.
    volodymyrkTaxonomy of Classicalstat testing Which Test? 1 Sample 2 Samples >2 Samples Mean Proportion Variance σ known σ unknown z-test one sample t-test one sample z-test for proportion Chi-squared test Mean Proportion Variance ANOVA z-test for (μ1 -μ2 ) t-test for (μ1 -μ2 ) z-test or t-test for dependent samples z-test, 2 proportions independent dependent samples σ1 ,σ2 known σ1 ,σ2 unknown F-test
  • 46.
  • 47.
  • 48.
    volodymyrk If you don’tknow enough stats - simulate! This is very close to p-value from t-test
  • 49.
    volodymyrk Can we improvesensitivity? 27 players, who have spent > $1000 in both group. 10 in $0.99 group and 17 in $1.99 group Max spent = $3960
  • 50.
    volodymyrk And we re-runour analysis Again, we can use t-test
  • 51.
  • 52.
    volodymyrk Can we analysedistributions? You can quantify difference between two curves Area under the curve is Average Revenue per User Fruit Crush Epic * random generator used in the example is available in ipython notebooks ** distribution is made more extreme than what is normally observed in casual game, like our imaginary match-3 title
  • 53.
    volodymyrk Is 30 dayrevenue a good metric? LTV projection A LTV projection B Fruit Crush Epic
  • 54.
    volodymyrk Summary: ● There areonly few stats tests that any Data Scientist must know ● t-tests are robust to be useful even with skewed data sets ● Bayesian and MCMC is cool, but don’t use MCMC for trivial cases ● It is hard to detect the difference in heavily-skewed cases IPython Notebooks for this tutorial are available at: http://nbviewer.ipython.org/github/VolodymyrK/stats-testing-in-python