Fault Interaction and its Repercussions Nicholas DiGiuseppe James A. Jones UC Irvine Spider Lab
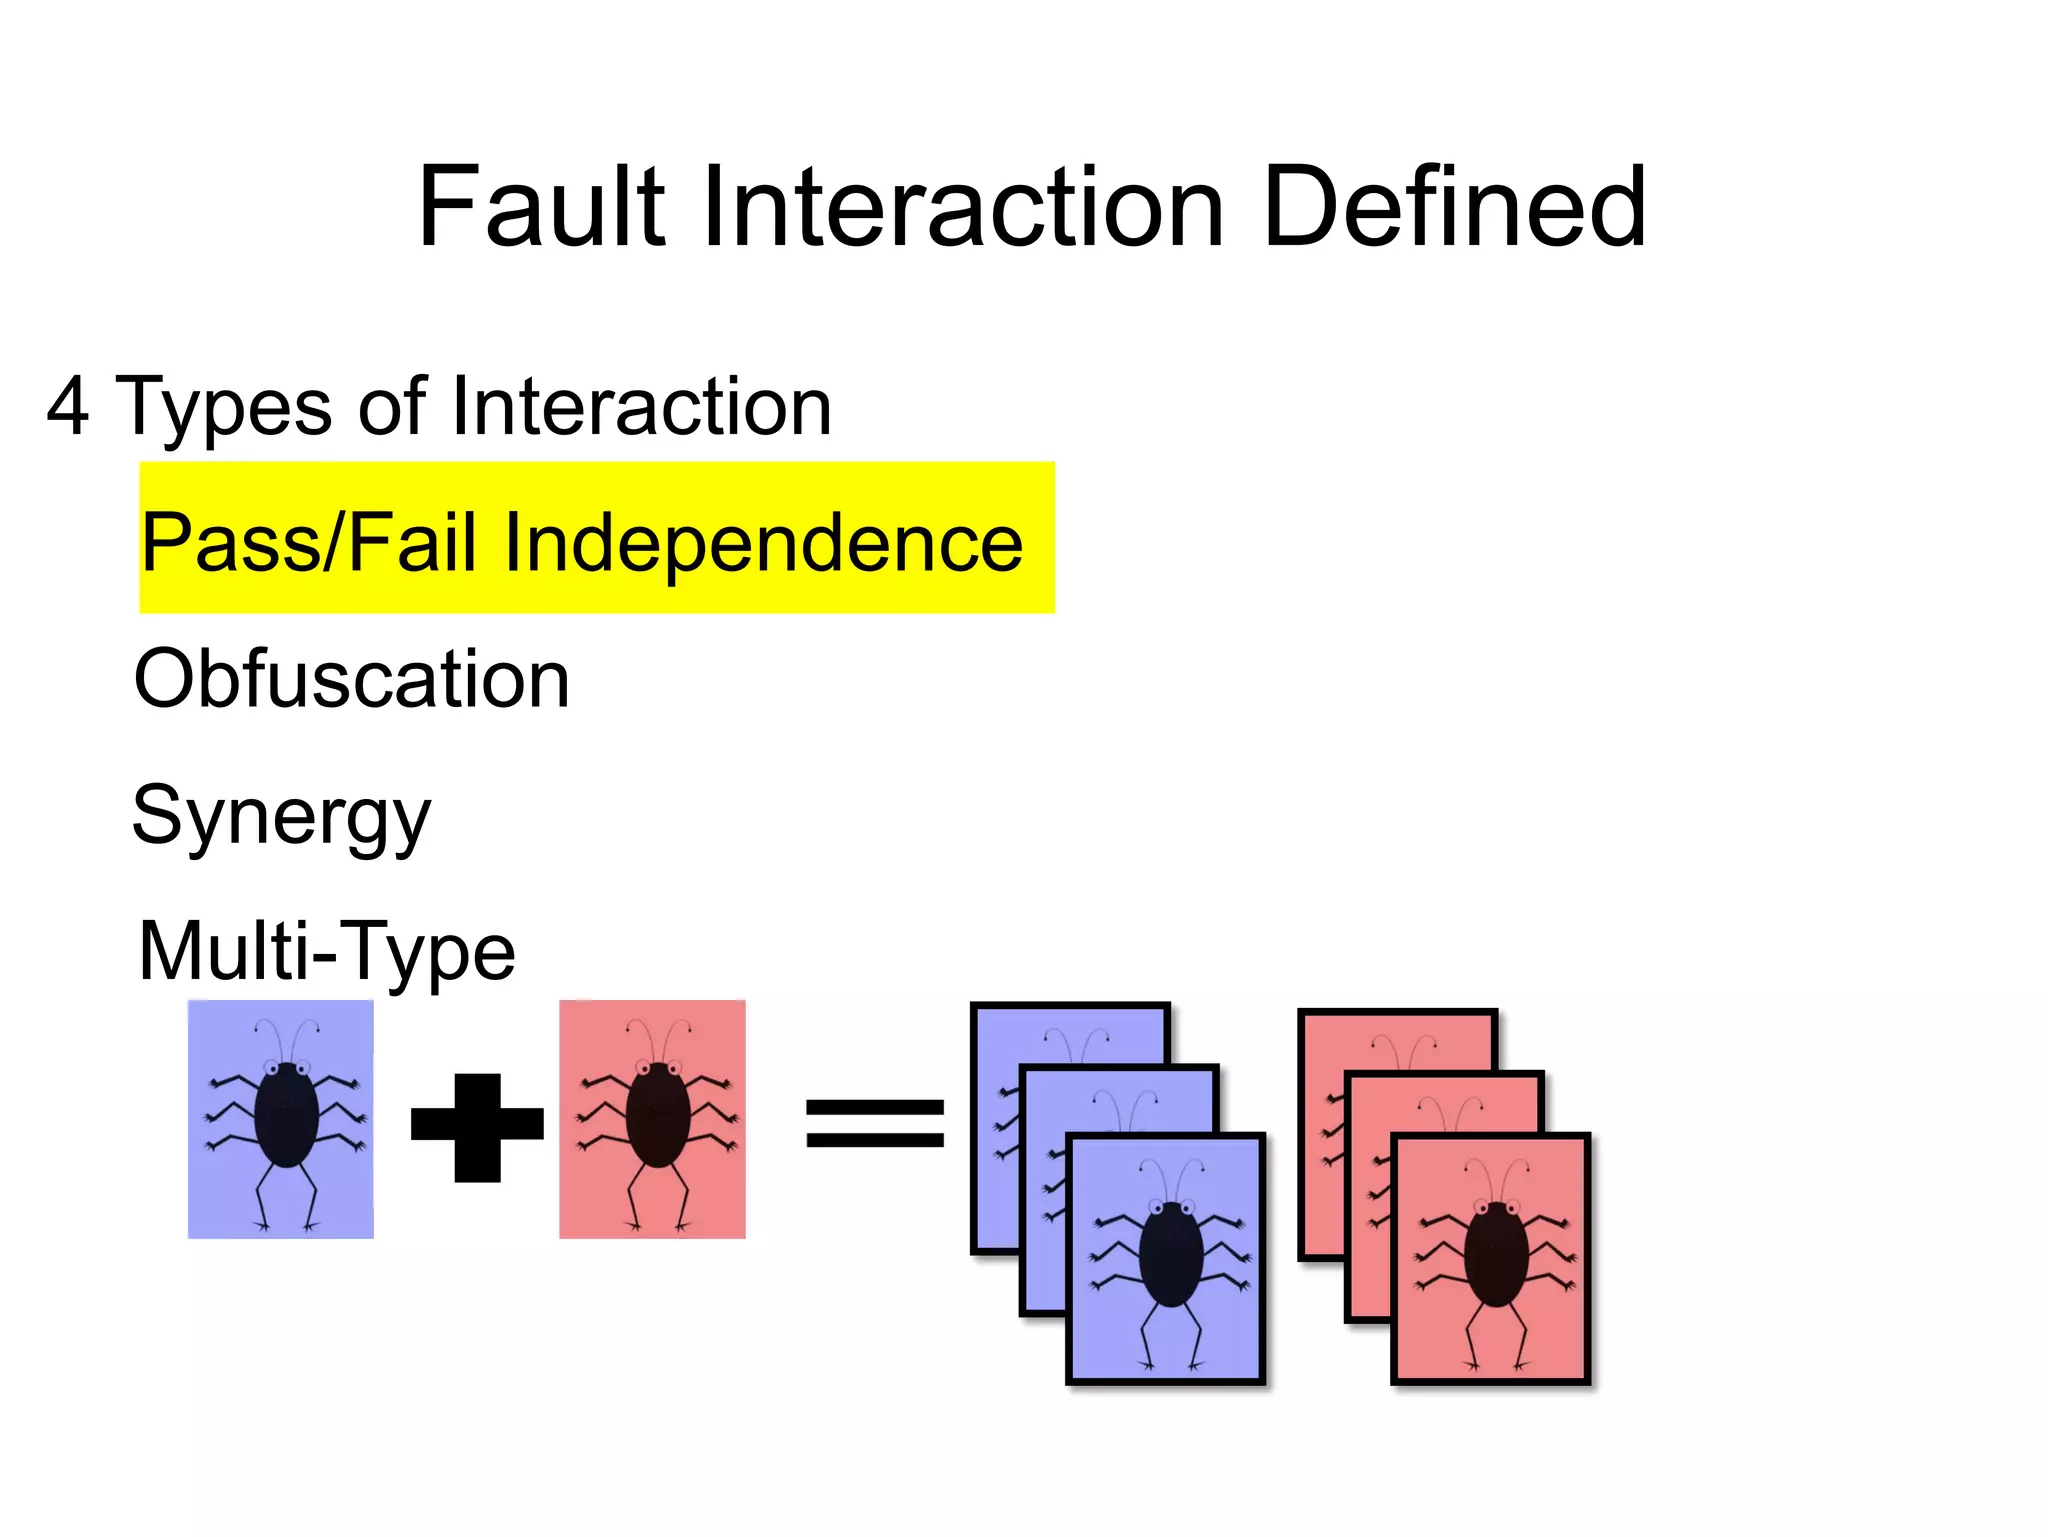
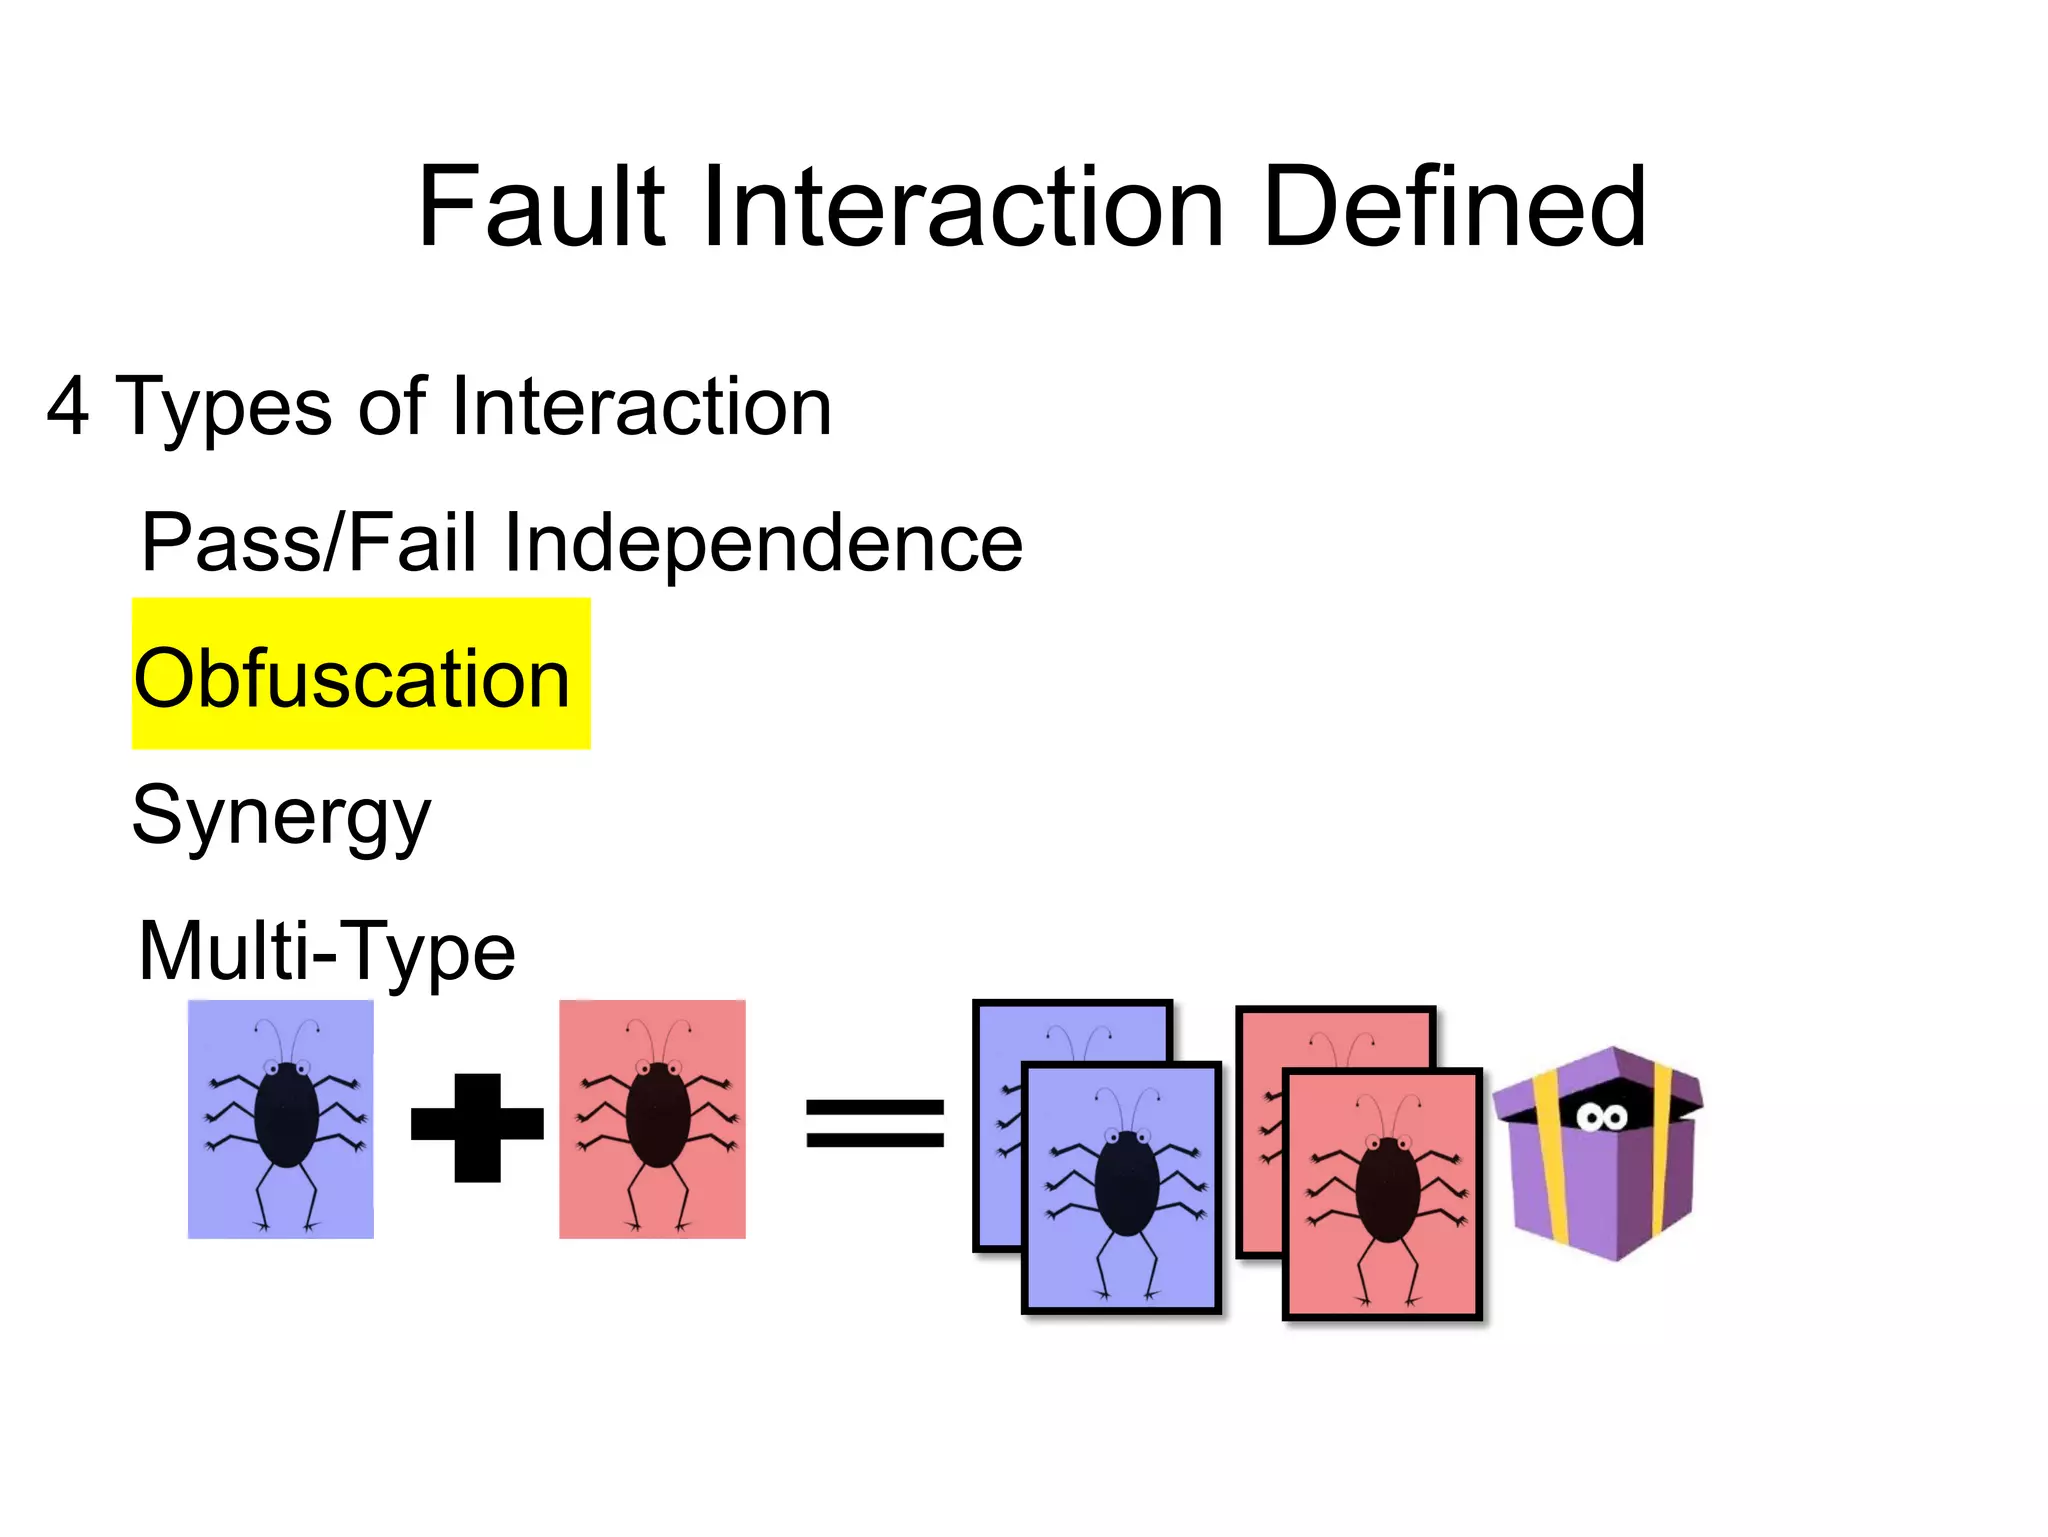
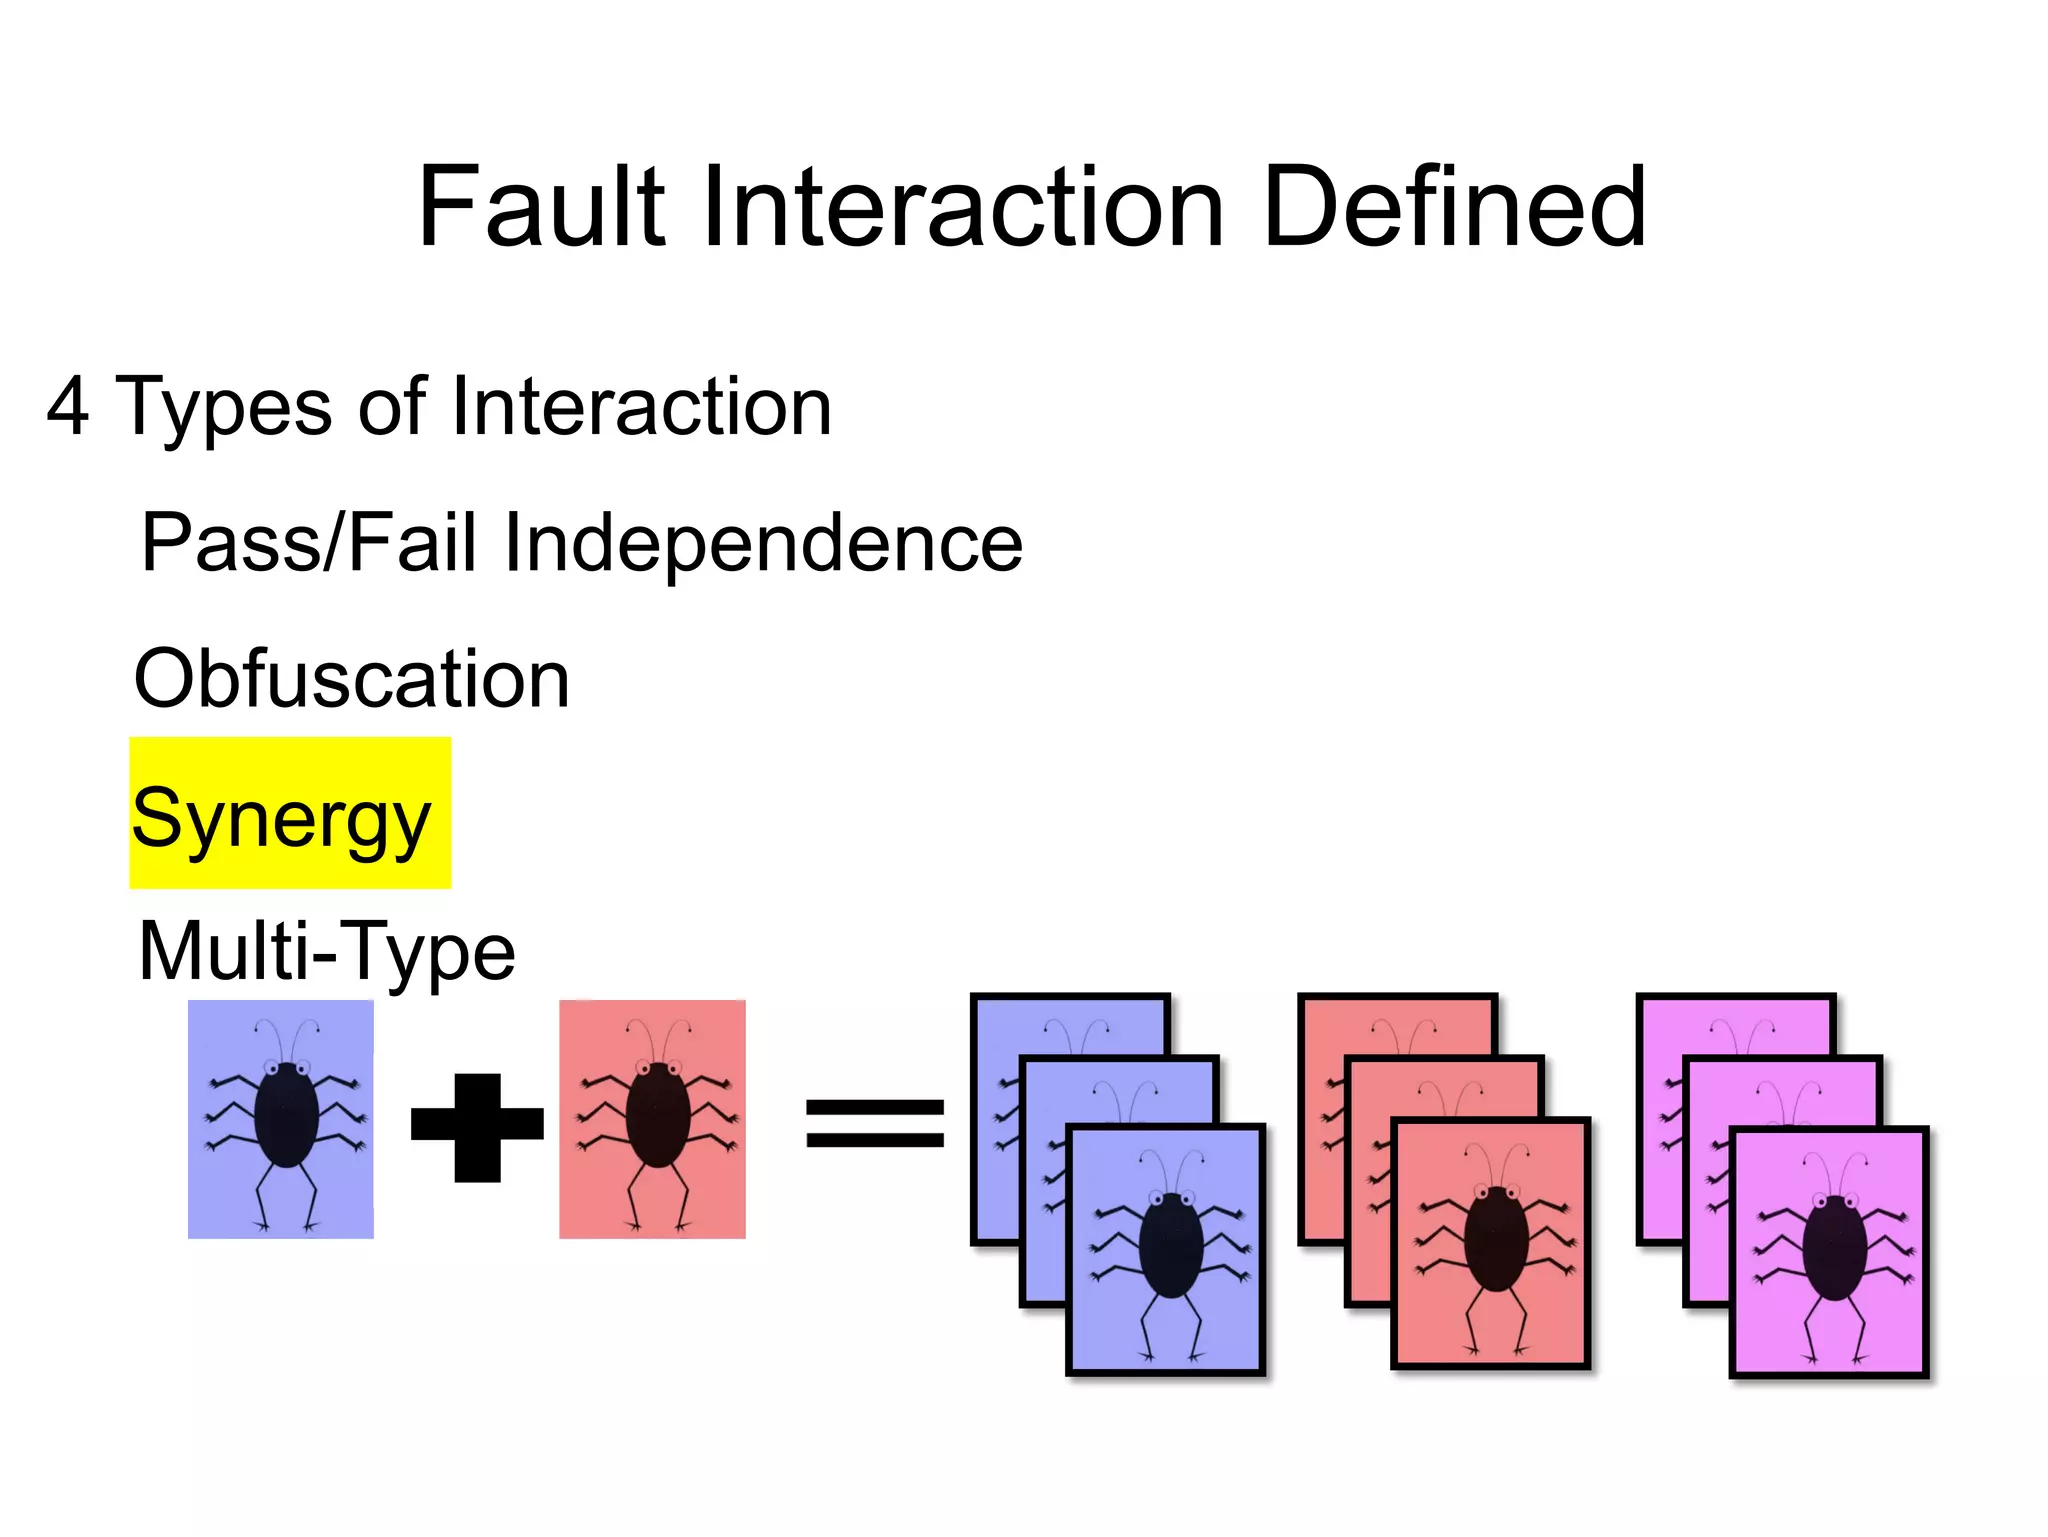
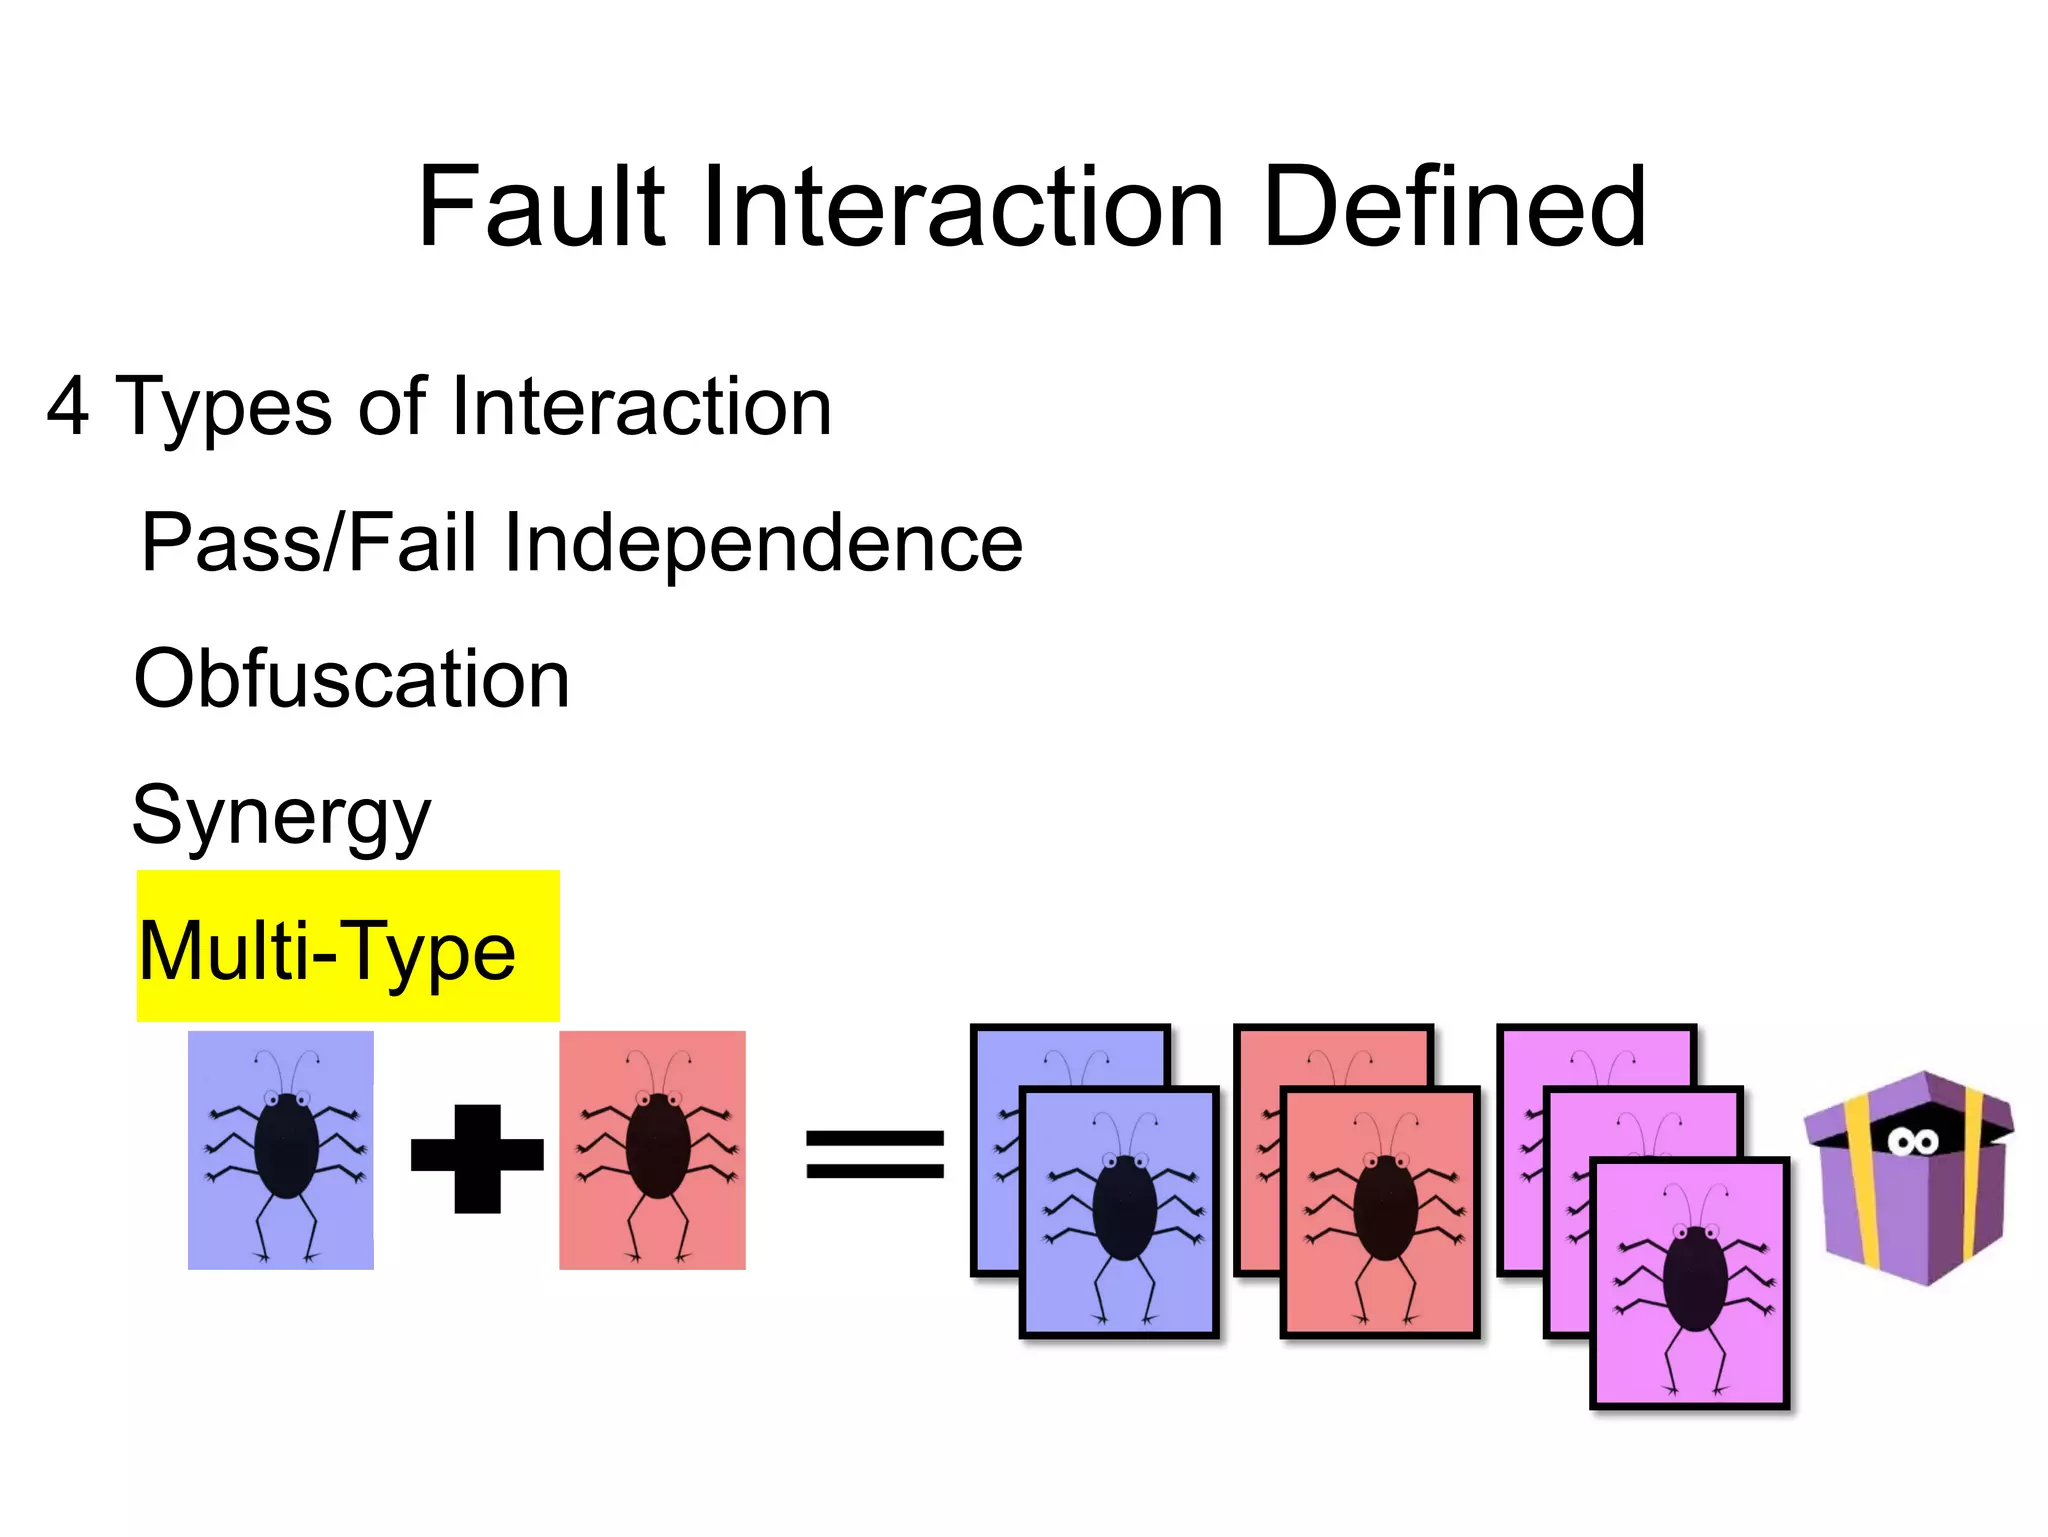
Fault Interaction Defined 4 Types of Interaction Pass/Fail Independence Obfuscation Synergy Multi-Type
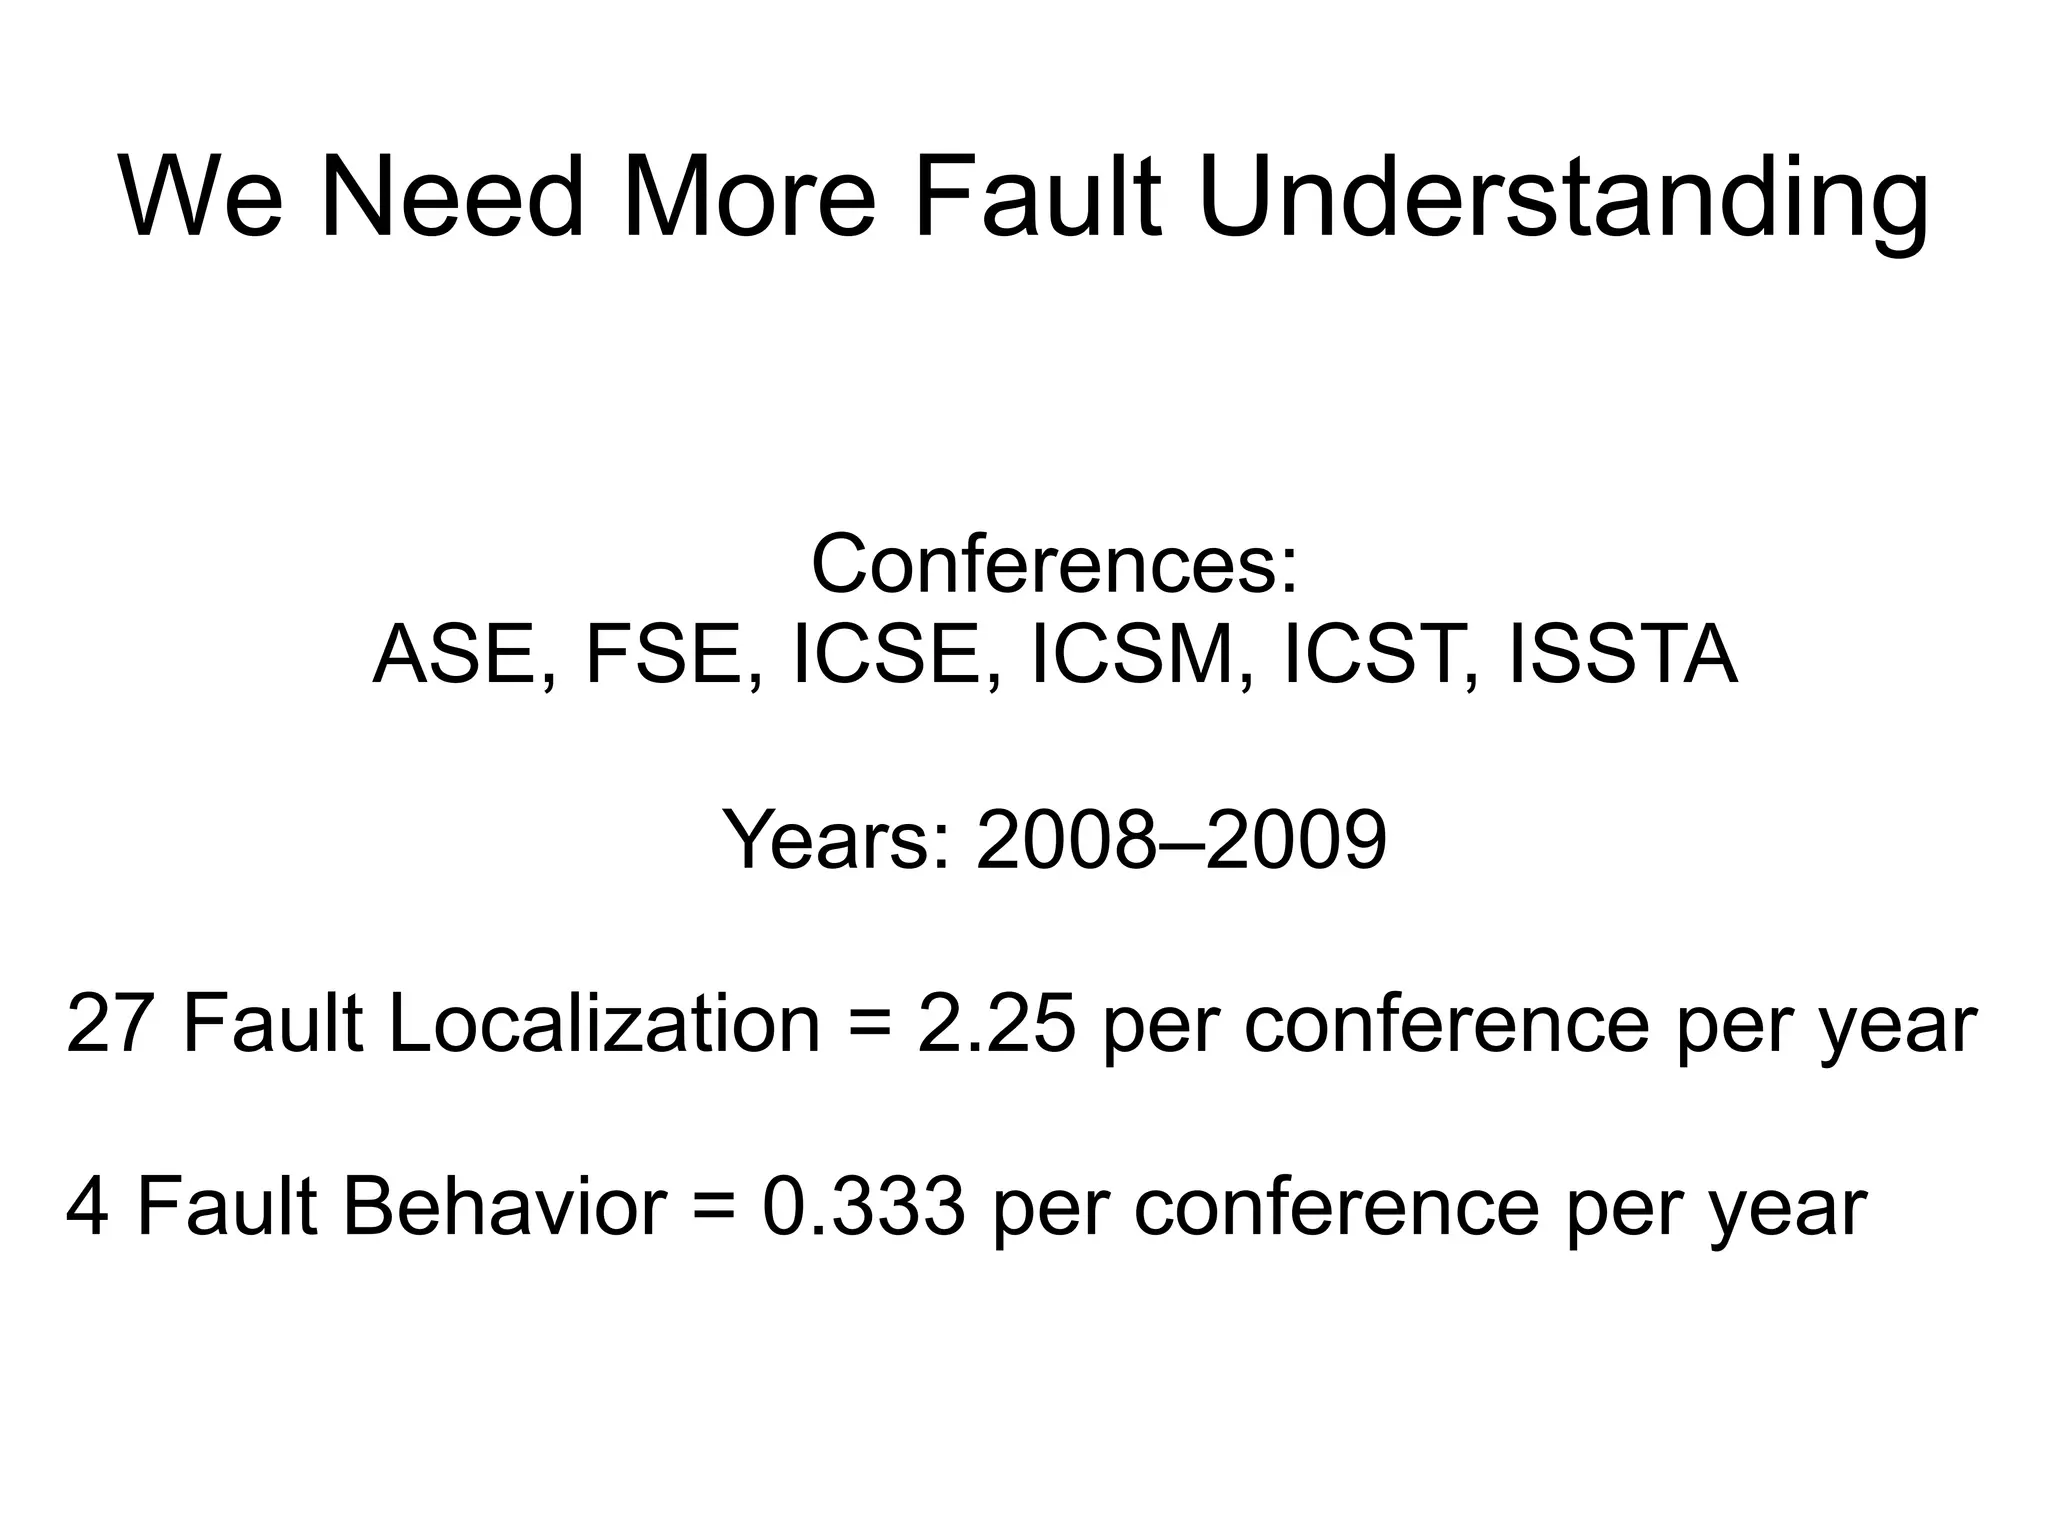
We Need More Fault Understanding Conferences: ASE, FSE, ICSE, ICSM, ICST, ISSTA Years: 2008–2009 27 Fault Localization = 2.25 per conference per year 4 Fault Behavior = 0.333 per conference per year
Motivating Example X = input [0] - 2 Y = input [0] - 2 If (X == Y) print 1 else print 0 Expected Actual Pass/Fail Results Results Status Test Case 1: input [0,0] 1 1 Pass Test Case 2: input [2,0] 0 1 Fail
Motivating Example X = input [0] - 2 Y = input [1] / 2 If (X == Y) print 1 else print 0 Expected Actual Pass/Fail Results Results Status Test Case 1: input [0,0] 1 0 Fail Test Case 2: input [2,0] 0 1 Fail
Motivating Example X = input [0] * 2 Y = input [1] / 2 If (X == Y) print 1 else print 0 Expected Actual Pass/Fail Results Results Status Test Case 1: input [0,0] 1 1 Pass Test Case 2: input [2,0] 0 0 Pass
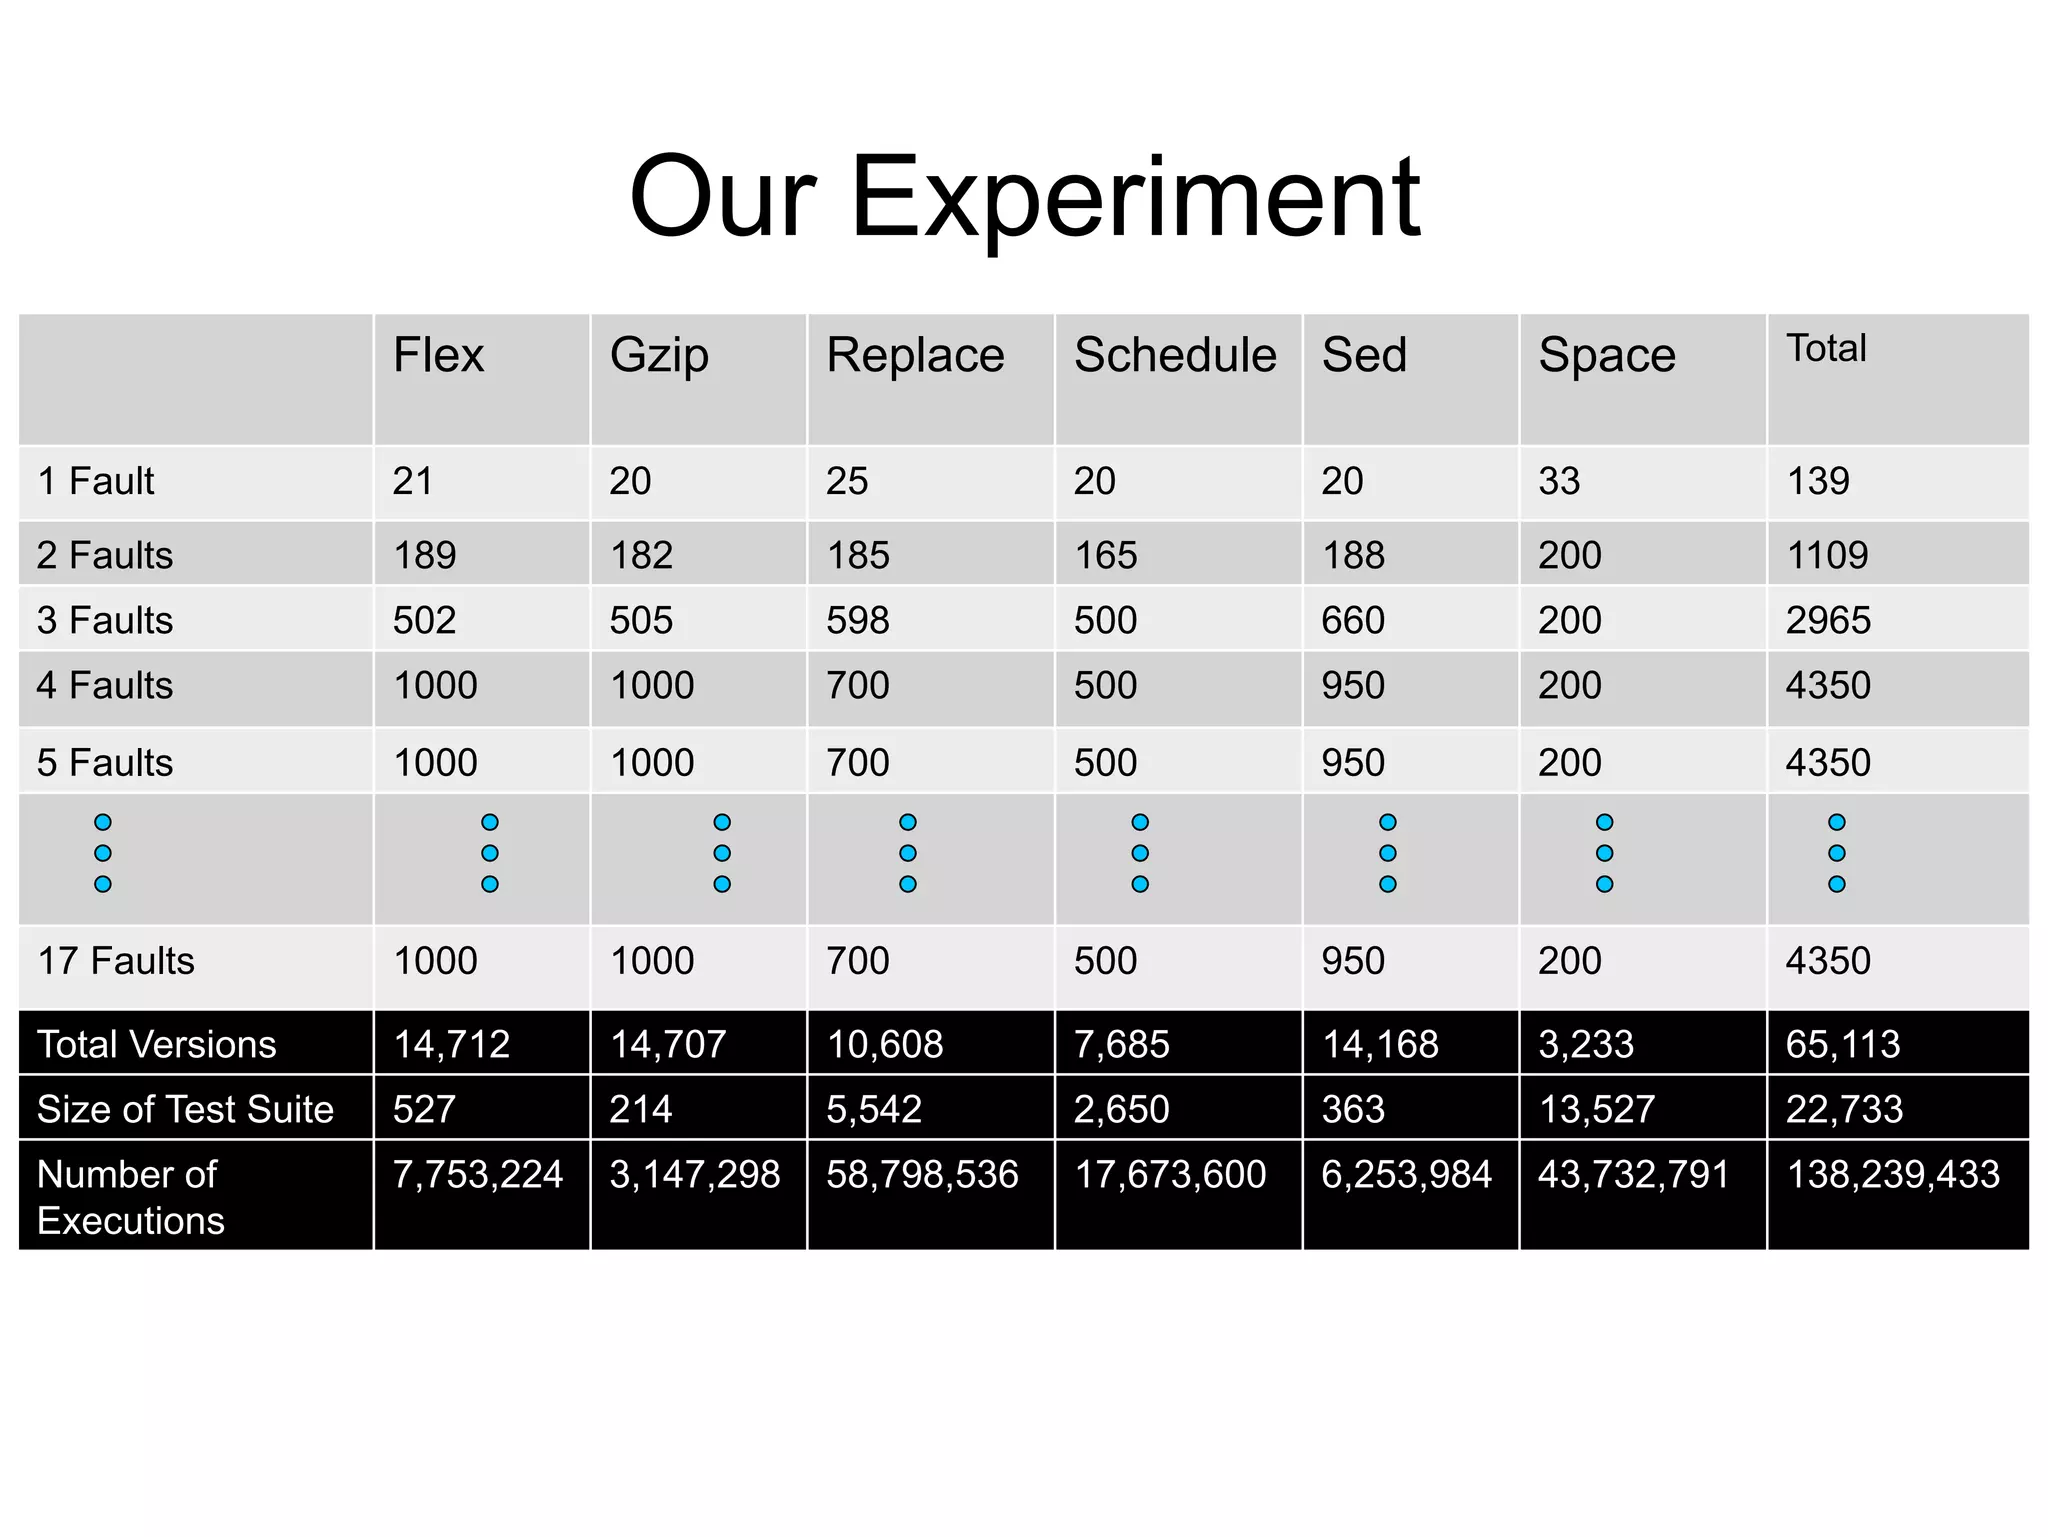
Our Experiment Flex Gzip Replace Schedule Sed Space Total 1 Fault 21 20 25 20 20 33 139 2 Faults 189 182 185 165 188 200 1109 3 Faults 502 505 598 500 660 200 2965 4 Faults 1000 1000 700 500 950 200 4350 5 Faults 1000 1000 700 500 950 200 4350 17 Faults 1000 1000 700 500 950 200 4350 Total Versions 14,712 14,707 10,608 7,685 14,168 3,233 65,113 Size of Test Suite 527 214 5,542 2,650 363 13,527 22,733 Number of 7,753,224 3,147,298 58,798,536 17,673,600 6,253,984 43,732,791 138,239,433 Executions
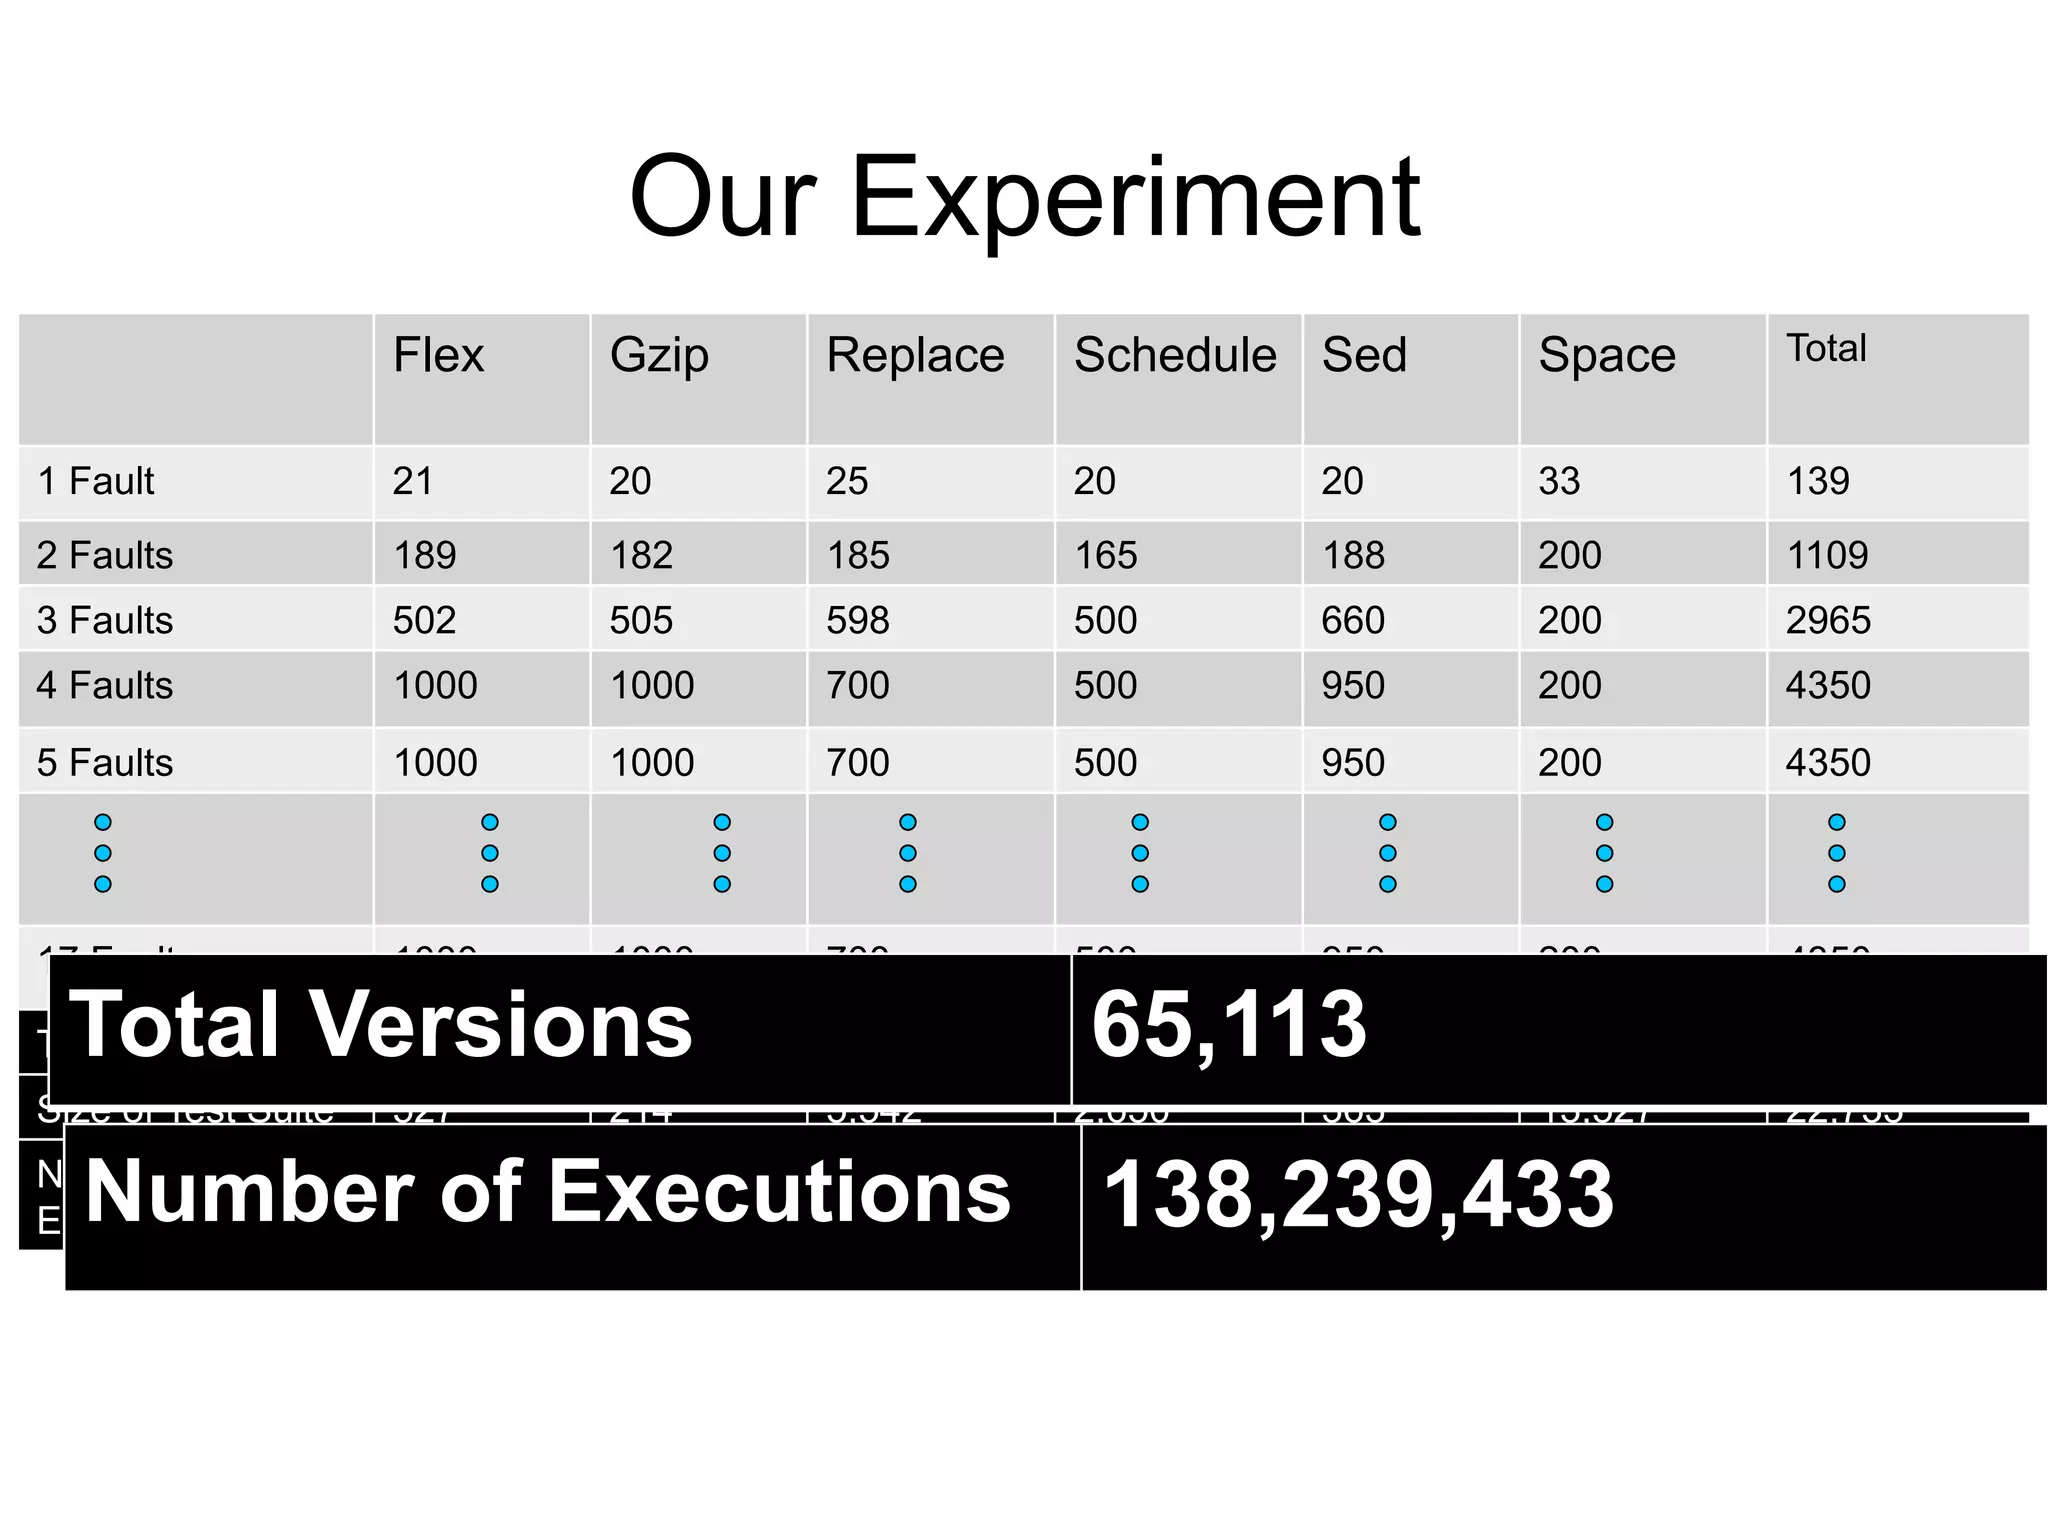
Our Experiment Flex Gzip Replace Schedule Sed Space Total 1 Fault 21 20 25 20 20 33 139 2 Faults 189 182 185 165 188 200 1109 3 Faults 502 505 598 500 660 200 2965 4 Faults 1000 1000 700 500 950 200 4350 5 Faults 1000 1000 700 500 950 200 4350 17 Faults 1000 1000 700 500 950 200 4350 Total Versions Total Versions 14,712 14,707 10,608 65,113 7,68514,168 3,233 65,113 Size of Test Suite 527 214 5,542 2,650 363 13,527 22,733 Number of Executions 138,239,433 Number of Executions 7,753,224 3,147,298 58,798,536 17,673,600 6,253,984 43,732,791 138,239,433
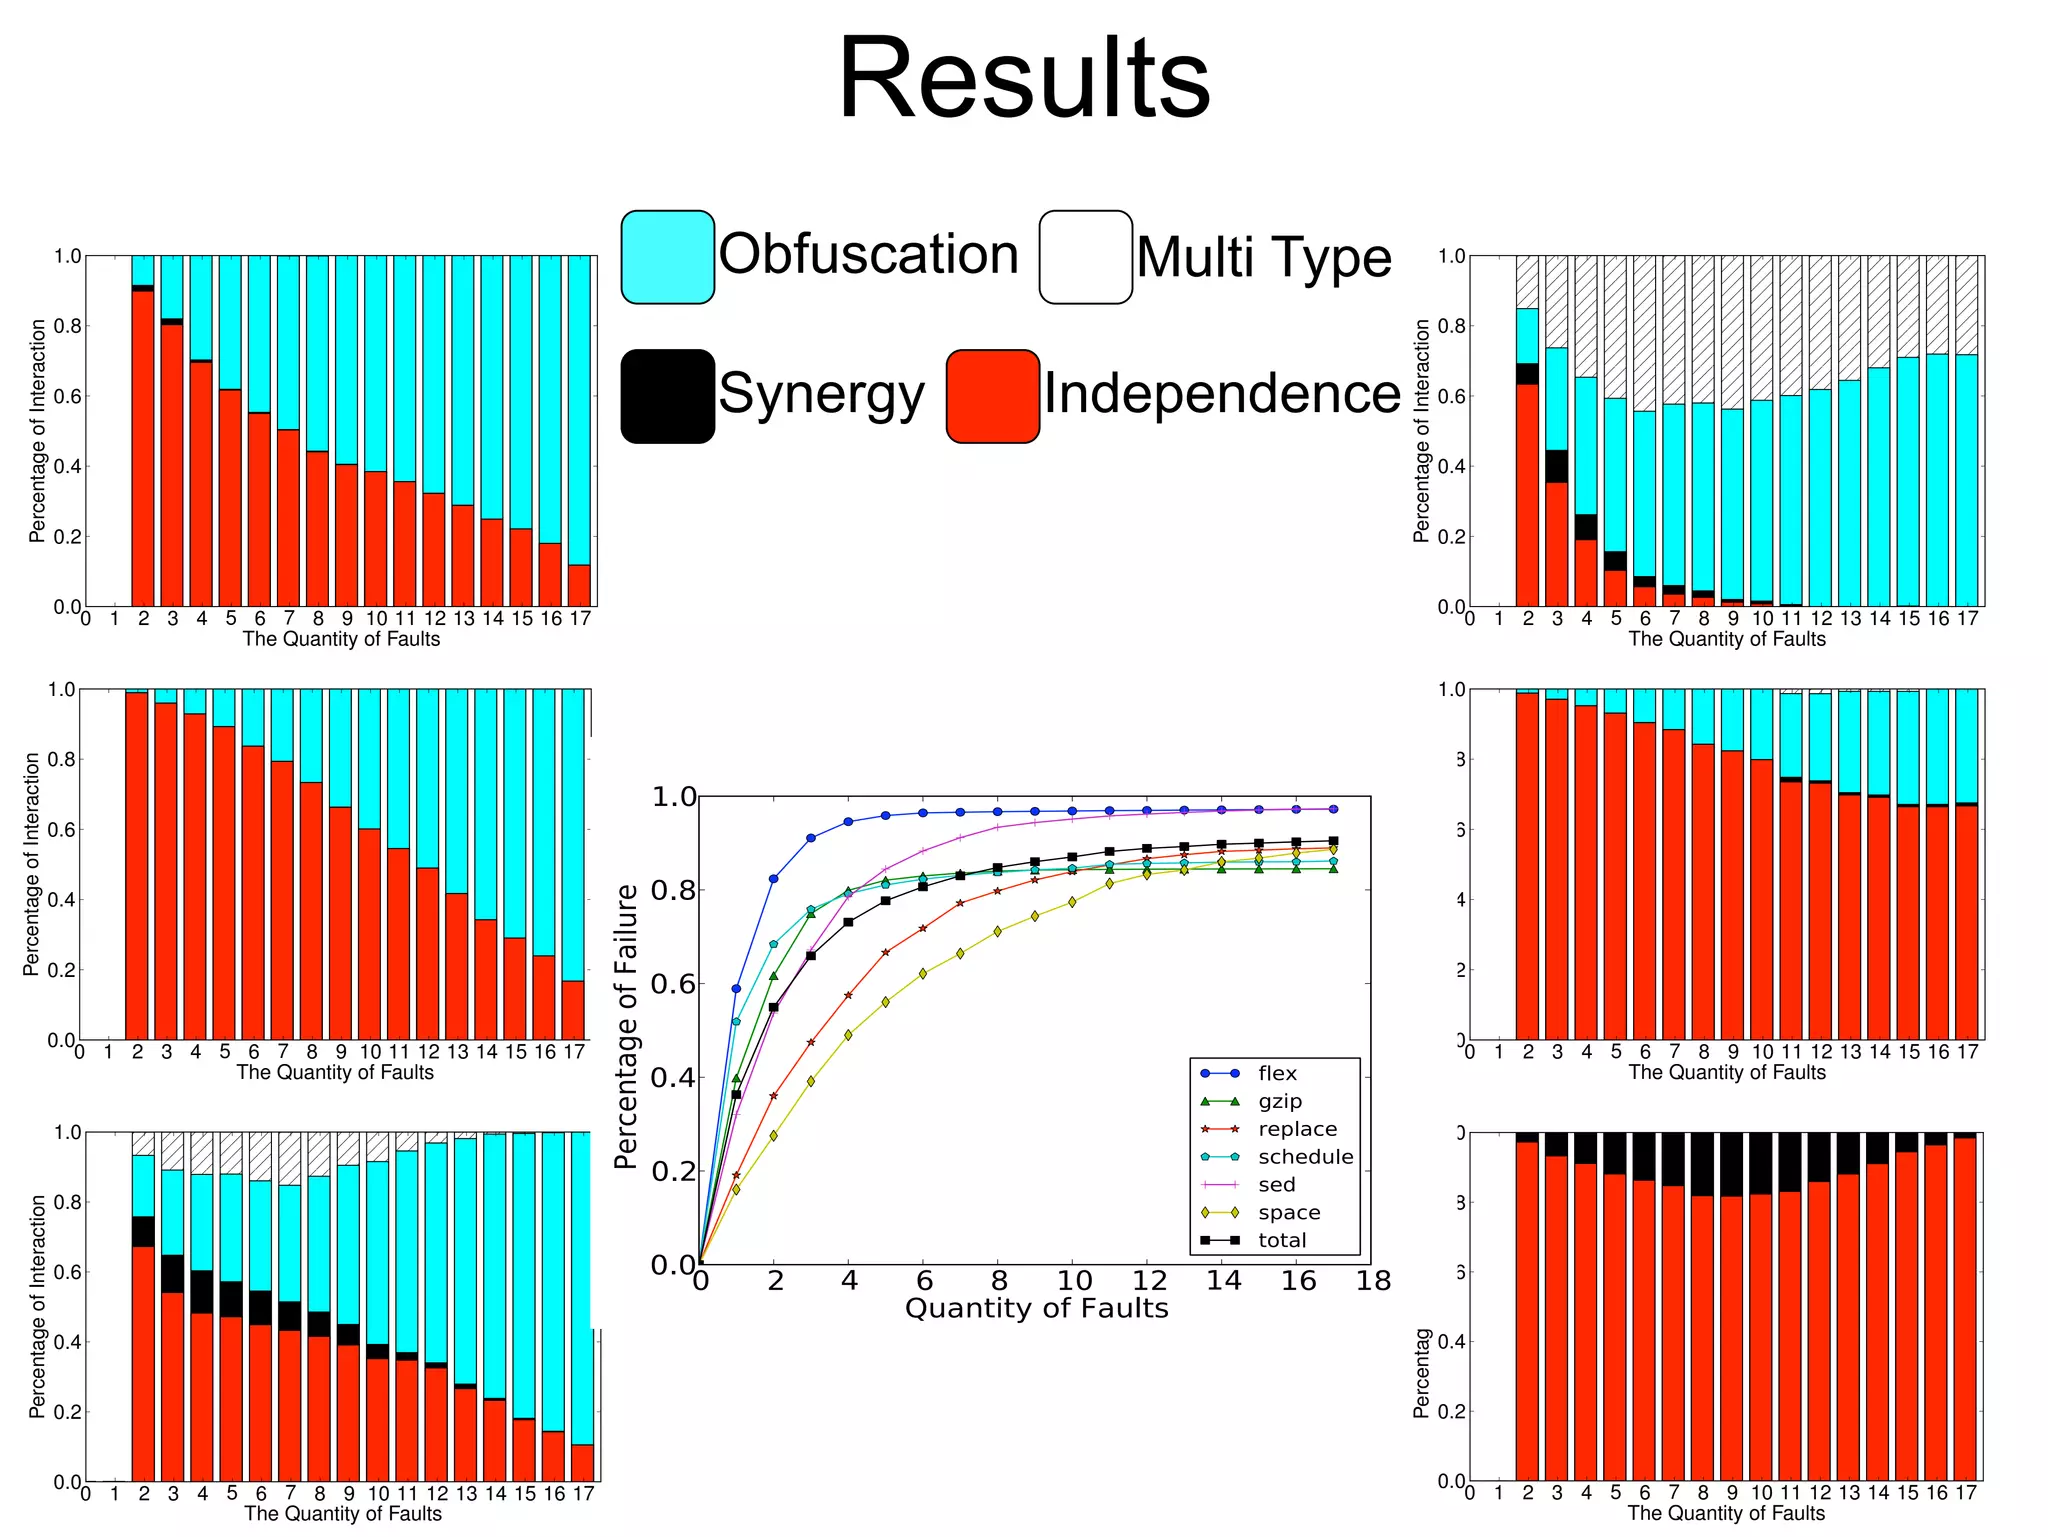
a Results 1.0 1.0 Obfuscation Multi Type 1.0 0.8 0.8 0.8 Percentage of Interaction Percentage of Interaction Percentage of Interaction 0.6 0.6 Synergy Independence 0.6 0.4 0.4 0.4 0.2 0.2 0.2 0.0 0.0 0.0 00 11 22 33 44 55 66 77 88 99 10 11 12 13 14 15 16 17 10 11 12 13 14 15 16 17 0 1 2 3 4 5 6 7 8 9 10 11 12 13 14 15 16 17 The Quantity of Faults The Quantity of Faults The Quantity of Faults 1.0 1.0 0.8 0.8 Percentage of Interaction Percentage of Interaction 0.6 0.6 0.4 0.4 0.2 0.2 0.0 0.0 0 1 2 3 4 5 6 7 8 9 10 11 12 13 14 15 16 17 0 1 2 3 4 5 6 7 8 9 10 11 12 13 14 15 16 17 The Quantity of Faults The Quantity of Faults 1.0 1.0 0.8 0.8 Percentage of Interaction Percentage of Interaction 0.6 0.6 0.4 0.4 0.2 0.2 0.0 0.0 0 1 2 3 4 5 6 7 8 9 10 11 12 13 14 15 16 17 0 1 2 3 4 5 6 7 8 9 10 11 12 13 14 15 16 17 The Quantity of Faults The Quantity of Faults
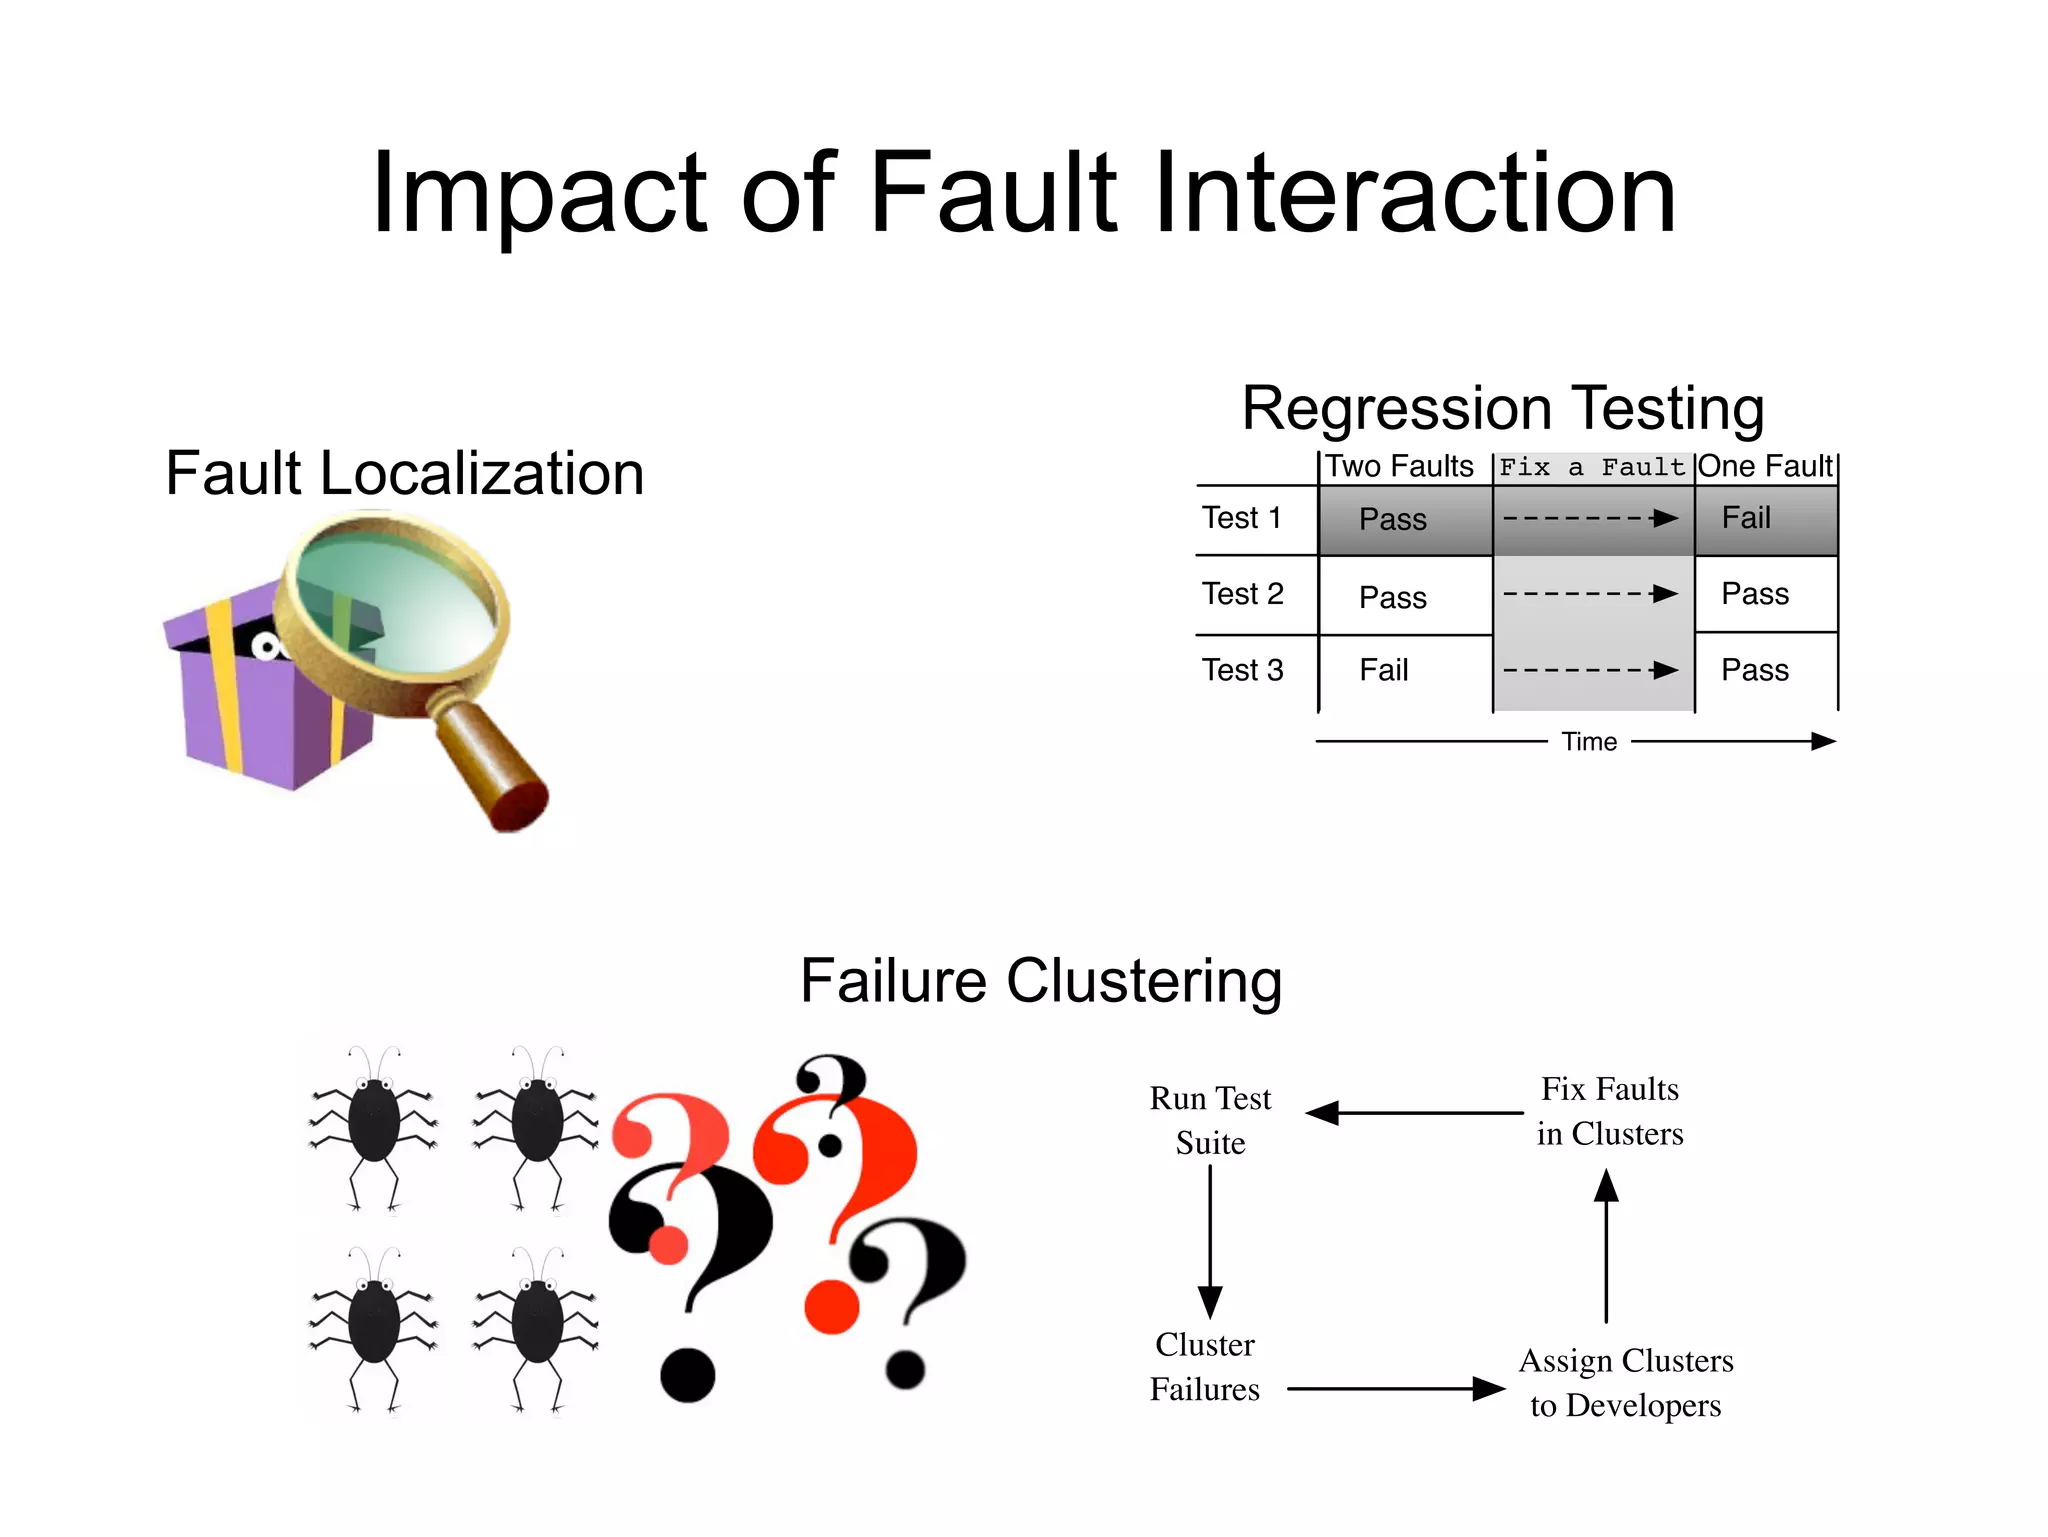
Impact of Fault Interaction Regression Testing Fault Localization Two Faults Fix a Fault One Fault Test 1 Pass Fail Test 2 Pass Pass Test 3 Fail Pass Time Failure Clustering Run Test Fix Faults Suite in Clusters Cluster Assign Clusters Failures to Developers
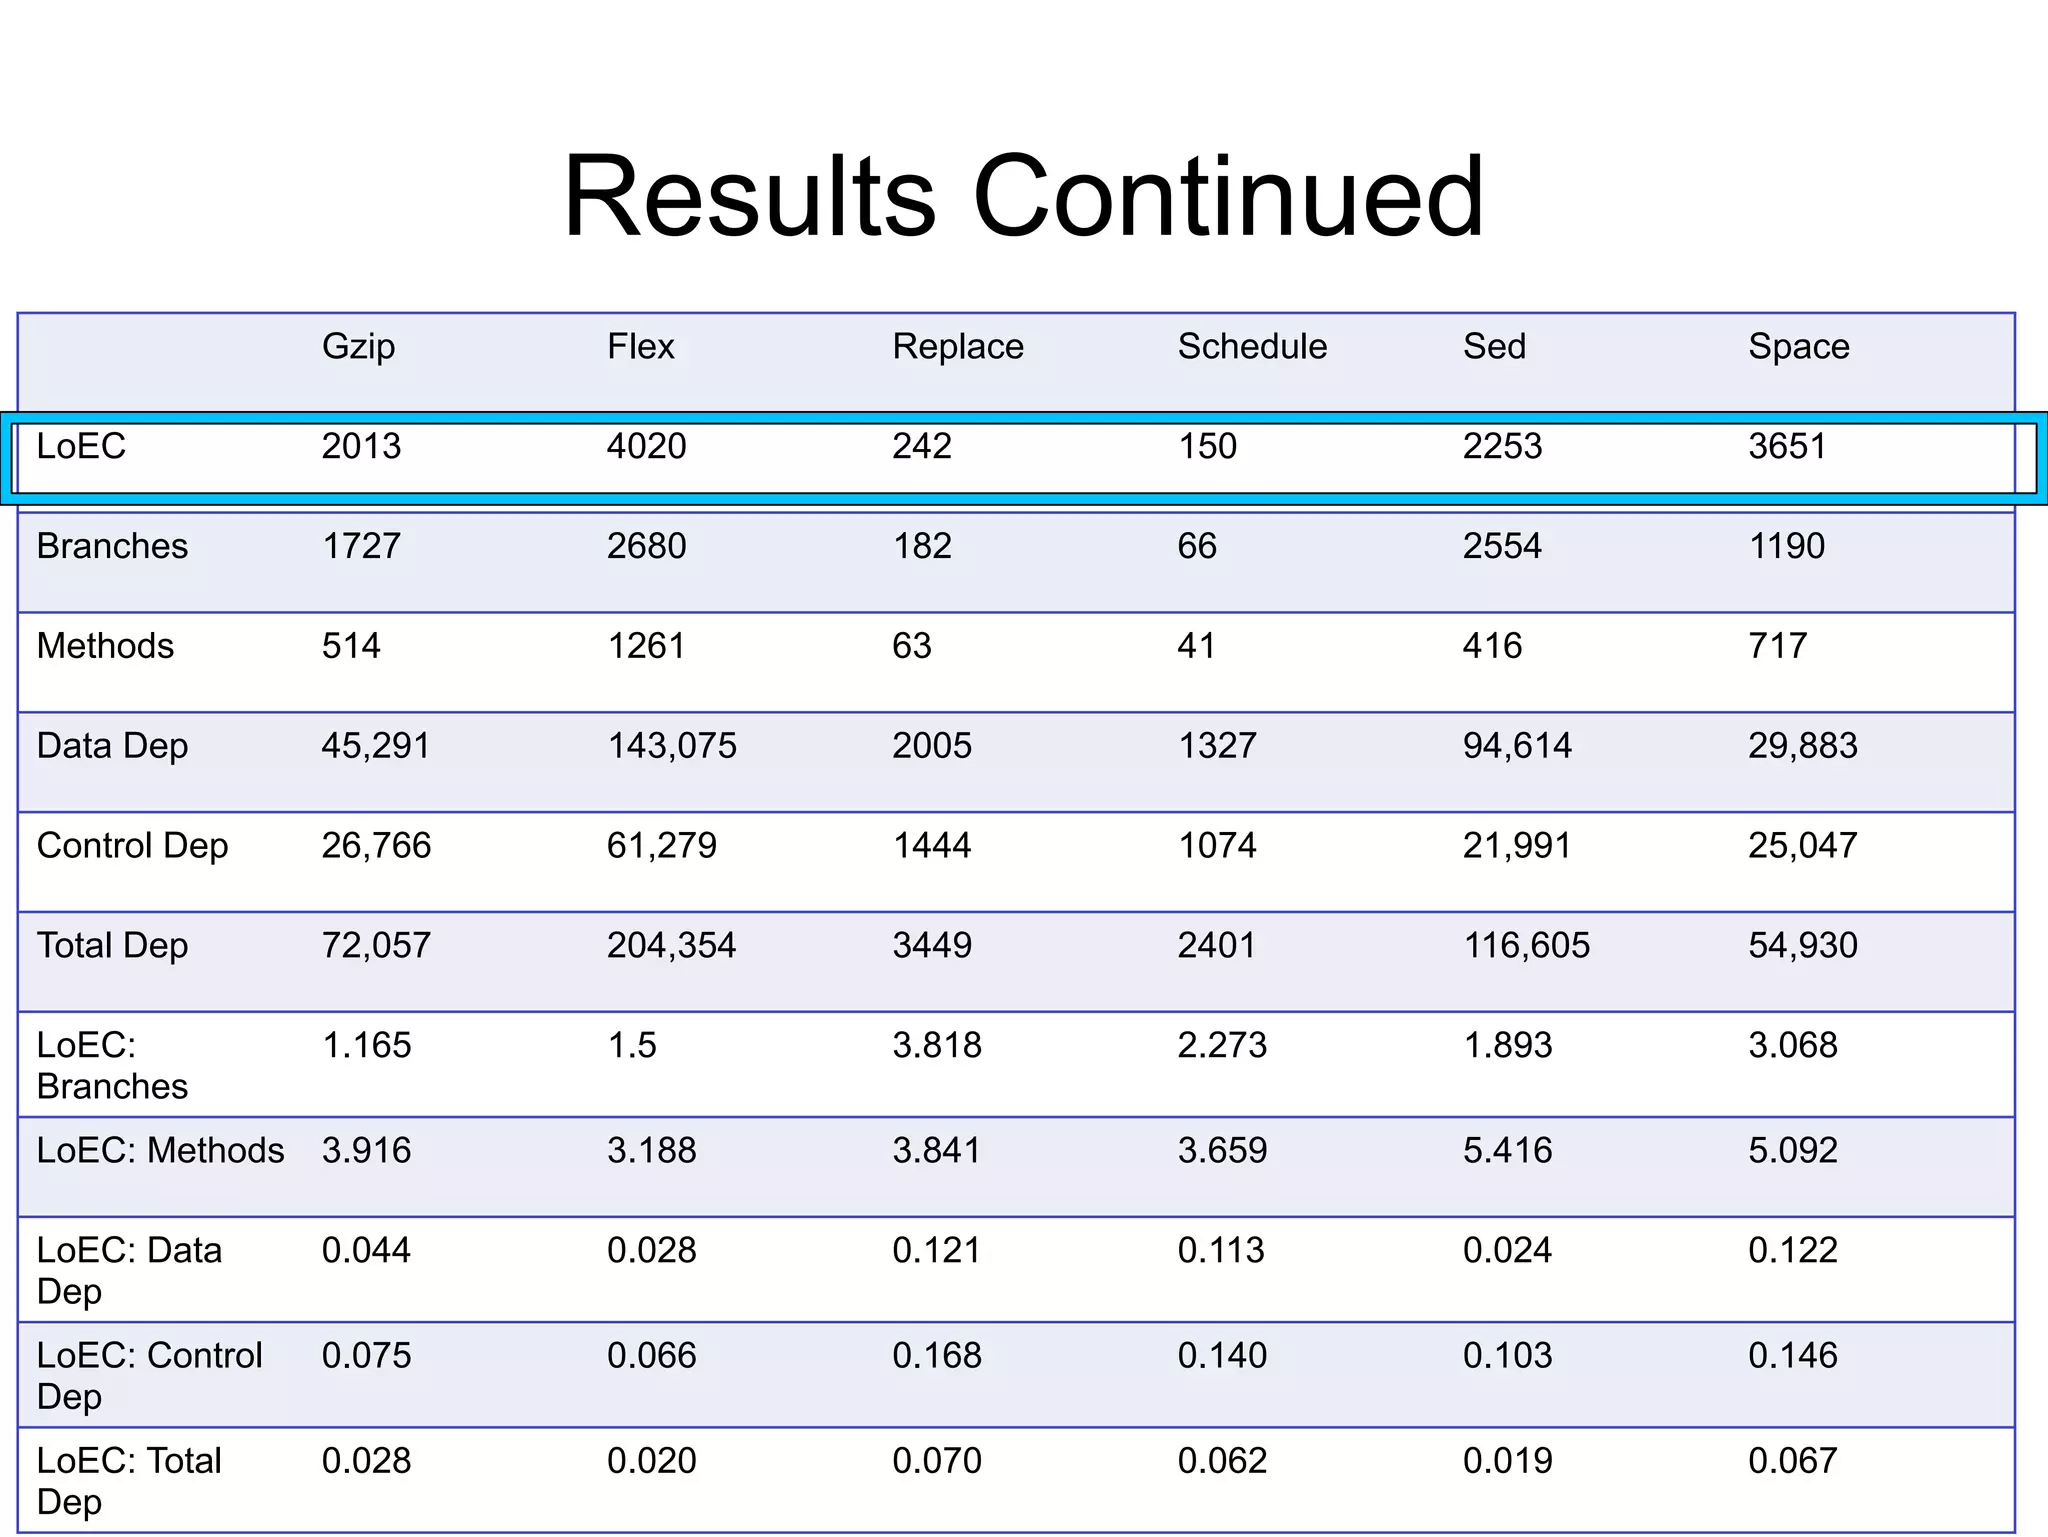
Results Continued Gzip Flex Replace Schedule Sed Space LoEC 2013 4020 242 150 2253 3651 Branches 1727 2680 182 66 2554 1190 Methods 514 1261 63 41 416 717 Data Dep 45,291 143,075 2005 1327 94,614 29,883 Control Dep 26,766 61,279 1444 1074 21,991 25,047 Total Dep 72,057 204,354 3449 2401 116,605 54,930 LoEC: 1.165 1.5 3.818 2.273 1.893 3.068 Branches LoEC: Methods 3.916 3.188 3.841 3.659 5.416 5.092 LoEC: Data 0.044 0.028 0.121 0.113 0.024 0.122 Dep LoEC: Control 0.075 0.066 0.168 0.140 0.103 0.146 Dep LoEC: Total 0.028 0.020 0.070 0.062 0.019 0.067 Dep
Conclusions Defined Fault Interaction Demonstrated that Fault Interaction is prominent (primarily fault obfuscation) Demonstrated that Fault Interaction can have a real impact on practice and research Demonstrated that the size of a program affects Fault Interaction
Conclusions Take Home Message Fault Interaction is prevalent Fault Obfuscation is prevalent We need to adapt our techniques
Thank You! This work was partially funded by: University of California, Irvine

Faults and Regression Testing - Fault interaction and its repercussions

  • 1.
    Fault Interaction andits Repercussions Nicholas DiGiuseppe James A. Jones UC Irvine Spider Lab
  • 2.
    Fault Interaction Defined 4Types of Interaction Pass/Fail Independence Obfuscation Synergy Multi-Type
  • 3.
    Fault Interaction Defined 4Types of Interaction Pass/Fail Independence Obfuscation Synergy Multi-Type
  • 4.
    Fault Interaction Defined 4Types of Interaction Pass/Fail Independence Obfuscation Synergy Multi-Type
  • 5.
    Fault Interaction Defined 4Types of Interaction Pass/Fail Independence Obfuscation Synergy Multi-Type
  • 6.
    We Need MoreFault Understanding Conferences: ASE, FSE, ICSE, ICSM, ICST, ISSTA Years: 2008–2009 27 Fault Localization = 2.25 per conference per year 4 Fault Behavior = 0.333 per conference per year
  • 7.
    Motivating Example X = input [0] - 2 Y = input [0] - 2 If (X == Y) print 1 else print 0 Expected Actual Pass/Fail Results Results Status Test Case 1: input [0,0] 1 1 Pass Test Case 2: input [2,0] 0 1 Fail
  • 8.
    Motivating Example X = input [0] - 2 Y = input [1] / 2 If (X == Y) print 1 else print 0 Expected Actual Pass/Fail Results Results Status Test Case 1: input [0,0] 1 0 Fail Test Case 2: input [2,0] 0 1 Fail
  • 9.
    Motivating Example X = input [0] * 2 Y = input [1] / 2 If (X == Y) print 1 else print 0 Expected Actual Pass/Fail Results Results Status Test Case 1: input [0,0] 1 1 Pass Test Case 2: input [2,0] 0 0 Pass
  • 10.
    Our Experiment Flex Gzip Replace Schedule Sed Space Total 1 Fault 21 20 25 20 20 33 139 2 Faults 189 182 185 165 188 200 1109 3 Faults 502 505 598 500 660 200 2965 4 Faults 1000 1000 700 500 950 200 4350 5 Faults 1000 1000 700 500 950 200 4350 17 Faults 1000 1000 700 500 950 200 4350 Total Versions 14,712 14,707 10,608 7,685 14,168 3,233 65,113 Size of Test Suite 527 214 5,542 2,650 363 13,527 22,733 Number of 7,753,224 3,147,298 58,798,536 17,673,600 6,253,984 43,732,791 138,239,433 Executions
  • 11.
    Our Experiment Flex Gzip Replace Schedule Sed Space Total 1 Fault 21 20 25 20 20 33 139 2 Faults 189 182 185 165 188 200 1109 3 Faults 502 505 598 500 660 200 2965 4 Faults 1000 1000 700 500 950 200 4350 5 Faults 1000 1000 700 500 950 200 4350 17 Faults 1000 1000 700 500 950 200 4350 Total Versions Total Versions 14,712 14,707 10,608 65,113 7,68514,168 3,233 65,113 Size of Test Suite 527 214 5,542 2,650 363 13,527 22,733 Number of Executions 138,239,433 Number of Executions 7,753,224 3,147,298 58,798,536 17,673,600 6,253,984 43,732,791 138,239,433
  • 12.
    a Results 1.0 1.0 Obfuscation Multi Type 1.0 0.8 0.8 0.8 Percentage of Interaction Percentage of Interaction Percentage of Interaction 0.6 0.6 Synergy Independence 0.6 0.4 0.4 0.4 0.2 0.2 0.2 0.0 0.0 0.0 00 11 22 33 44 55 66 77 88 99 10 11 12 13 14 15 16 17 10 11 12 13 14 15 16 17 0 1 2 3 4 5 6 7 8 9 10 11 12 13 14 15 16 17 The Quantity of Faults The Quantity of Faults The Quantity of Faults 1.0 1.0 0.8 0.8 Percentage of Interaction Percentage of Interaction 0.6 0.6 0.4 0.4 0.2 0.2 0.0 0.0 0 1 2 3 4 5 6 7 8 9 10 11 12 13 14 15 16 17 0 1 2 3 4 5 6 7 8 9 10 11 12 13 14 15 16 17 The Quantity of Faults The Quantity of Faults 1.0 1.0 0.8 0.8 Percentage of Interaction Percentage of Interaction 0.6 0.6 0.4 0.4 0.2 0.2 0.0 0.0 0 1 2 3 4 5 6 7 8 9 10 11 12 13 14 15 16 17 0 1 2 3 4 5 6 7 8 9 10 11 12 13 14 15 16 17 The Quantity of Faults The Quantity of Faults
  • 13.
    Impact of FaultInteraction Regression Testing Fault Localization Two Faults Fix a Fault One Fault Test 1 Pass Fail Test 2 Pass Pass Test 3 Fail Pass Time Failure Clustering Run Test Fix Faults Suite in Clusters Cluster Assign Clusters Failures to Developers
  • 14.
    Results Continued Gzip Flex Replace Schedule Sed Space LoEC 2013 4020 242 150 2253 3651 Branches 1727 2680 182 66 2554 1190 Methods 514 1261 63 41 416 717 Data Dep 45,291 143,075 2005 1327 94,614 29,883 Control Dep 26,766 61,279 1444 1074 21,991 25,047 Total Dep 72,057 204,354 3449 2401 116,605 54,930 LoEC: 1.165 1.5 3.818 2.273 1.893 3.068 Branches LoEC: Methods 3.916 3.188 3.841 3.659 5.416 5.092 LoEC: Data 0.044 0.028 0.121 0.113 0.024 0.122 Dep LoEC: Control 0.075 0.066 0.168 0.140 0.103 0.146 Dep LoEC: Total 0.028 0.020 0.070 0.062 0.019 0.067 Dep
  • 15.
    Conclusions Defined Fault Interaction Demonstratedthat Fault Interaction is prominent (primarily fault obfuscation) Demonstrated that Fault Interaction can have a real impact on practice and research Demonstrated that the size of a program affects Fault Interaction
  • 16.
    Conclusions Take Home Message Fault Interaction is prevalent Fault Obfuscation is prevalent We need to adapt our techniques
  • 17.
    Thank You! This workwas partially funded by: University of California, Irvine