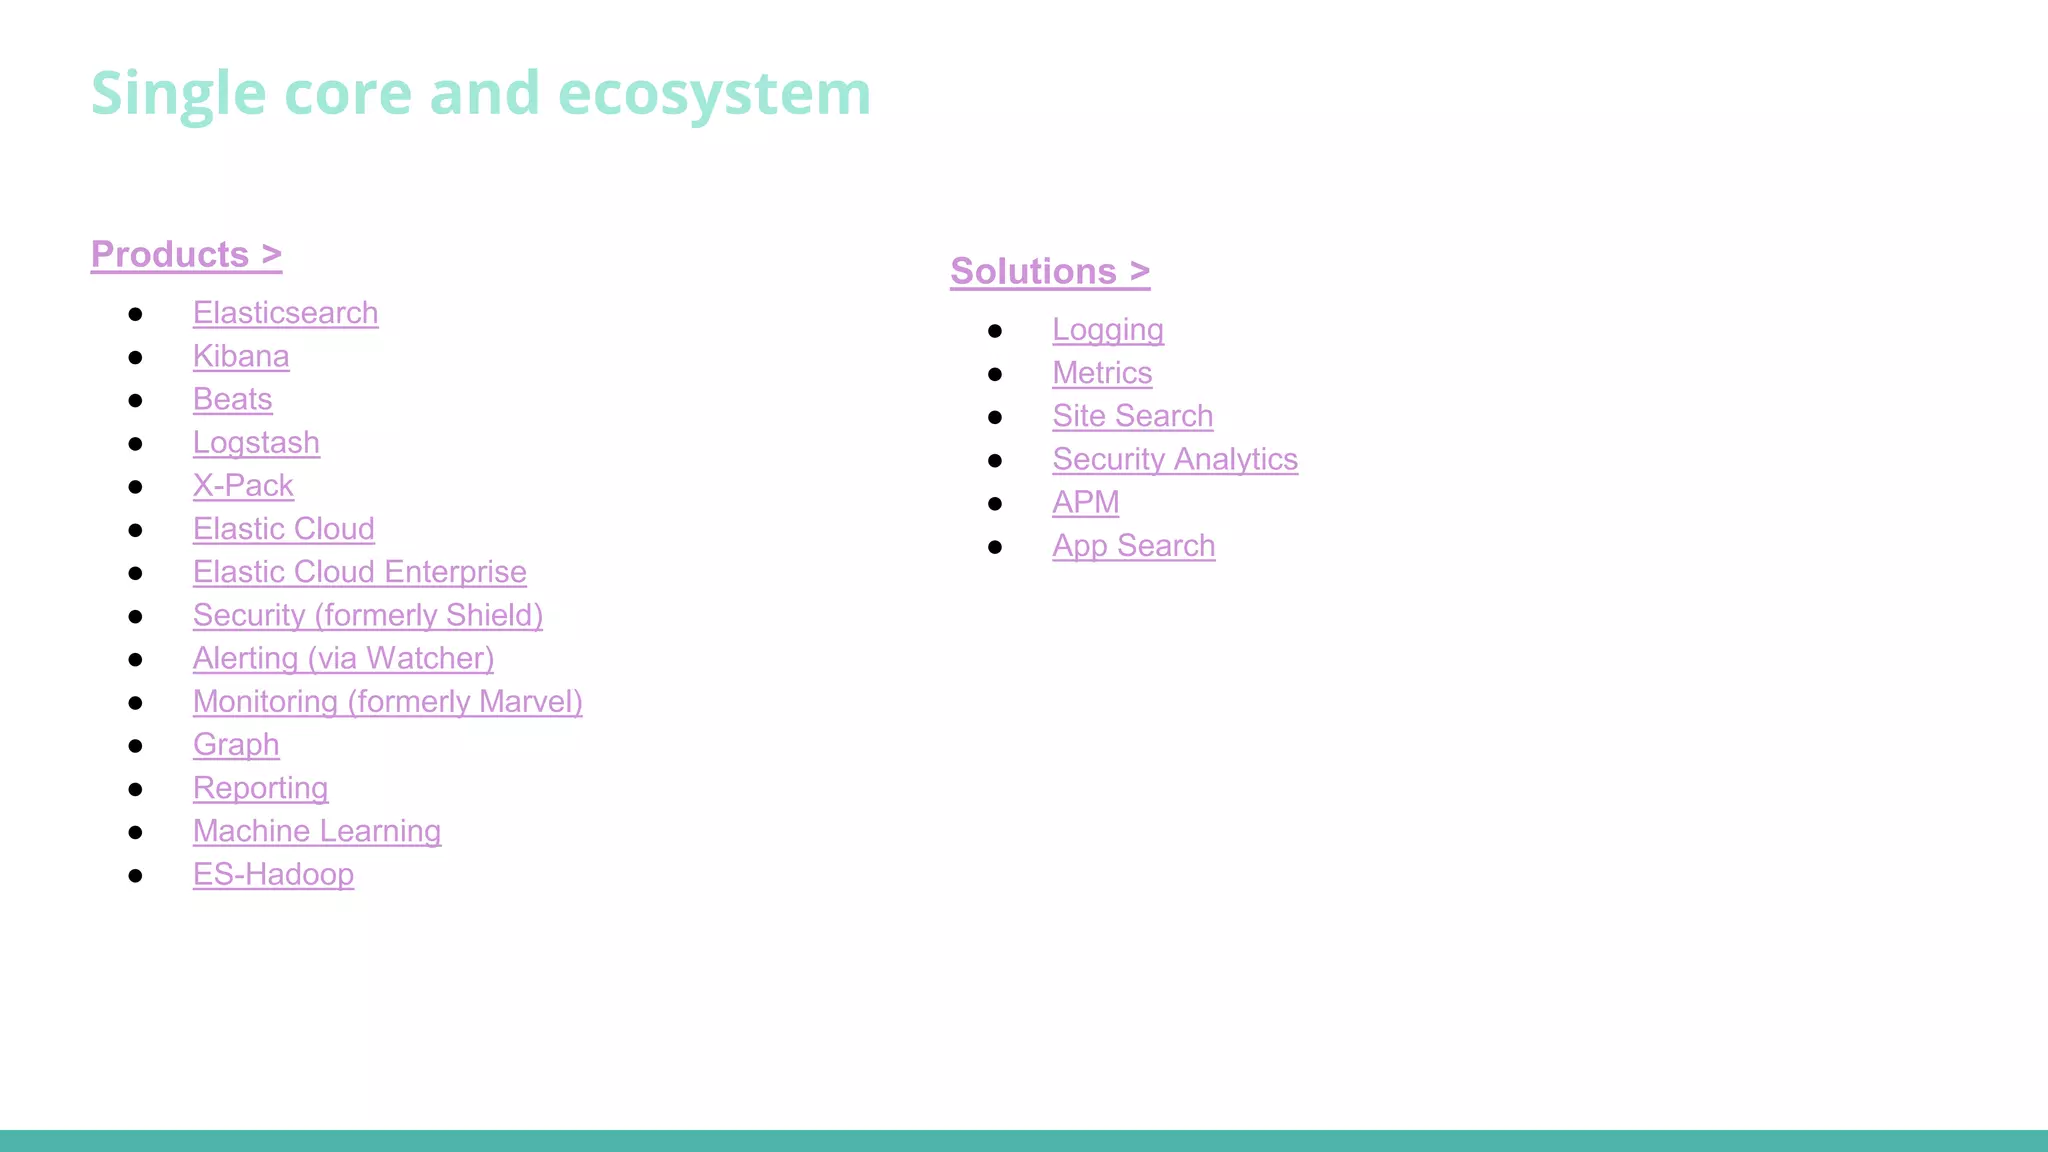
Elasticsearch ecosystem 1 TaskData, 2018 Pahan@Hubbitus.info
Elasticsearch ● The Heart of the Elastic Stack ● QUERY: Be Curious. Ask Your Data Questions of All Kinds ● ANALYZE: Step Back and Understand the Bigger Picture ● SPEED: Elasticsearch Is Fast. Really, Really Fast. ● SCALABILITY: Run It on Your Laptop. Or Hundreds of Servers with Petabytes of Data. ● RESILIENCY: We Cover the Bases While You Swing for the Fences ● FLEXIBILITY: Multiple Use Cases? Bring One, Bring All
Single core and ecosystem Solutions > ● Logging ● Metrics ● Site Search ● Security Analytics ● APM ● App Search Products > ● Elasticsearch ● Kibana ● Beats ● Logstash ● X-Pack ● Elastic Cloud ● Elastic Cloud Enterprise ● Security (formerly Shield) ● Alerting (via Watcher) ● Monitoring (formerly Marvel) ● Graph ● Reporting ● Machine Learning ● ES-Hadoop
Search
Aggregation
Kibana Your Window into the Elastic Stack Kibana lets you visualize your Elasticsearch data and navigate the Elastic Stack, so you can do anything from learning why you're getting paged at 2:00 a.m. to understanding the impact rain might have on your quarterly numbers. A Picture's Worth a Thousand Log Lines Kibana gives you the freedom to select the way you give shape to your data. And you don’t always have to know what you're looking for. With its interactive visualizations, start with one question and see where it leads you. Embed Dashboards & Send Links Insert dashboards into your internal wiki or webpage. Or send your coworker a URL to a dashboard. Share Dashboards Open your dashboards to a broader audience without worrying about accidental changes with Dashboard Only mode. Export to PDFs & CSVs Create, schedule, and share PDF reports of your visualizations and dashboards using X-Pack. Export ad-hoc search results to a CSV file in a few clicks
Graphics, widgets, dashboards
Put Geo Data on Any Map
Elastic Maps Service Map Your Data With the Elastic Stack The Elastic Maps Service provides an essential data layer for Kibana mapping functionality by serving basemap tiles, shapefiles, and other key resources for geospatial visualizations in the Elastic Stack. The Elastic Maps Service backs Kibana map visualizations and is available to all open source users at no cost. Adding X-Pack with a Basic license to your deployment extends the open source functionality, adding, for instance, more basemap zoom levels. For Kibana Users Only The Elastic Maps Service was created and is maintained by Elastic as a convenience and for the exclusive purpose of providing mapping functionality within components of the Elastic Stack, such as its open source data visualization platform Kibana. Any third-party modified version of Kibana (via plugin or fork), a re-distribution, or a SaaS/hosted service that is not part of Elastic cannot use the Elastic Maps Service. Backed By Open Source, Public Data We produce basemap tiles based on OpenStreetMap data, which is licensed under the Open Data Commons Open Database License (ODbL). It also uses derived coastline data provided by OpenSteetMapData.com, and the Apache 2.0 licensed Kartotherian. In addition to hosted tiles, we also provide out of the box geoJSON files derived from Natural Earth Data vectors.
Time Series Is Also on the Menu
Explore Anomalies with Machine Learning (X-Pack) Detect the anomalies hiding in your Elasticsearch data and explore the properties that significantly influence them with unsupervised machine learning features in X-Pack.
Secure, Monitor, and Configure the Elastic Stack
Logstash Centralize, Transform & Stash Your Data Logstash is an open source, server-side data processing pipeline that ingests data from a multitude of sources simultaneously, transforms it, and then sends it to your favorite “stash.” EXTENSIBILITY: Create and Configure Your Pipeline, Your Way Logstash has a pluggable framework featuring over 200 plugins. Mix, match, and orchestrate different inputs, filters, and outputs DURABILITY & SECURITY: Trust in a Pipeline Built to Deliver If Logstash nodes happen to fail, Logstash guarantees at-least-once delivery for your in-flight events with its persistent queue MONITORING: Have Full Visibility into Your Deployments Logstash pipelines are often multipurpose and can become sophisticated, making a strong understanding of pipeline performance, availability, and bottlenecks is invaluable. With monitoring and pipeline viewer features in X-Pack, you can easily observe and study an active Logstash node or full deployment.
Inputs
Filters
Outputs (not only elasticsearch!)
Beats Lightweight Data Shippers Beats is the platform for single-purpose data shippers. They install as lightweight agents and send data from hundreds or thousands of machines to Logstash or Elasticsearch. All kinds of shippers for all kinds of data. ● Filebeat - Log Files ● Metricbeat - Metrics ● Packetbeat - Network Data ● Winlogbeat - Windows Event Logs ● Auditbeat - Audit Data ● Heartbeat - Uptime Monitoring
Ship from the Source LIGHTWEIGHT: Plain and Simple Beats are great for gathering data. They sit on your servers and centralize data in Elasticsearch. And if you want more processing muscle, Beats can also ship to Logstash for transformation and parsing PLUG & PLAY: Accelerate the Data-to-Visualize Experience with Modules Filebeat and Metricbeat include internal modules that simplify collecting, parsing, and visualizing common log formats such as, NGINX and Apache and system metrics such as Redis and Docker. Run a single command and explore away CONTAINER VISIBILITY: Monitor with Your Metadata Docker? Kubernetes? We play well with both. Filebeat and Metricbeat gather your containers' logs and metrics and amend each with essential metadata before shipping them to the Elastic Stack. Grab your baton, orchestration just got simpler. EXTENSIBLE: Missing a Beat? Don’t. Build Your Own & Share It. The cornerstone of every open source Beat is libbeat, the common library for forwarding data. Have a specialized protocol you need to monitor? Build it. We provide you the building blocks you need. And our list of community Beats keeps growing.
X-Pack X-Pack One Pack. Loads of Possibilities ● Security (formerly Shield) ● Alerting (via Watcher) ● Monitoring (formerly Marvel) ● Reporting ● Graph ● Machine Learning Partially opensource but not fully free!
X-Pack Unlocks New Capabilities in Minutes Secure It Activate authentication for your cluster and define roles and permissions. Monitor It Maintain a pulse on your Elastic Stack to keep it firing on all cylinders. Report It Easily generate and share reports of your Kibana visualizations.
X-Pack: Security Protect Your Data in the Elastic Stack X-Pack security features give the right access to the right people. If You Like It, You Should Put a Password on It Protecting data flowing through Elasticsearch, Kibana, Beats, and Logstash from unauthorized user. Integrated with Active Directory, LDAP, and SAML... Manage Users and Roles Take control of who can do what within the Elastic Stack. With support for multitenancy, you can grant users access to specific Elasticsearch indices. Prevent Snooping, Tampering, and Sniffing Protect data. With SSL/TLS encryption, you can secure node-to-node, HTTP, and transport client traffic across your Elastic Stack Secure All the Way Down to the Field Level We dug deep to engineer and implement rock-solid security you can trust. Safeguard your Elastic Stack data at the level you like — from top to bottom: ● CLUSTER - Who can check cluster health? ● INDEX - Who can add or delete documents in an index? ● DOCUMENT - Who can access sensitive documents? ● FIELD - Restrict access to individual fields. Have a Record of Who Did What and When Perhaps the quiet hero of the security world, the audit log features in X-Pack let you easily maintain a complete record of all system and user activity. You can filter the activity to only log what you need or log all activity that takes place in the Elastic Stack.
X-Pack: Alerting Detect Changes in Your Data The alerting features in X-Pack give you the full power of the Elasticsearch query language to identify changes in your data that are interesting to you. In other words, if you can query something in Elasticsearch, you can alert on it. Get Notified, Your Way Pick from many alerting options with built-in integrations for email, PagerDuty, Slack, and HipChat. It also comes with a powerful webhook output for integration with your existing monitoring infrastructure or any third-party system. Easy UI, Easy Alerts Take control of your alerts by viewing, creating, and managing all of them from a single UI. Stay in the know with real-time updates on which alerts are running and what actions were taken. Go Beyond Rule-Based Alerting For changes that are harder to define with rules and thresholds, combine alerting with unsupervised machine learning features to find the unusual stuff. Use the anomaly scores in the alerting framework to get notified when the ship is off course. Learn from Your Alert History X-Pack stores a complete history of all alert executions in Elasticsearch for easy tracking and visualization in Kibana. Are my alerts executing? How often are my conditions being met? What actions were taken? Your alert history also enables nested alerts.
X-Pack: Monitoring Your Elastic Stack at a Glance X-Pack monitoring features provide a way to keep a pulse on the performance of Elasticsearch, Kibana, Beats, and Logstash. Its collection of dashboards help you assess their status at various levels providing you with all the information you need to keep your Elastic Stack optimized. Bonus: Key monitoring features ship for free with the Basic license. Open Source alternatives: ● https://github.com/lmenezes/cerebro ● http://www.elastichq.org/
X-Pack: Analyze Relationships with Graph Take the relevance capabilities of a search engine, combine them with graph exploration, and uncover the uncommonly common relationships in your Elasticsearch data.
X-Pack: Reporting Generate, Schedule & Email Reports Quickly generate reports of any Kibana visualization or dashboard. Get a report on demand, schedule it for later, trigger it based on specified conditions, and automatically share it with others — managers, customers, compliance officers. It's architected to scale and travel well, letting you take a piece of Kibana anywhere you like. Push a Button, Get a Report. Easy. Kibana is a fantastic way to visualize and explore your Elasticsearch data. X-Pack reporting features let you easily export your favorite Kibana visualizations and dashboards. Each report is print-optimized, customizable, and PDF-formatted. And the option to add your own logo will give your reports the branded, polished look that will color your team impressed. Ship Reports on a Schedule or Per-Event Basis Email recurring status updates — daily, weekly, fortnightly, you choose — of your infrastructure health, website metrics, and more to your team by combining the reporting and alerting capabilities in X-Pack. Or trigger a report when certain conditions are met, say, when more than a specified number of errors occur over a defined period of time. Export Raw Documents, Saved Searches, and Metrics Quickly export the results of your ad-hoc analysis into a CSV file to share with your colleagues. Share an exact replica of your findings in the Kibana UI — including the columns defined, formatted fields, and scripted fields. Want to get your raw data more frequently? Combine CSV export with our alerting capabilities to schedule data dumps regularly or send only when specific conditions are met.
X-Pack: Machine Learning Go Beyond the Obvious in Your Data The Elastic Stack is brilliant at quickly answering questions such as, "what are the hourly requests per second over the last week?" and visualizing results in real time. But what if you want to dig deeper and ask "is there something unusual going on?" and "what's causing this?" Automatically Model the Complexity of the Real World Skip defining rules, specifying thresholds, or manually building out statistical models. Our machine learning features make it easy to start identifying anomalies. Just describe the data you're interested analyzing (requests per second) and what other properties might influence it (server, IP, username), and that's it. The model begins baselining what’s normal, so it can detect what isn't. Detect All Kinds of Anomalies Know when a specific metric, like requests per second, starts to deviate from the norm. Detect outliers in a population by building a profile of a “typical” user or machine to know when one starts to stray from the pack. Categorize log messages to learn what’s normal for a given group and surface rare events or unusual types of messages. Orient to Problems Faster to Pinpoint the Root Cause Knowing there's a problem is great. Understanding why it's happening is better. Once an anomaly is detected, X-Pack machine learning features make it easy to identify the properties that significantly influenced it. For instance, if there's an usual drop in transactions, you can quickly identify the failing server or misconfigured switch causing the problem. Forecast — and Prepare for — the Future With on-demand forecasting driven by machine learning, you can plan better for the future, and even shift its course by making improvements based on your forecasts. Get Up, Running, and Finding Answers with Guided Paths Not sure which jobs make sense for a new data set? Built-in features help you find the droids jobs you’re looking for and identify fields in your data that would pair well with machine learning. Plus, if you are working with common data formats, we simplify things even further by recommending a set of machine learning jobs.
ES-Hadoop Elasticsearch-Hadoop Best of Two Worlds for Real-Time Analysis Connect the massive data storage and deep processing power of Hadoop with the real-time search and analytics of Elasticsearch. The Elasticsearch-Hadoop (ES-Hadoop) connector lets you get quick insight from your big data and makes working in the Hadoop ecosystem even better.
Elasticsearch-Hadoop Interactive Analytics on Your Hadoop Data Hadoop shines as a batch processing system, but serving real-time results can be challenging. For truly interactive data discovery, ES-Hadoop lets you index Hadoop data into the Elastic Stack to take full advantage of the speedy Elasticsearch engine and beautiful Kibana visualizations. With ES-Hadoop, you can easily build dynamic, embedded search applications to serve your Hadoop data or perform deep, low-latency analytics using full-text, geospatial queries and aggregations. Seamlessly Move Data Between Elasticsearch and Hadoop Live decision making only happens with lightning fast data movement. With dynamic extensions to existing Hadoop APIs, ES-Hadoop lets you easily move data bi-directionally between Elasticsearch and Hadoop while exposing HDFS as a repository for long-term archival. Partition awareness, failure handling, type conversions, and co-location are all done transparently. Natively Interface with Spark and Friends ES-Hadoop offers full support for Spark, Spark Streaming, and SparkSQL. Additionally, whether you are using Hive, Pig, Storm, Cascading, or standard MapReduce, ES-Hadoop offers a native interface allowing you to index to and query from Elasticsearch. Works with Any Flavor of Hadoop We are official partners with Cloudera, MapR, Hortonworks, and Databricks, so whether you’re using vanilla Hadoop or any other distribution, we’ve got you covered. ES-Hadoop has been certified with CDH, MapR, and HDP.
APM Open Source Application Performance Monitoring Already housing logs and system metrics in Elasticsearch? Expand to application metrics with Elastic APM. Four lines of code lets you see a bigger picture to quickly fix issues and feel good about the code you push.
APM The Dashboards You Love, Now APM-Flavored Elastic APM instruments your applications to ship performance metrics to Elasticsearch for visualization in Kibana with pre-configured dashboards. And since data is stored as raw documents in Elasticsearch, your application metrics can coexist with your infrastructure logs, server metrics, and security events, making it easy to explore all of your data in one place. It's Developer-Friendly, Language-Friendly Elastic APM ships with support for Node.js and Python — and there are many more programming languages, including Ruby and JavaScript, on the way. Plus, it's extensible. If you don't see what you need, you can build it or leverage the open source community.
Our examples From http://lesegais.ru/portal/
Base dashboard with application custom metrics
Metricbeat example from balancer (nginx)
Filebeat example from balancer (nginx)

Elasticsearch features and ecosystem

  • 1.
  • 2.
    Elasticsearch ● The Heartof the Elastic Stack ● QUERY: Be Curious. Ask Your Data Questions of All Kinds ● ANALYZE: Step Back and Understand the Bigger Picture ● SPEED: Elasticsearch Is Fast. Really, Really Fast. ● SCALABILITY: Run It on Your Laptop. Or Hundreds of Servers with Petabytes of Data. ● RESILIENCY: We Cover the Bases While You Swing for the Fences ● FLEXIBILITY: Multiple Use Cases? Bring One, Bring All
  • 3.
    Single core andecosystem Solutions > ● Logging ● Metrics ● Site Search ● Security Analytics ● APM ● App Search Products > ● Elasticsearch ● Kibana ● Beats ● Logstash ● X-Pack ● Elastic Cloud ● Elastic Cloud Enterprise ● Security (formerly Shield) ● Alerting (via Watcher) ● Monitoring (formerly Marvel) ● Graph ● Reporting ● Machine Learning ● ES-Hadoop
  • 4.
  • 5.
  • 6.
    Kibana Your Window intothe Elastic Stack Kibana lets you visualize your Elasticsearch data and navigate the Elastic Stack, so you can do anything from learning why you're getting paged at 2:00 a.m. to understanding the impact rain might have on your quarterly numbers. A Picture's Worth a Thousand Log Lines Kibana gives you the freedom to select the way you give shape to your data. And you don’t always have to know what you're looking for. With its interactive visualizations, start with one question and see where it leads you. Embed Dashboards & Send Links Insert dashboards into your internal wiki or webpage. Or send your coworker a URL to a dashboard. Share Dashboards Open your dashboards to a broader audience without worrying about accidental changes with Dashboard Only mode. Export to PDFs & CSVs Create, schedule, and share PDF reports of your visualizations and dashboards using X-Pack. Export ad-hoc search results to a CSV file in a few clicks
  • 7.
  • 8.
    Put Geo Dataon Any Map
  • 9.
    Elastic Maps Service MapYour Data With the Elastic Stack The Elastic Maps Service provides an essential data layer for Kibana mapping functionality by serving basemap tiles, shapefiles, and other key resources for geospatial visualizations in the Elastic Stack. The Elastic Maps Service backs Kibana map visualizations and is available to all open source users at no cost. Adding X-Pack with a Basic license to your deployment extends the open source functionality, adding, for instance, more basemap zoom levels. For Kibana Users Only The Elastic Maps Service was created and is maintained by Elastic as a convenience and for the exclusive purpose of providing mapping functionality within components of the Elastic Stack, such as its open source data visualization platform Kibana. Any third-party modified version of Kibana (via plugin or fork), a re-distribution, or a SaaS/hosted service that is not part of Elastic cannot use the Elastic Maps Service. Backed By Open Source, Public Data We produce basemap tiles based on OpenStreetMap data, which is licensed under the Open Data Commons Open Database License (ODbL). It also uses derived coastline data provided by OpenSteetMapData.com, and the Apache 2.0 licensed Kartotherian. In addition to hosted tiles, we also provide out of the box geoJSON files derived from Natural Earth Data vectors.
  • 10.
    Time Series IsAlso on the Menu
  • 11.
    Explore Anomalies withMachine Learning (X-Pack) Detect the anomalies hiding in your Elasticsearch data and explore the properties that significantly influence them with unsupervised machine learning features in X-Pack.
  • 12.
    Secure, Monitor, andConfigure the Elastic Stack
  • 13.
    Logstash Centralize, Transform &Stash Your Data Logstash is an open source, server-side data processing pipeline that ingests data from a multitude of sources simultaneously, transforms it, and then sends it to your favorite “stash.” EXTENSIBILITY: Create and Configure Your Pipeline, Your Way Logstash has a pluggable framework featuring over 200 plugins. Mix, match, and orchestrate different inputs, filters, and outputs DURABILITY & SECURITY: Trust in a Pipeline Built to Deliver If Logstash nodes happen to fail, Logstash guarantees at-least-once delivery for your in-flight events with its persistent queue MONITORING: Have Full Visibility into Your Deployments Logstash pipelines are often multipurpose and can become sophisticated, making a strong understanding of pipeline performance, availability, and bottlenecks is invaluable. With monitoring and pipeline viewer features in X-Pack, you can easily observe and study an active Logstash node or full deployment.
  • 14.
  • 15.
  • 16.
    Outputs (not onlyelasticsearch!)
  • 17.
    Beats Lightweight Data Shippers Beatsis the platform for single-purpose data shippers. They install as lightweight agents and send data from hundreds or thousands of machines to Logstash or Elasticsearch. All kinds of shippers for all kinds of data. ● Filebeat - Log Files ● Metricbeat - Metrics ● Packetbeat - Network Data ● Winlogbeat - Windows Event Logs ● Auditbeat - Audit Data ● Heartbeat - Uptime Monitoring
  • 18.
    Ship from theSource LIGHTWEIGHT: Plain and Simple Beats are great for gathering data. They sit on your servers and centralize data in Elasticsearch. And if you want more processing muscle, Beats can also ship to Logstash for transformation and parsing PLUG & PLAY: Accelerate the Data-to-Visualize Experience with Modules Filebeat and Metricbeat include internal modules that simplify collecting, parsing, and visualizing common log formats such as, NGINX and Apache and system metrics such as Redis and Docker. Run a single command and explore away CONTAINER VISIBILITY: Monitor with Your Metadata Docker? Kubernetes? We play well with both. Filebeat and Metricbeat gather your containers' logs and metrics and amend each with essential metadata before shipping them to the Elastic Stack. Grab your baton, orchestration just got simpler. EXTENSIBLE: Missing a Beat? Don’t. Build Your Own & Share It. The cornerstone of every open source Beat is libbeat, the common library for forwarding data. Have a specialized protocol you need to monitor? Build it. We provide you the building blocks you need. And our list of community Beats keeps growing.
  • 19.
    X-Pack X-Pack One Pack. Loadsof Possibilities ● Security (formerly Shield) ● Alerting (via Watcher) ● Monitoring (formerly Marvel) ● Reporting ● Graph ● Machine Learning Partially opensource but not fully free!
  • 20.
    X-Pack Unlocks NewCapabilities in Minutes Secure It Activate authentication for your cluster and define roles and permissions. Monitor It Maintain a pulse on your Elastic Stack to keep it firing on all cylinders. Report It Easily generate and share reports of your Kibana visualizations.
  • 21.
    X-Pack: Security Protect YourData in the Elastic Stack X-Pack security features give the right access to the right people. If You Like It, You Should Put a Password on It Protecting data flowing through Elasticsearch, Kibana, Beats, and Logstash from unauthorized user. Integrated with Active Directory, LDAP, and SAML... Manage Users and Roles Take control of who can do what within the Elastic Stack. With support for multitenancy, you can grant users access to specific Elasticsearch indices. Prevent Snooping, Tampering, and Sniffing Protect data. With SSL/TLS encryption, you can secure node-to-node, HTTP, and transport client traffic across your Elastic Stack Secure All the Way Down to the Field Level We dug deep to engineer and implement rock-solid security you can trust. Safeguard your Elastic Stack data at the level you like — from top to bottom: ● CLUSTER - Who can check cluster health? ● INDEX - Who can add or delete documents in an index? ● DOCUMENT - Who can access sensitive documents? ● FIELD - Restrict access to individual fields. Have a Record of Who Did What and When Perhaps the quiet hero of the security world, the audit log features in X-Pack let you easily maintain a complete record of all system and user activity. You can filter the activity to only log what you need or log all activity that takes place in the Elastic Stack.
  • 22.
    X-Pack: Alerting Detect Changesin Your Data The alerting features in X-Pack give you the full power of the Elasticsearch query language to identify changes in your data that are interesting to you. In other words, if you can query something in Elasticsearch, you can alert on it. Get Notified, Your Way Pick from many alerting options with built-in integrations for email, PagerDuty, Slack, and HipChat. It also comes with a powerful webhook output for integration with your existing monitoring infrastructure or any third-party system. Easy UI, Easy Alerts Take control of your alerts by viewing, creating, and managing all of them from a single UI. Stay in the know with real-time updates on which alerts are running and what actions were taken. Go Beyond Rule-Based Alerting For changes that are harder to define with rules and thresholds, combine alerting with unsupervised machine learning features to find the unusual stuff. Use the anomaly scores in the alerting framework to get notified when the ship is off course. Learn from Your Alert History X-Pack stores a complete history of all alert executions in Elasticsearch for easy tracking and visualization in Kibana. Are my alerts executing? How often are my conditions being met? What actions were taken? Your alert history also enables nested alerts.
  • 23.
    X-Pack: Monitoring Your ElasticStack at a Glance X-Pack monitoring features provide a way to keep a pulse on the performance of Elasticsearch, Kibana, Beats, and Logstash. Its collection of dashboards help you assess their status at various levels providing you with all the information you need to keep your Elastic Stack optimized. Bonus: Key monitoring features ship for free with the Basic license. Open Source alternatives: ● https://github.com/lmenezes/cerebro ● http://www.elastichq.org/
  • 24.
    X-Pack: Analyze Relationshipswith Graph Take the relevance capabilities of a search engine, combine them with graph exploration, and uncover the uncommonly common relationships in your Elasticsearch data.
  • 25.
    X-Pack: Reporting Generate, Schedule& Email Reports Quickly generate reports of any Kibana visualization or dashboard. Get a report on demand, schedule it for later, trigger it based on specified conditions, and automatically share it with others — managers, customers, compliance officers. It's architected to scale and travel well, letting you take a piece of Kibana anywhere you like. Push a Button, Get a Report. Easy. Kibana is a fantastic way to visualize and explore your Elasticsearch data. X-Pack reporting features let you easily export your favorite Kibana visualizations and dashboards. Each report is print-optimized, customizable, and PDF-formatted. And the option to add your own logo will give your reports the branded, polished look that will color your team impressed. Ship Reports on a Schedule or Per-Event Basis Email recurring status updates — daily, weekly, fortnightly, you choose — of your infrastructure health, website metrics, and more to your team by combining the reporting and alerting capabilities in X-Pack. Or trigger a report when certain conditions are met, say, when more than a specified number of errors occur over a defined period of time. Export Raw Documents, Saved Searches, and Metrics Quickly export the results of your ad-hoc analysis into a CSV file to share with your colleagues. Share an exact replica of your findings in the Kibana UI — including the columns defined, formatted fields, and scripted fields. Want to get your raw data more frequently? Combine CSV export with our alerting capabilities to schedule data dumps regularly or send only when specific conditions are met.
  • 26.
    X-Pack: Machine Learning GoBeyond the Obvious in Your Data The Elastic Stack is brilliant at quickly answering questions such as, "what are the hourly requests per second over the last week?" and visualizing results in real time. But what if you want to dig deeper and ask "is there something unusual going on?" and "what's causing this?" Automatically Model the Complexity of the Real World Skip defining rules, specifying thresholds, or manually building out statistical models. Our machine learning features make it easy to start identifying anomalies. Just describe the data you're interested analyzing (requests per second) and what other properties might influence it (server, IP, username), and that's it. The model begins baselining what’s normal, so it can detect what isn't. Detect All Kinds of Anomalies Know when a specific metric, like requests per second, starts to deviate from the norm. Detect outliers in a population by building a profile of a “typical” user or machine to know when one starts to stray from the pack. Categorize log messages to learn what’s normal for a given group and surface rare events or unusual types of messages. Orient to Problems Faster to Pinpoint the Root Cause Knowing there's a problem is great. Understanding why it's happening is better. Once an anomaly is detected, X-Pack machine learning features make it easy to identify the properties that significantly influenced it. For instance, if there's an usual drop in transactions, you can quickly identify the failing server or misconfigured switch causing the problem. Forecast — and Prepare for — the Future With on-demand forecasting driven by machine learning, you can plan better for the future, and even shift its course by making improvements based on your forecasts. Get Up, Running, and Finding Answers with Guided Paths Not sure which jobs make sense for a new data set? Built-in features help you find the droids jobs you’re looking for and identify fields in your data that would pair well with machine learning. Plus, if you are working with common data formats, we simplify things even further by recommending a set of machine learning jobs.
  • 27.
    ES-Hadoop Elasticsearch-Hadoop Best of TwoWorlds for Real-Time Analysis Connect the massive data storage and deep processing power of Hadoop with the real-time search and analytics of Elasticsearch. The Elasticsearch-Hadoop (ES-Hadoop) connector lets you get quick insight from your big data and makes working in the Hadoop ecosystem even better.
  • 28.
    Elasticsearch-Hadoop Interactive Analytics onYour Hadoop Data Hadoop shines as a batch processing system, but serving real-time results can be challenging. For truly interactive data discovery, ES-Hadoop lets you index Hadoop data into the Elastic Stack to take full advantage of the speedy Elasticsearch engine and beautiful Kibana visualizations. With ES-Hadoop, you can easily build dynamic, embedded search applications to serve your Hadoop data or perform deep, low-latency analytics using full-text, geospatial queries and aggregations. Seamlessly Move Data Between Elasticsearch and Hadoop Live decision making only happens with lightning fast data movement. With dynamic extensions to existing Hadoop APIs, ES-Hadoop lets you easily move data bi-directionally between Elasticsearch and Hadoop while exposing HDFS as a repository for long-term archival. Partition awareness, failure handling, type conversions, and co-location are all done transparently. Natively Interface with Spark and Friends ES-Hadoop offers full support for Spark, Spark Streaming, and SparkSQL. Additionally, whether you are using Hive, Pig, Storm, Cascading, or standard MapReduce, ES-Hadoop offers a native interface allowing you to index to and query from Elasticsearch. Works with Any Flavor of Hadoop We are official partners with Cloudera, MapR, Hortonworks, and Databricks, so whether you’re using vanilla Hadoop or any other distribution, we’ve got you covered. ES-Hadoop has been certified with CDH, MapR, and HDP.
  • 29.
    APM Open Source ApplicationPerformance Monitoring Already housing logs and system metrics in Elasticsearch? Expand to application metrics with Elastic APM. Four lines of code lets you see a bigger picture to quickly fix issues and feel good about the code you push.
  • 30.
    APM The Dashboards YouLove, Now APM-Flavored Elastic APM instruments your applications to ship performance metrics to Elasticsearch for visualization in Kibana with pre-configured dashboards. And since data is stored as raw documents in Elasticsearch, your application metrics can coexist with your infrastructure logs, server metrics, and security events, making it easy to explore all of your data in one place. It's Developer-Friendly, Language-Friendly Elastic APM ships with support for Node.js and Python — and there are many more programming languages, including Ruby and JavaScript, on the way. Plus, it's extensible. If you don't see what you need, you can build it or leverage the open source community.
  • 31.
    Our examples Fromhttp://lesegais.ru/portal/
  • 32.
    Base dashboard withapplication custom metrics
  • 33.
    Metricbeat example frombalancer (nginx)
  • 34.
    Filebeat example frombalancer (nginx)

Editor's Notes

  • #3 https://www.elastic.co/products/elasticsearch
  • #4 https://www.elastic.co/products/elasticsearch
  • #5 Хорошее видео на 40 секунд: https://www.elastic.co/products/elasticsearch
  • #7 https://www.elastic.co/products/kibana https://www.elastic.co/products/x-pack/reporting
  • #10 https://www.elastic.co/elastic-maps-service
  • #12 https://www.elastic.co/products/x-pack/machine-learning
  • #13 https://www.elastic.co/products/x-pack/graph
  • #14 https://www.elastic.co/products/logstash Events that are not successfully processed can be shunted to a dead letter queue for introspection and replay.
  • #15 https://www.elastic.co/guide/en/logstash/current/input-plugins.html
  • #16 https://www.elastic.co/guide/en/logstash/current/filter-plugins.html
  • #17 https://www.elastic.co/guide/en/logstash/current/output-plugins.html
  • #18 https://www.elastic.co/products/beats
  • #19 https://www.elastic.co/guide/en/logstash/current/output-plugins.html
  • #20 https://www.elastic.co/products/x-pack https://www.elastic.co/subscriptions https://www.elastic.co/products/x-pack/open!!!
  • #21 https://www.elastic.co/guide/en/x-pack/current/installing-xpack.html#xpack-installing-offline
  • #22 https://www.elastic.co/products/x-pack/security
  • #23 https://www.elastic.co/products/x-pack/alerting
  • #24 https://www.elastic.co/products/x-pack/monitoring
  • #25 https://www.elastic.co/products/x-pack/graph
  • #26 https://www.elastic.co/products/x-pack/monitoring
  • #27 https://www.elastic.co/products/x-pack/machine-learning
  • #28 https://www.elastic.co/products/hadoop
  • #29 https://www.elastic.co/products/hadoop
  • #30 https://www.elastic.co/solutions/apm
  • #31 https://www.elastic.co/products/hadoop
  • #32 https://www.elastic.co/solutions/apm