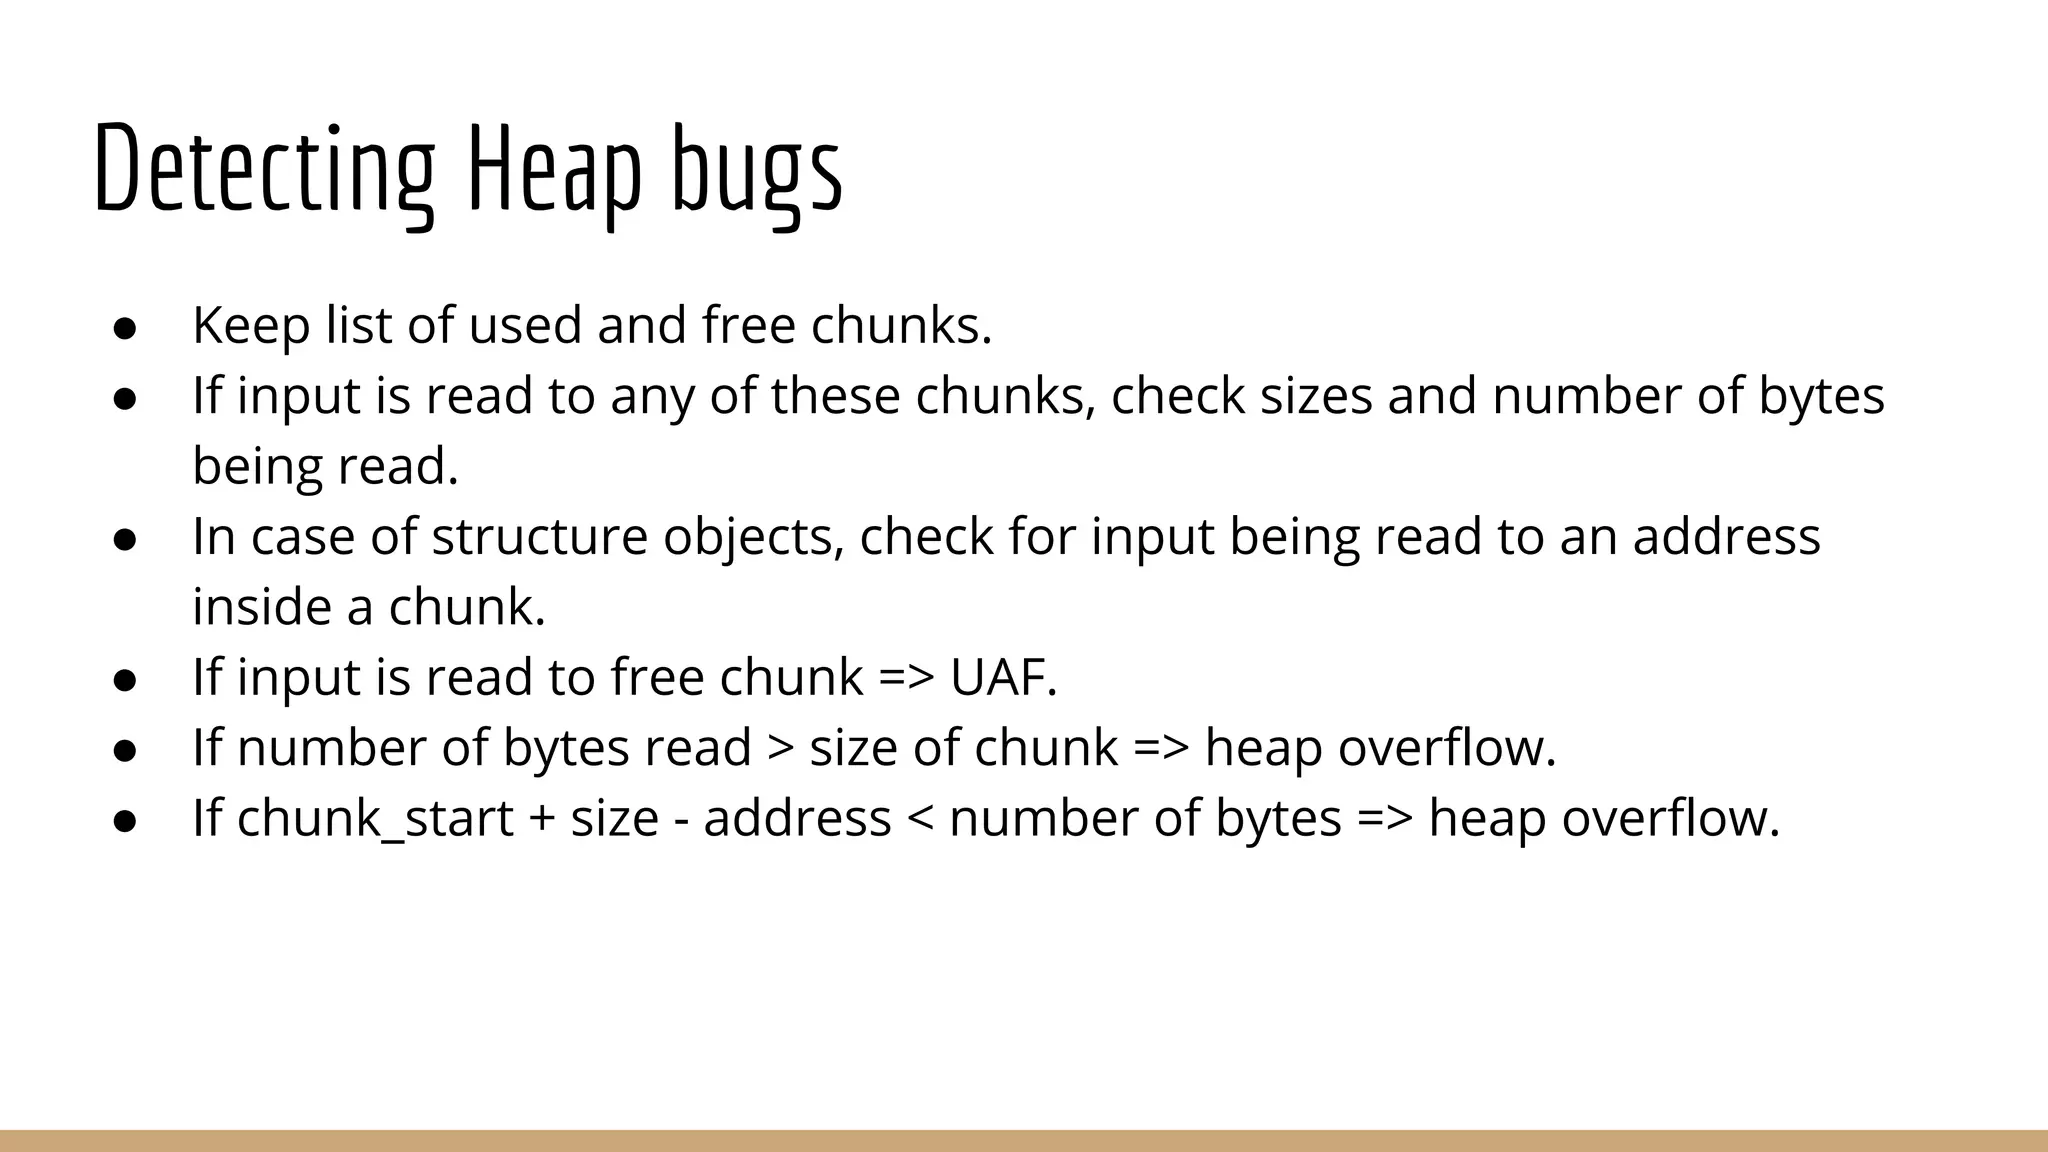
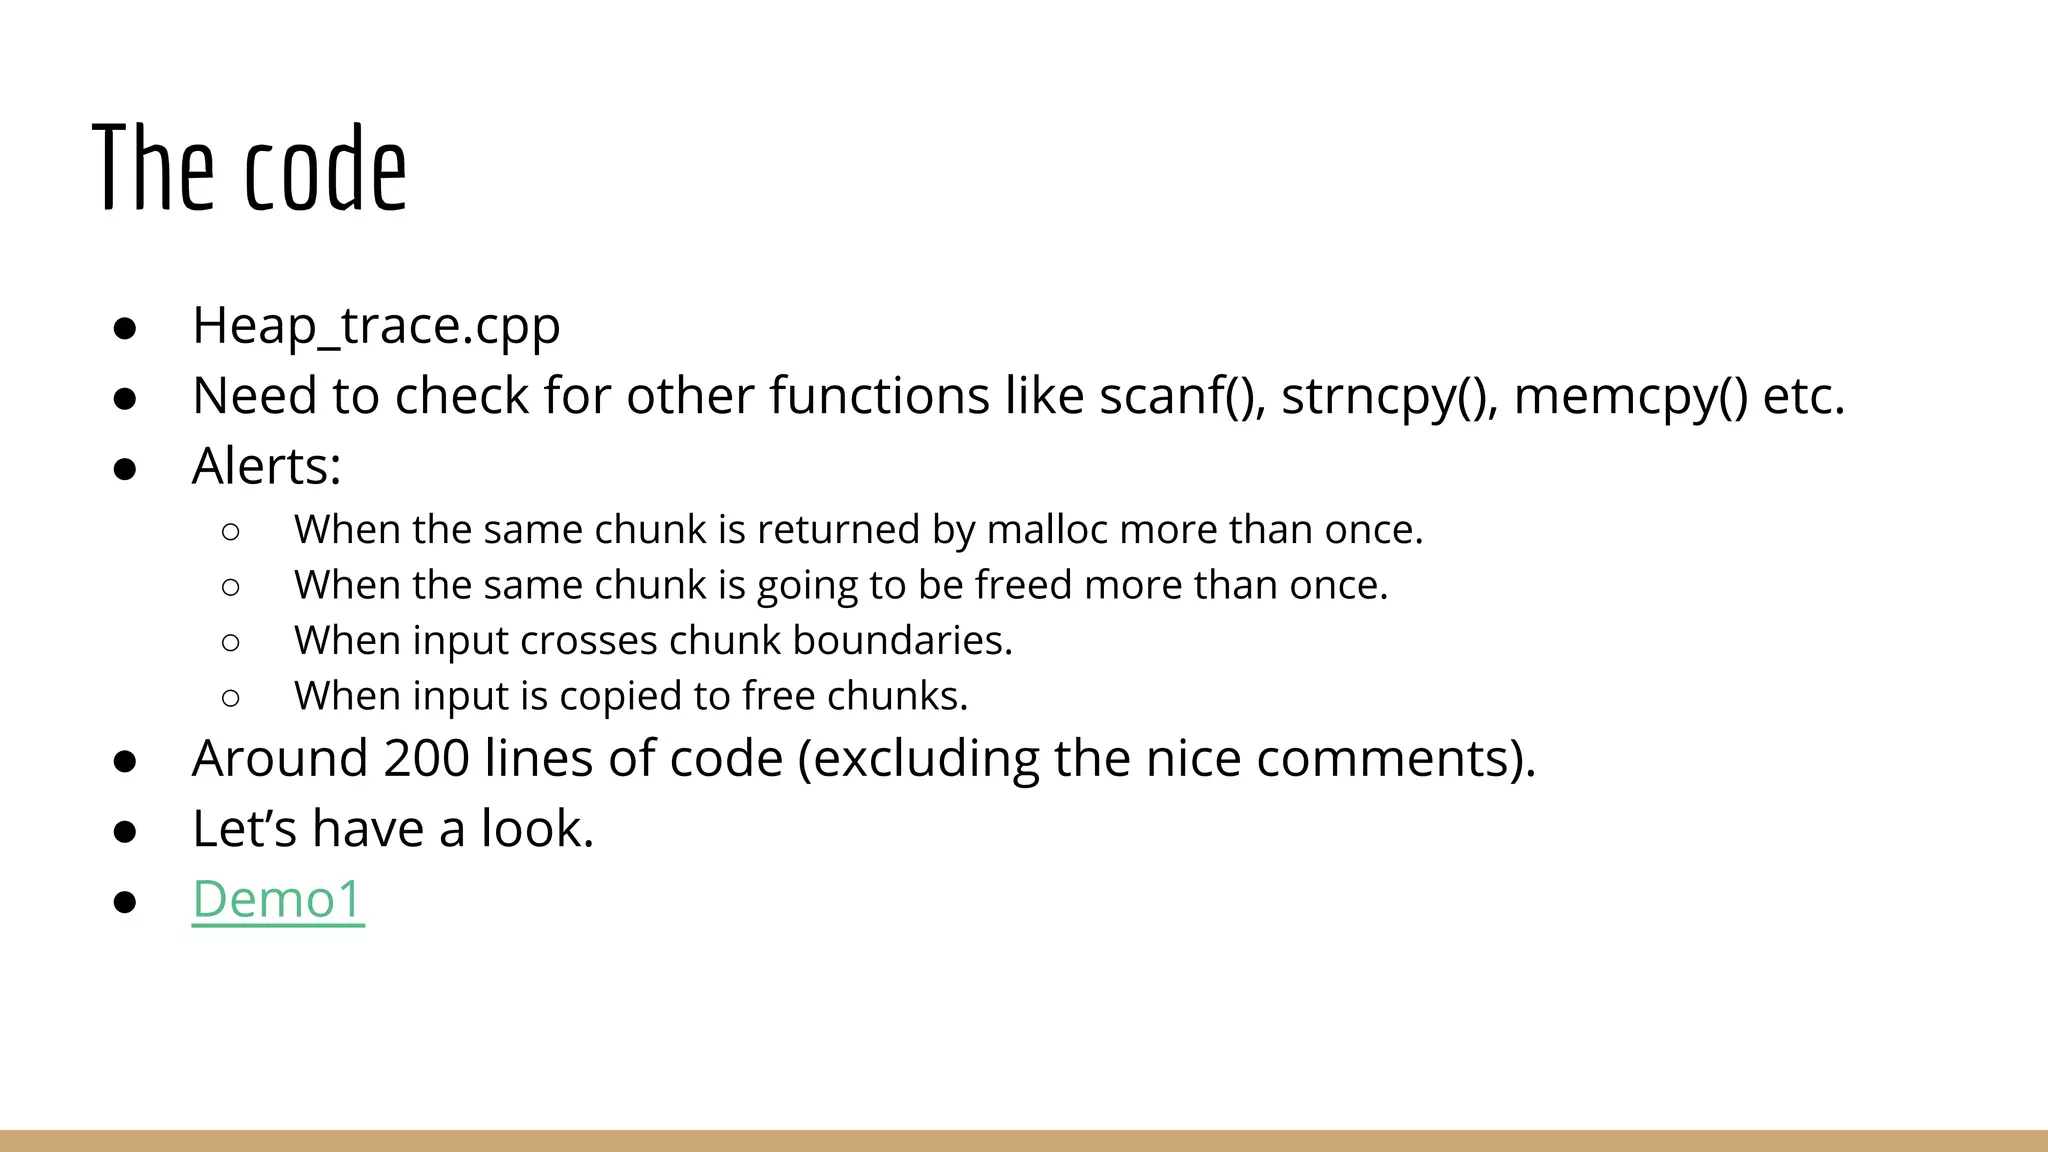
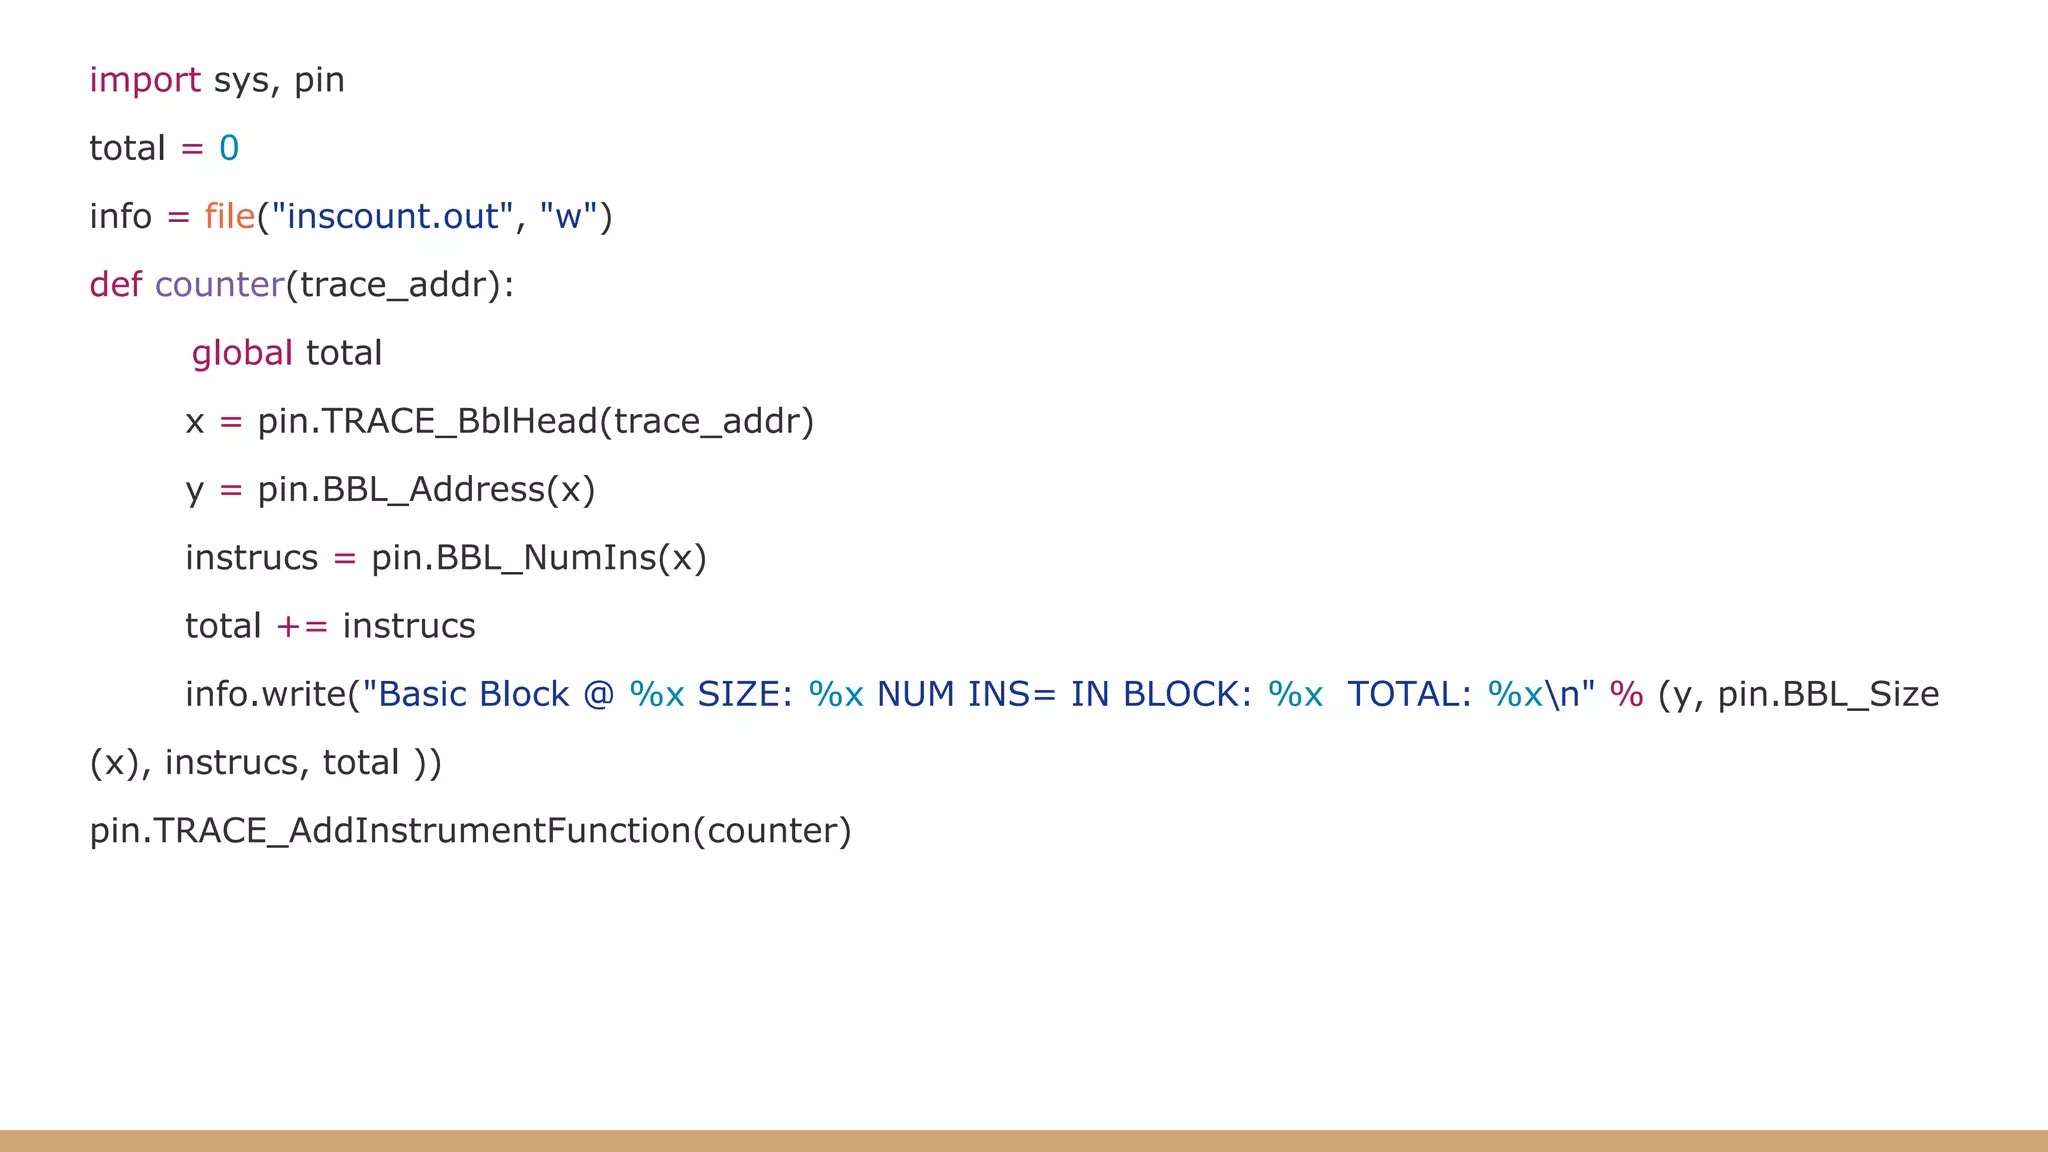
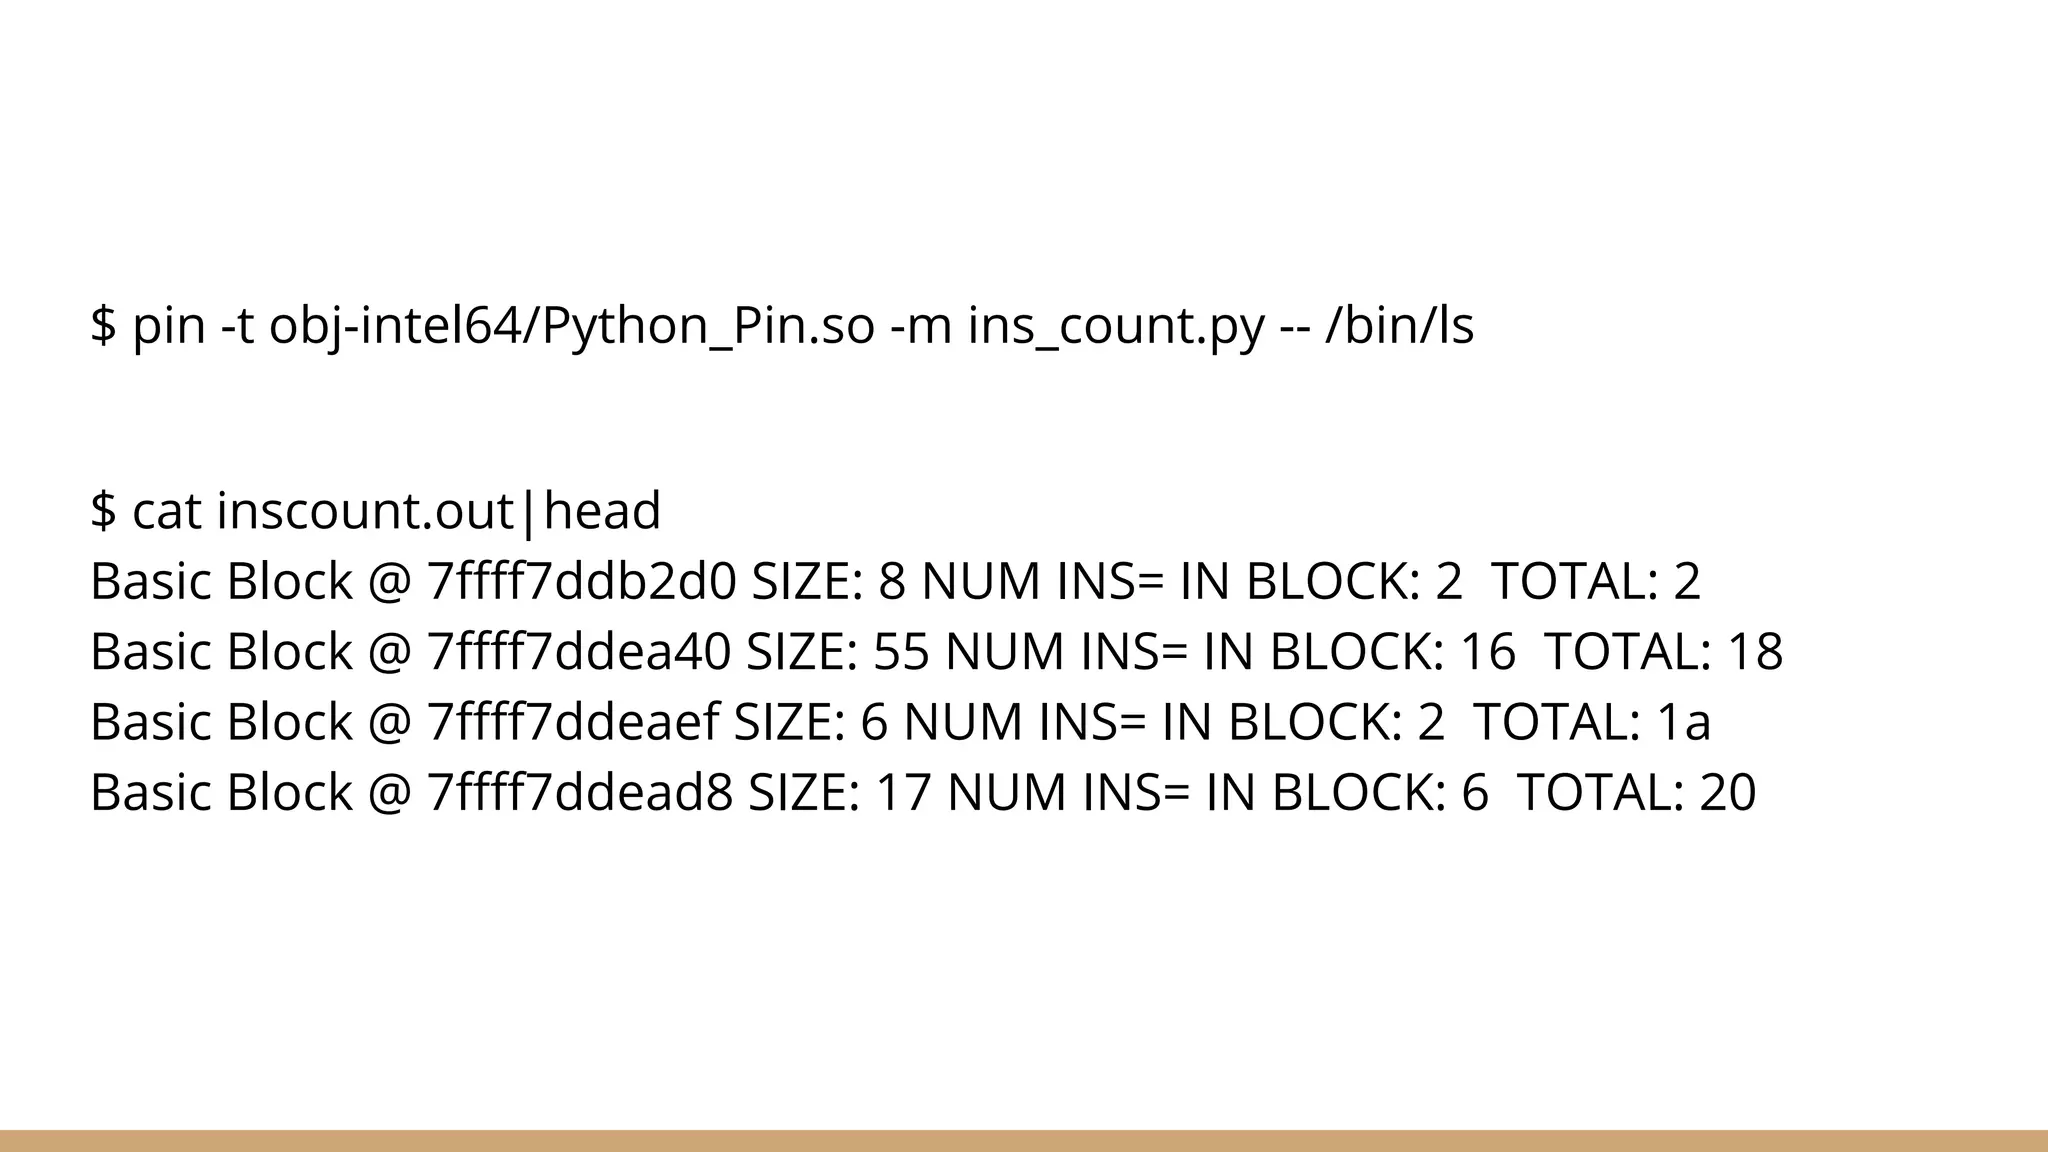
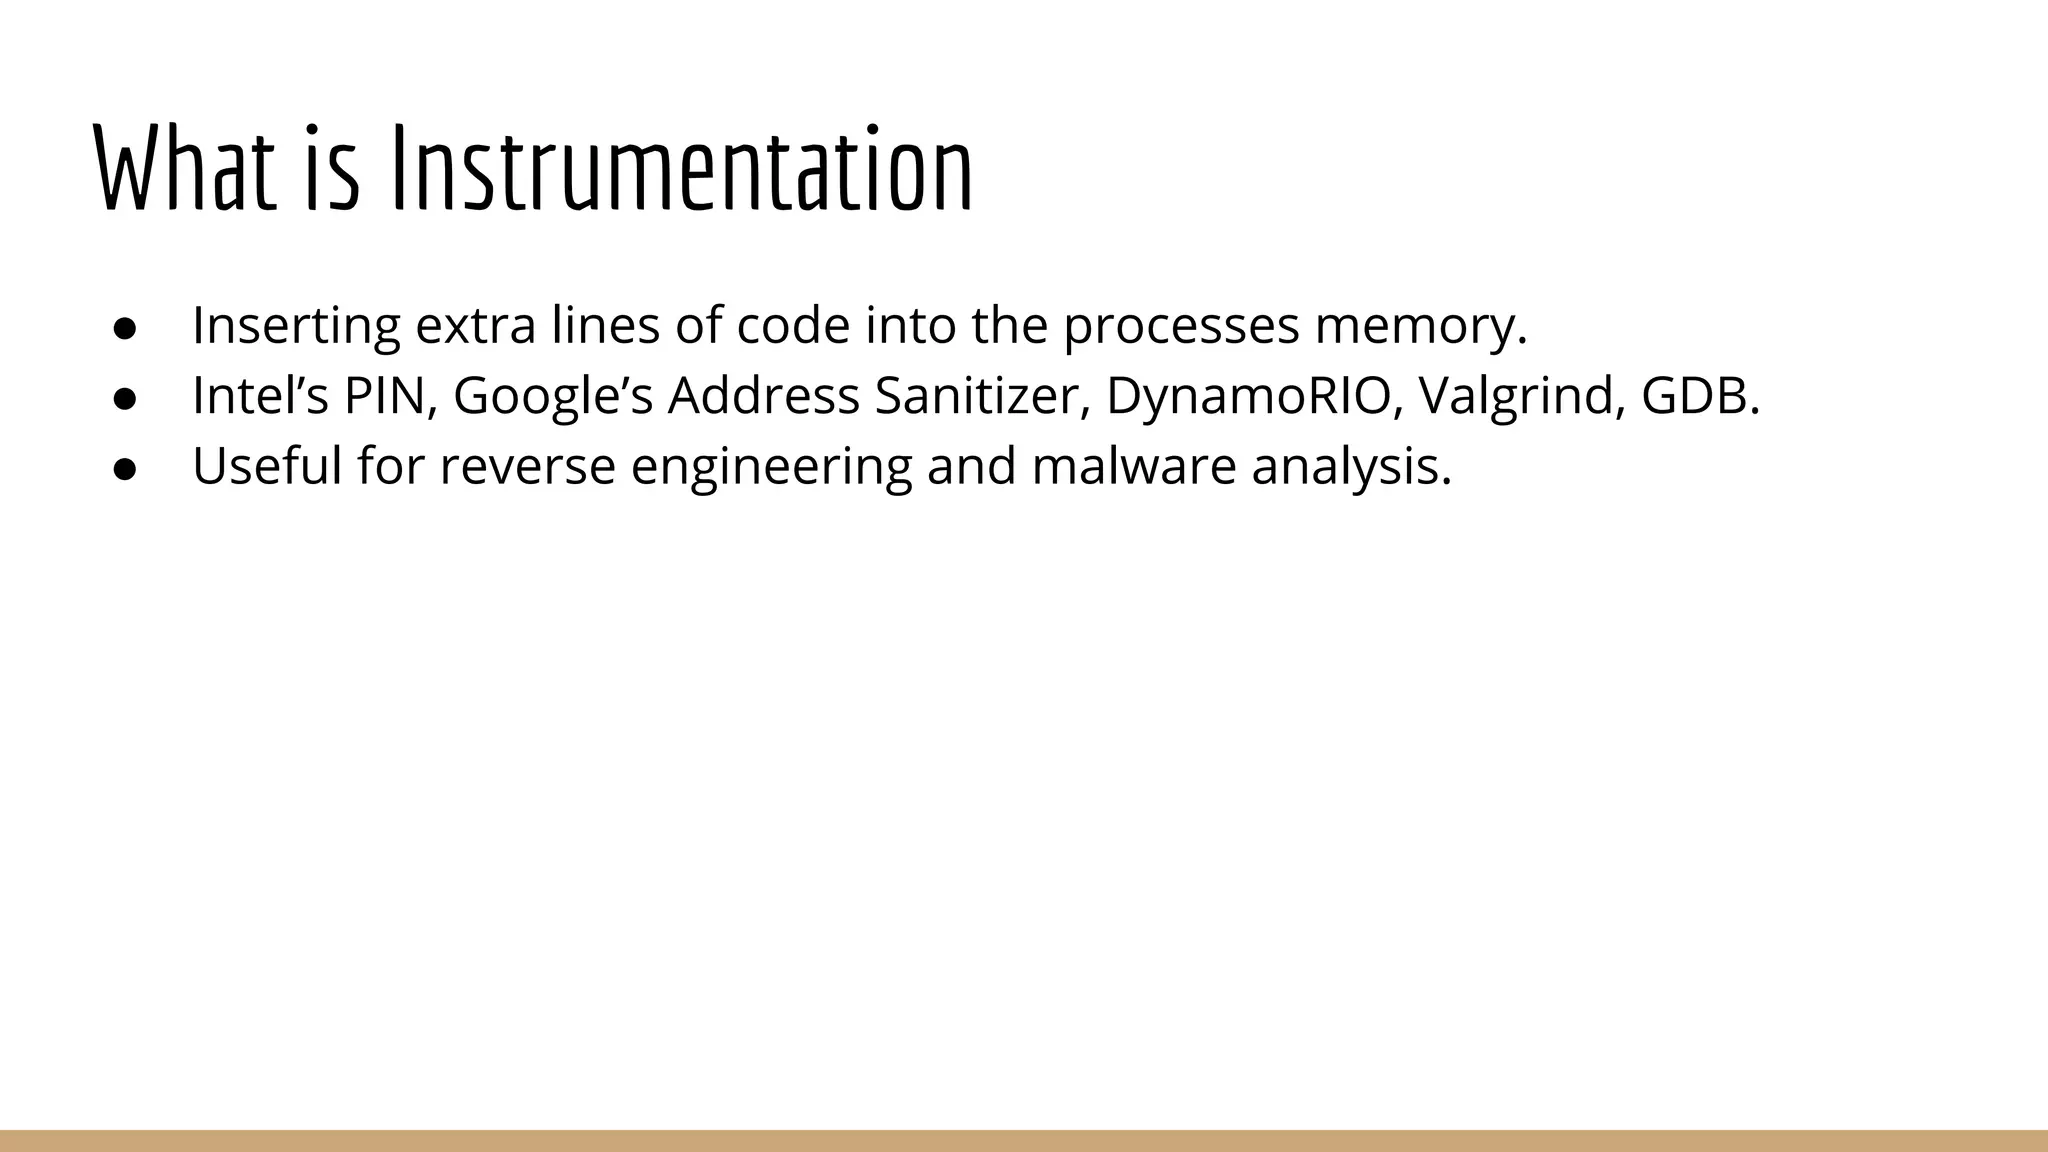
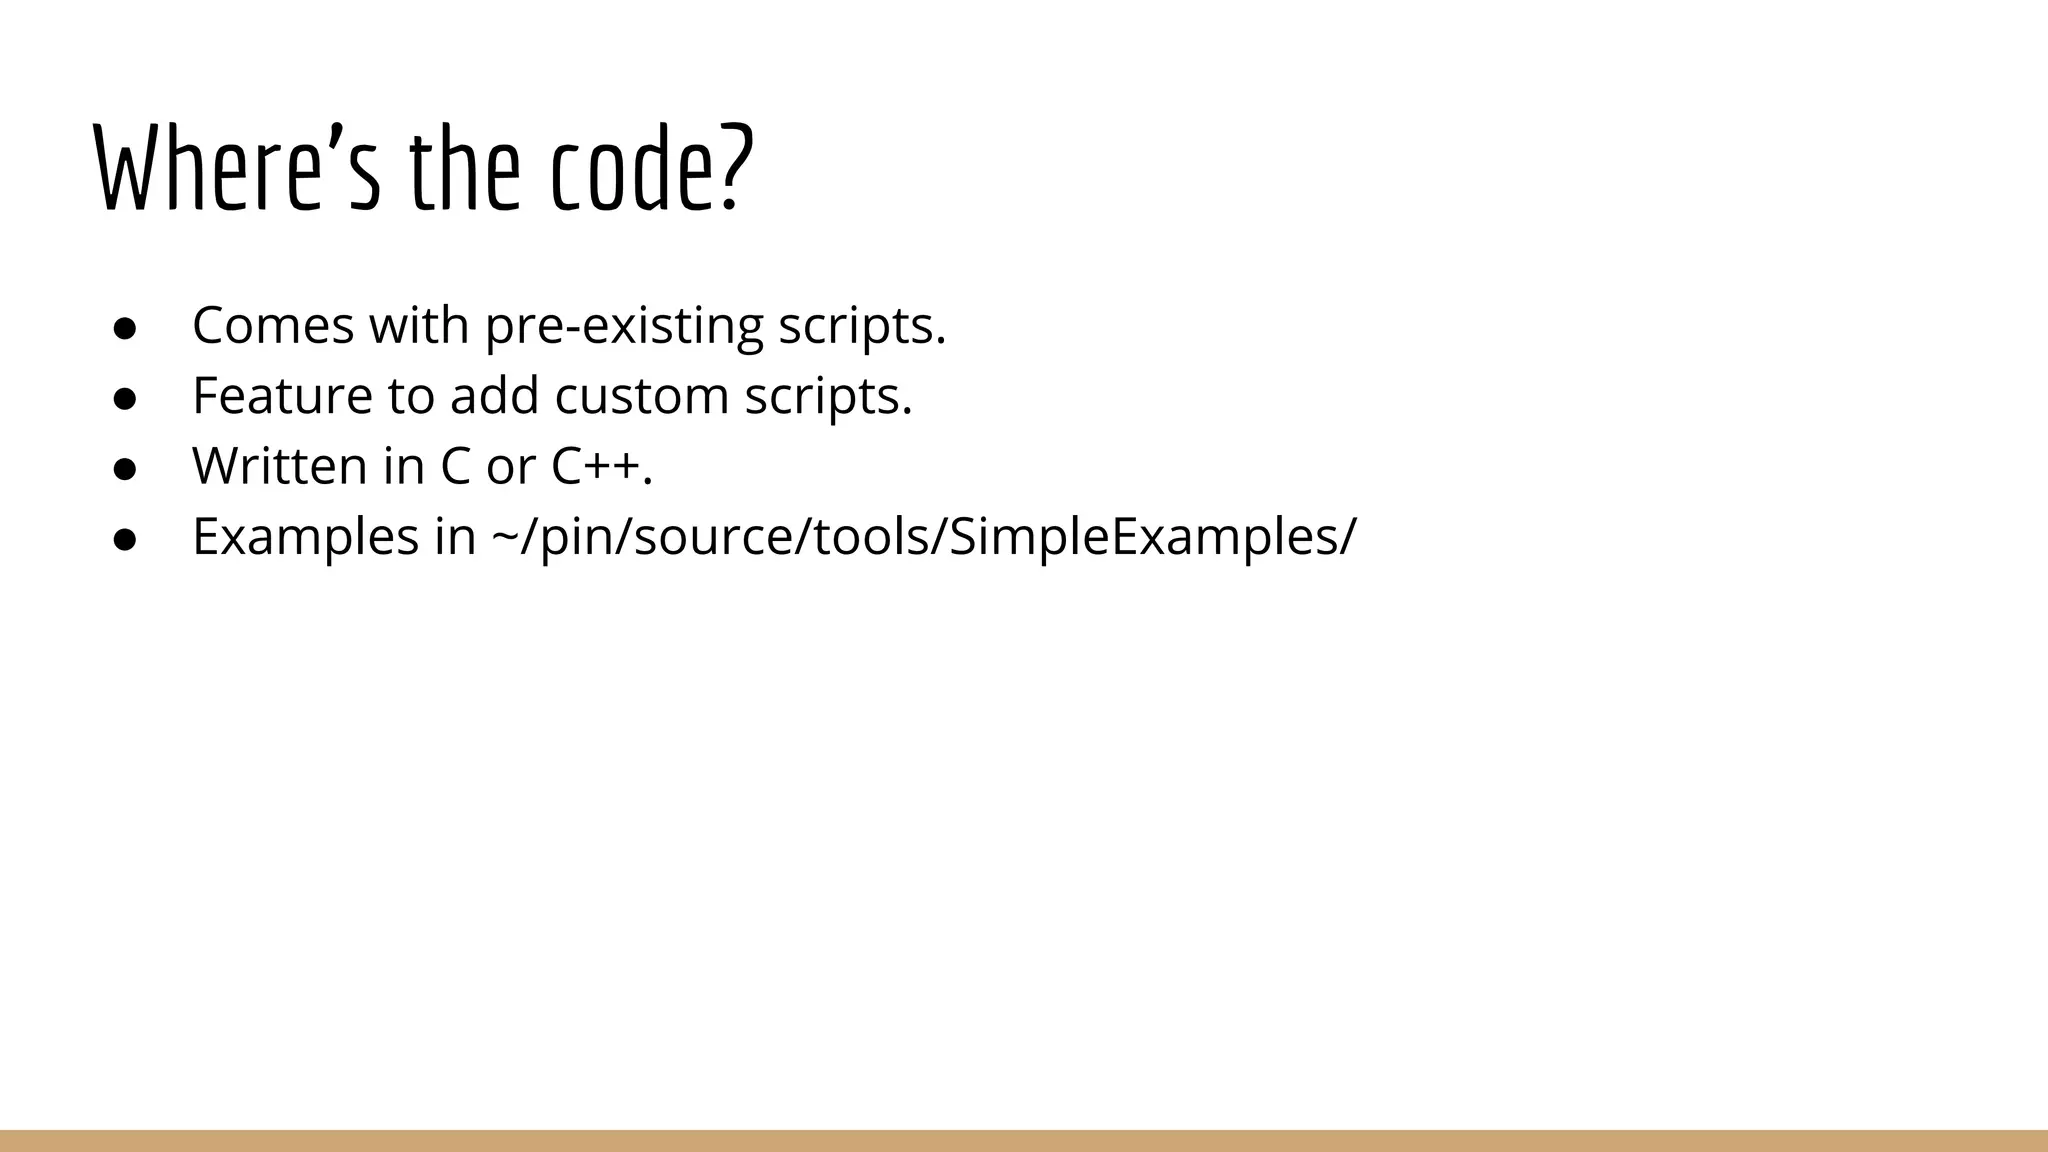
Dynamic Binary Instrumentation Using Intel’s PIN
What is Instrumentation ● Inserting extra lines of code into the processes memory. ● Intel’s PIN, Google’s Address Sanitizer, DynamoRIO, Valgrind, GDB. ● Useful for reverse engineering and malware analysis.
Why DBI …... if (size < sizeof(min_buf)) { iov_to_buf(iov, iovcnt, 0, min_buf, size); memset(&min_buf[size], 0, sizeof(min_buf) - size); } else if (iov->iov_len < MAXIMUM_ETHERNET_HDR_LEN) { /* This is very unlikely, but may happen. */ iov_to_buf(iov, iovcnt, 0, min_buf, MAXIMUM_ETHERNET_HDR_LEN); filter_buf = min_buf; } …...
…. if (size < sizeof(min_buf)) { printf(“Good size branchn”); iov_to_buf(iov, iovcnt, 0, min_buf, size); memset(&min_buf[size], 0, sizeof(min_buf) - size); } else if (iov->iov_len < MAXIMUM_ETHERNET_HDR_LEN) { /* This is very unlikely, but may happen. */ printf(“Got a rare casen”); iov_to_buf(iov, iovcnt, 0, min_buf, MAXIMUM_ETHERNET_HDR_LEN); filter_buf = min_buf; } ….
Installation guidelines ● https://labs.portcullis.co.uk/blog/an-introduction-to-binary-dynamic- analysis/ ● https://software.intel. com/sites/landingpage/pintool/docs/76991/Pin/html/
Where’s the code? ● Comes with pre-existing scripts. ● Feature to add custom scripts. ● Written in C or C++. ● Examples in ~/pin/source/tools/SimpleExamples/
#include <iostream> #include "pin.H" UINT64 icount = 0; VOID IncCounter() { icount++;} VOID Instruction(INS ins, VOID *v) { INS_InsertCall(ins, IPOINT_BEFORE, (AFUNPTR)IncCounter, IARG_END);} VOID Fini(INT32 code, VOID *v) { std::cerr << "Count " << icount << endl;} int main(int argc, char * argv[]) { PIN_Init(argc, argv); INS_AddInstrumentFunction(Instruction, 0); PIN_AddFiniFunction(Fini, 0); PIN_StartProgram(); return 0;} Analysis Instrumentation
Execution $ pin -t inscount.so -- /bin/ls inscount.cpp inscount.so inscount.o Count 422838 Output of inscount $
Detecting Heap bugs ● Keep list of used and free chunks. ● If input is read to any of these chunks, check sizes and number of bytes being read. ● In case of structure objects, check for input being read to an address inside a chunk. ● If input is read to free chunk => UAF. ● If number of bytes read > size of chunk => heap overflow. ● If chunk_start + size - address < number of bytes => heap overflow.
The code ● Heap_trace.cpp ● Need to check for other functions like scanf(), strncpy(), memcpy() etc. ● Alerts: ○ When the same chunk is returned by malloc more than once. ○ When the same chunk is going to be freed more than once. ○ When input crosses chunk boundaries. ○ When input is copied to free chunks. ● Around 200 lines of code (excluding the nice comments). ● Let’s have a look. ● Demo1
C or C++ ? That’s it? ● Kudos to the owners. ● Blankwall - Python Pin. ● A python wrapper to PIN. ● Not yet complete.
import sys, pin total = 0 info = file("inscount.out", "w") def counter(trace_addr): global total x = pin.TRACE_BblHead(trace_addr) y = pin.BBL_Address(x) instrucs = pin.BBL_NumIns(x) total += instrucs info.write("Basic Block @ %x SIZE: %x NUM INS= IN BLOCK: %x TOTAL: %xn" % (y, pin.BBL_Size (x), instrucs, total )) pin.TRACE_AddInstrumentFunction(counter)
$ pin -t obj-intel64/Python_Pin.so -m ins_count.py -- /bin/ls $ cat inscount.out|head Basic Block @ 7ffff7ddb2d0 SIZE: 8 NUM INS= IN BLOCK: 2 TOTAL: 2 Basic Block @ 7ffff7ddea40 SIZE: 55 NUM INS= IN BLOCK: 16 TOTAL: 18 Basic Block @ 7ffff7ddeaef SIZE: 6 NUM INS= IN BLOCK: 2 TOTAL: 1a Basic Block @ 7ffff7ddead8 SIZE: 17 NUM INS= IN BLOCK: 6 TOTAL: 20
Heap_Tracer.py ? ● 90 lines of code. ( Hurray! ) ● Let’s take a look. ● Demo2

Dynamic Binary Instrumentation

  • 1.
  • 2.
    What is Instrumentation ●Inserting extra lines of code into the processes memory. ● Intel’s PIN, Google’s Address Sanitizer, DynamoRIO, Valgrind, GDB. ● Useful for reverse engineering and malware analysis.
  • 3.
    Why DBI …... if (size< sizeof(min_buf)) { iov_to_buf(iov, iovcnt, 0, min_buf, size); memset(&min_buf[size], 0, sizeof(min_buf) - size); } else if (iov->iov_len < MAXIMUM_ETHERNET_HDR_LEN) { /* This is very unlikely, but may happen. */ iov_to_buf(iov, iovcnt, 0, min_buf, MAXIMUM_ETHERNET_HDR_LEN); filter_buf = min_buf; } …...
  • 4.
    …. if (size <sizeof(min_buf)) { printf(“Good size branchn”); iov_to_buf(iov, iovcnt, 0, min_buf, size); memset(&min_buf[size], 0, sizeof(min_buf) - size); } else if (iov->iov_len < MAXIMUM_ETHERNET_HDR_LEN) { /* This is very unlikely, but may happen. */ printf(“Got a rare casen”); iov_to_buf(iov, iovcnt, 0, min_buf, MAXIMUM_ETHERNET_HDR_LEN); filter_buf = min_buf; } ….
  • 5.
    Installation guidelines ● https://labs.portcullis.co.uk/blog/an-introduction-to-binary-dynamic- analysis/ ●https://software.intel. com/sites/landingpage/pintool/docs/76991/Pin/html/
  • 6.
    Where’s the code? ●Comes with pre-existing scripts. ● Feature to add custom scripts. ● Written in C or C++. ● Examples in ~/pin/source/tools/SimpleExamples/
  • 7.
    #include <iostream> #include "pin.H" UINT64icount = 0; VOID IncCounter() { icount++;} VOID Instruction(INS ins, VOID *v) { INS_InsertCall(ins, IPOINT_BEFORE, (AFUNPTR)IncCounter, IARG_END);} VOID Fini(INT32 code, VOID *v) { std::cerr << "Count " << icount << endl;} int main(int argc, char * argv[]) { PIN_Init(argc, argv); INS_AddInstrumentFunction(Instruction, 0); PIN_AddFiniFunction(Fini, 0); PIN_StartProgram(); return 0;} Analysis Instrumentation
  • 8.
    Execution $ pin -tinscount.so -- /bin/ls inscount.cpp inscount.so inscount.o Count 422838 Output of inscount $
  • 9.
    Detecting Heap bugs ●Keep list of used and free chunks. ● If input is read to any of these chunks, check sizes and number of bytes being read. ● In case of structure objects, check for input being read to an address inside a chunk. ● If input is read to free chunk => UAF. ● If number of bytes read > size of chunk => heap overflow. ● If chunk_start + size - address < number of bytes => heap overflow.
  • 10.
    The code ● Heap_trace.cpp ●Need to check for other functions like scanf(), strncpy(), memcpy() etc. ● Alerts: ○ When the same chunk is returned by malloc more than once. ○ When the same chunk is going to be freed more than once. ○ When input crosses chunk boundaries. ○ When input is copied to free chunks. ● Around 200 lines of code (excluding the nice comments). ● Let’s have a look. ● Demo1
  • 11.
    C or C++? That’s it? ● Kudos to the owners. ● Blankwall - Python Pin. ● A python wrapper to PIN. ● Not yet complete.
  • 12.
    import sys, pin total= 0 info = file("inscount.out", "w") def counter(trace_addr): global total x = pin.TRACE_BblHead(trace_addr) y = pin.BBL_Address(x) instrucs = pin.BBL_NumIns(x) total += instrucs info.write("Basic Block @ %x SIZE: %x NUM INS= IN BLOCK: %x TOTAL: %xn" % (y, pin.BBL_Size (x), instrucs, total )) pin.TRACE_AddInstrumentFunction(counter)
  • 13.
    $ pin -tobj-intel64/Python_Pin.so -m ins_count.py -- /bin/ls $ cat inscount.out|head Basic Block @ 7ffff7ddb2d0 SIZE: 8 NUM INS= IN BLOCK: 2 TOTAL: 2 Basic Block @ 7ffff7ddea40 SIZE: 55 NUM INS= IN BLOCK: 16 TOTAL: 18 Basic Block @ 7ffff7ddeaef SIZE: 6 NUM INS= IN BLOCK: 2 TOTAL: 1a Basic Block @ 7ffff7ddead8 SIZE: 17 NUM INS= IN BLOCK: 6 TOTAL: 20
  • 14.
    Heap_Tracer.py ? ● 90lines of code. ( Hurray! ) ● Let’s take a look. ● Demo2