Downloaded 41 times


![Implementing… § Moving average calculation (20-day window) § Volatility Indicator § Average True Range Indicator (moving average) o [ max(t) - min(t) ] o [ max(t) - close(t-1) ] o [ max(t) - close(t-1) ]](https://image.slidesharecdn.com/developinghighfrequencyindicatorsusingreal-timetickdataonapachesupersetanddruid-190402055627/75/Developing-high-frequency-indicators-using-real-time-tick-data-on-apache-superset-and-druid-49-2048.jpg)


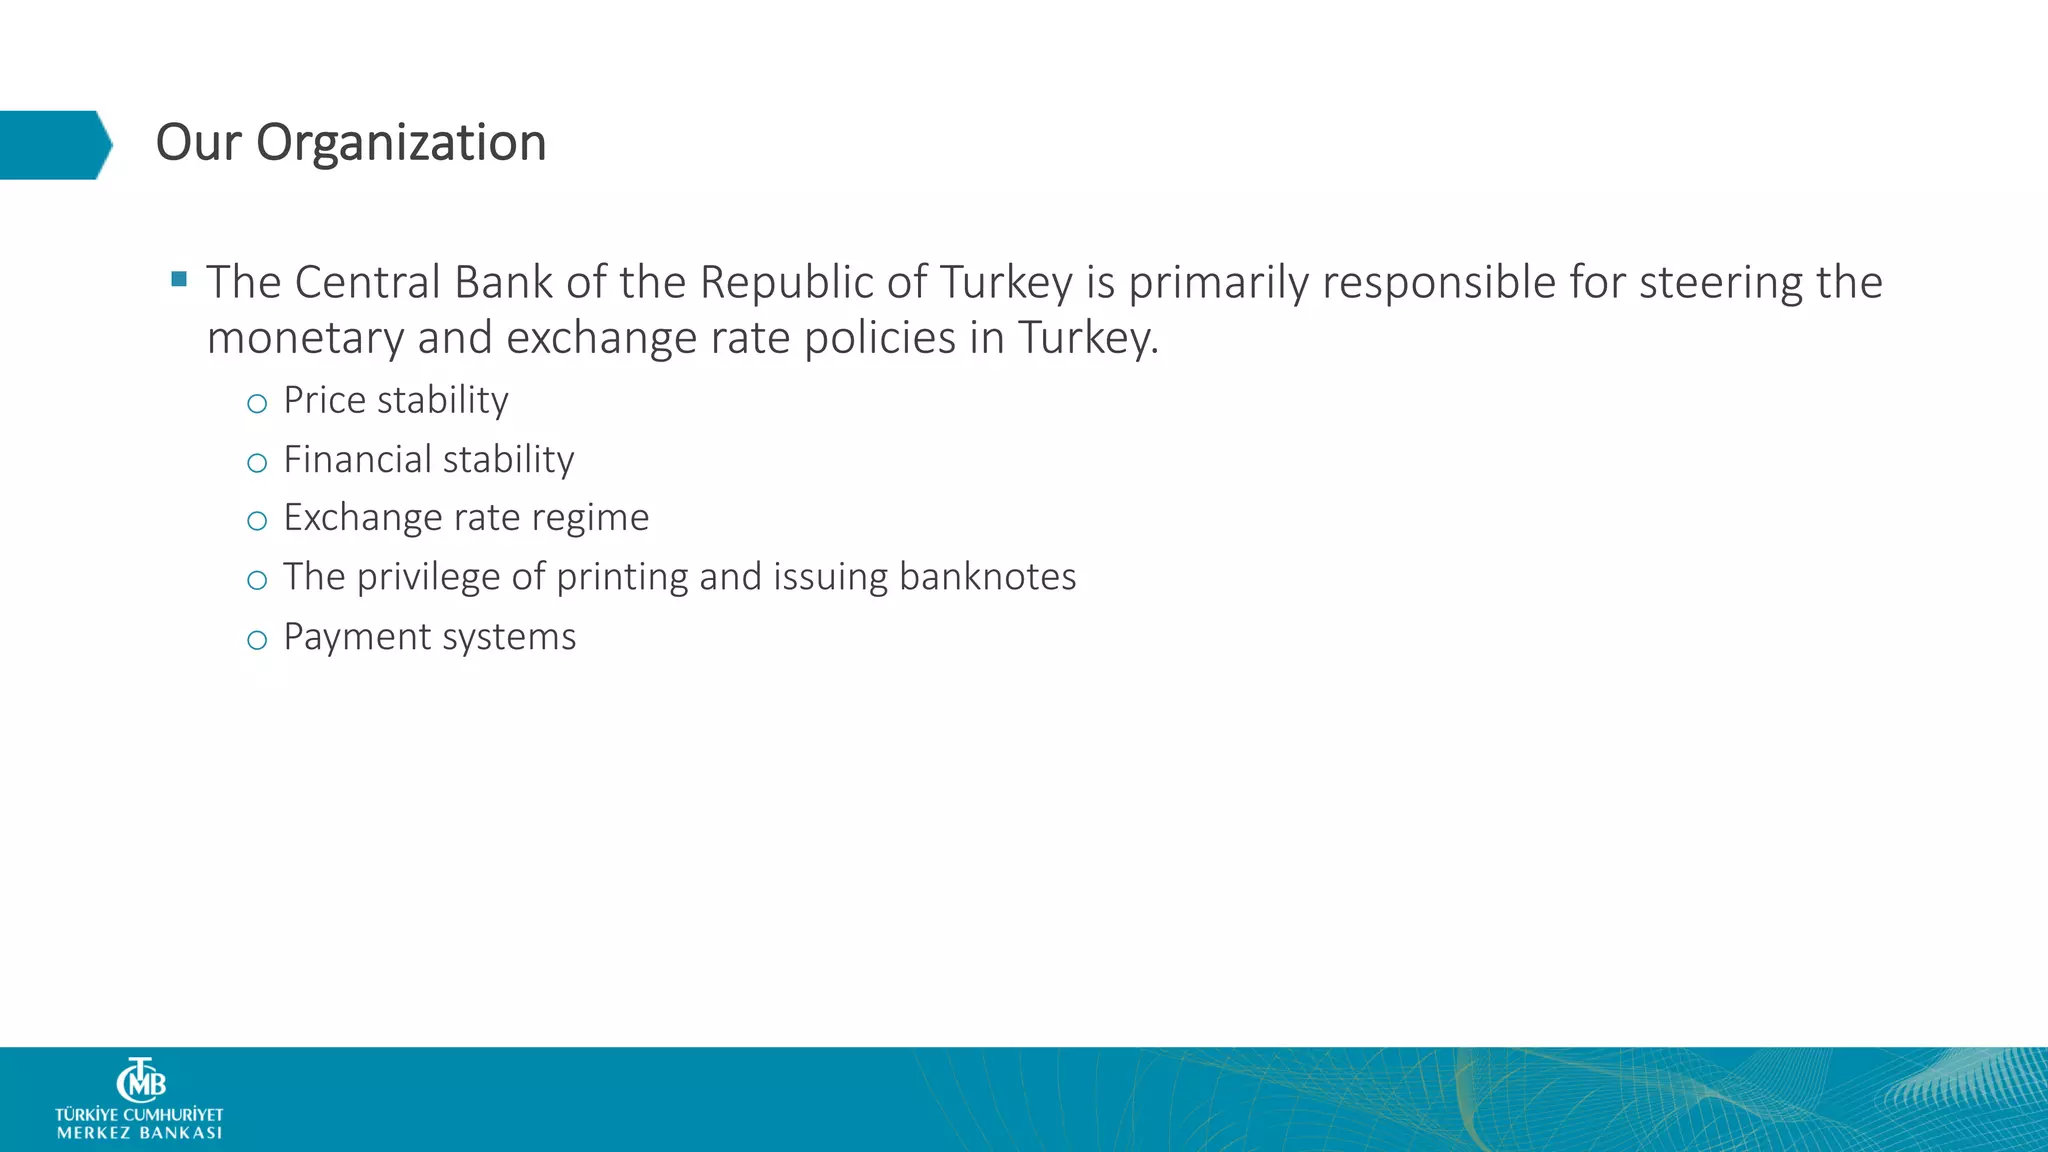
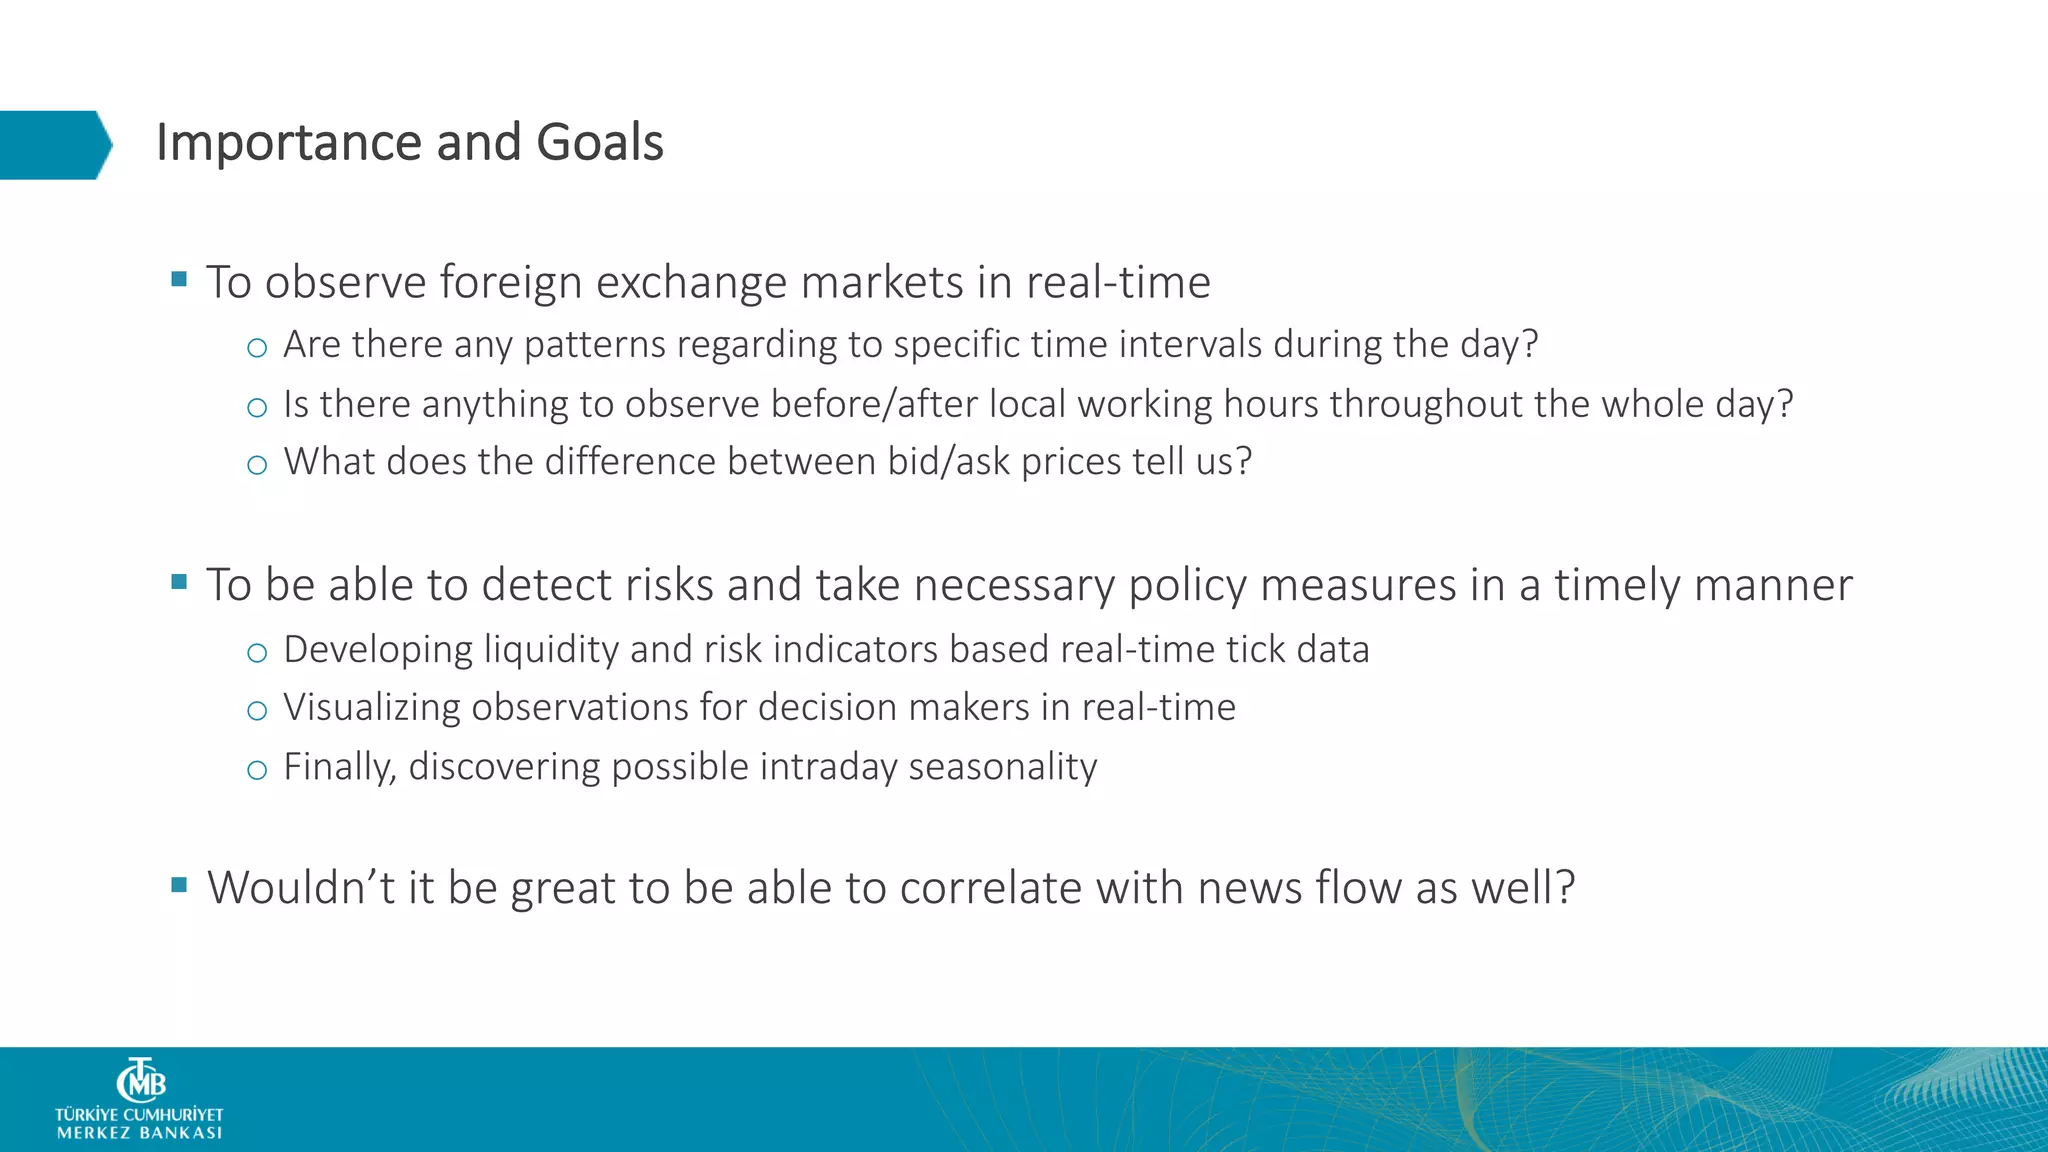
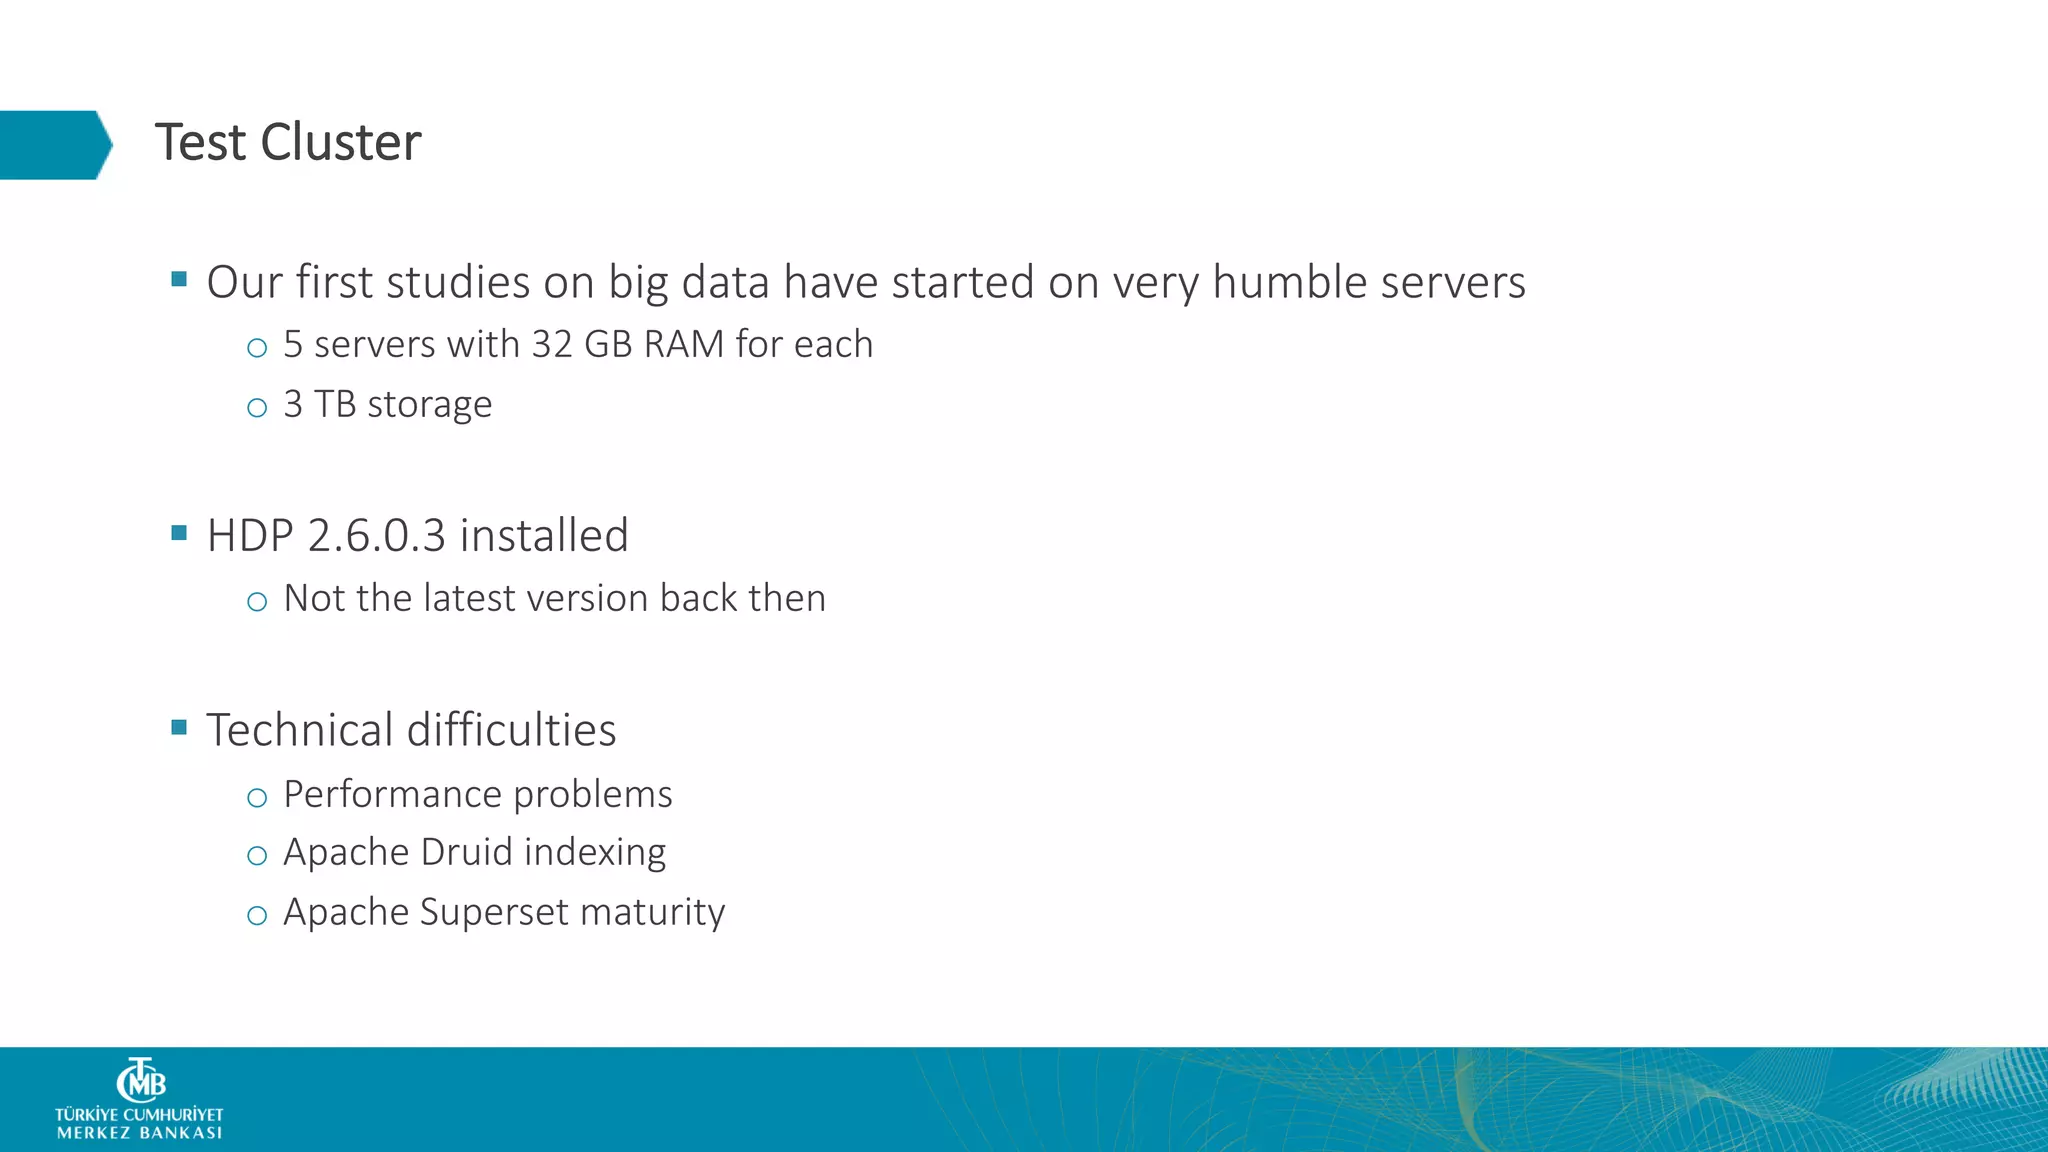
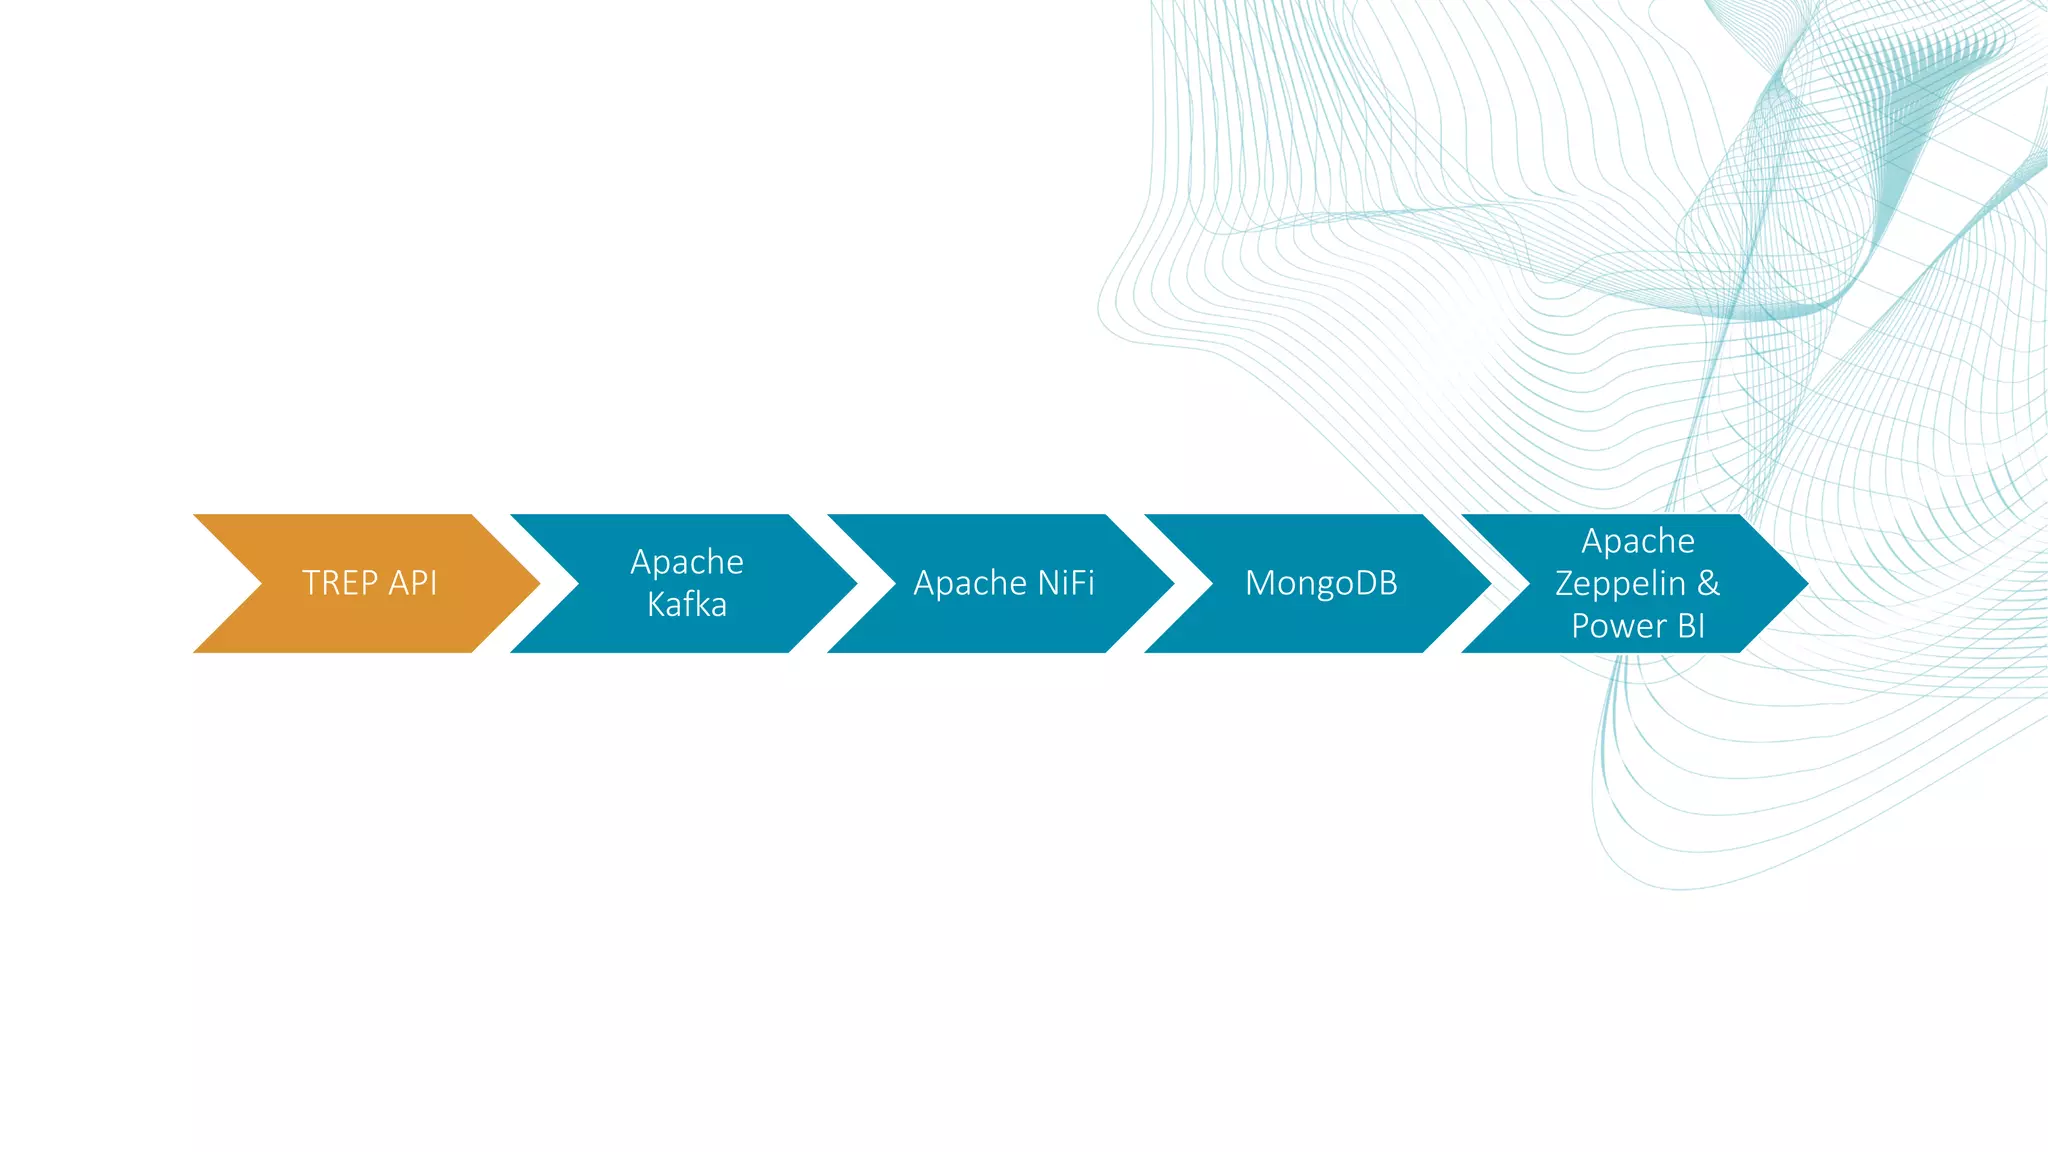
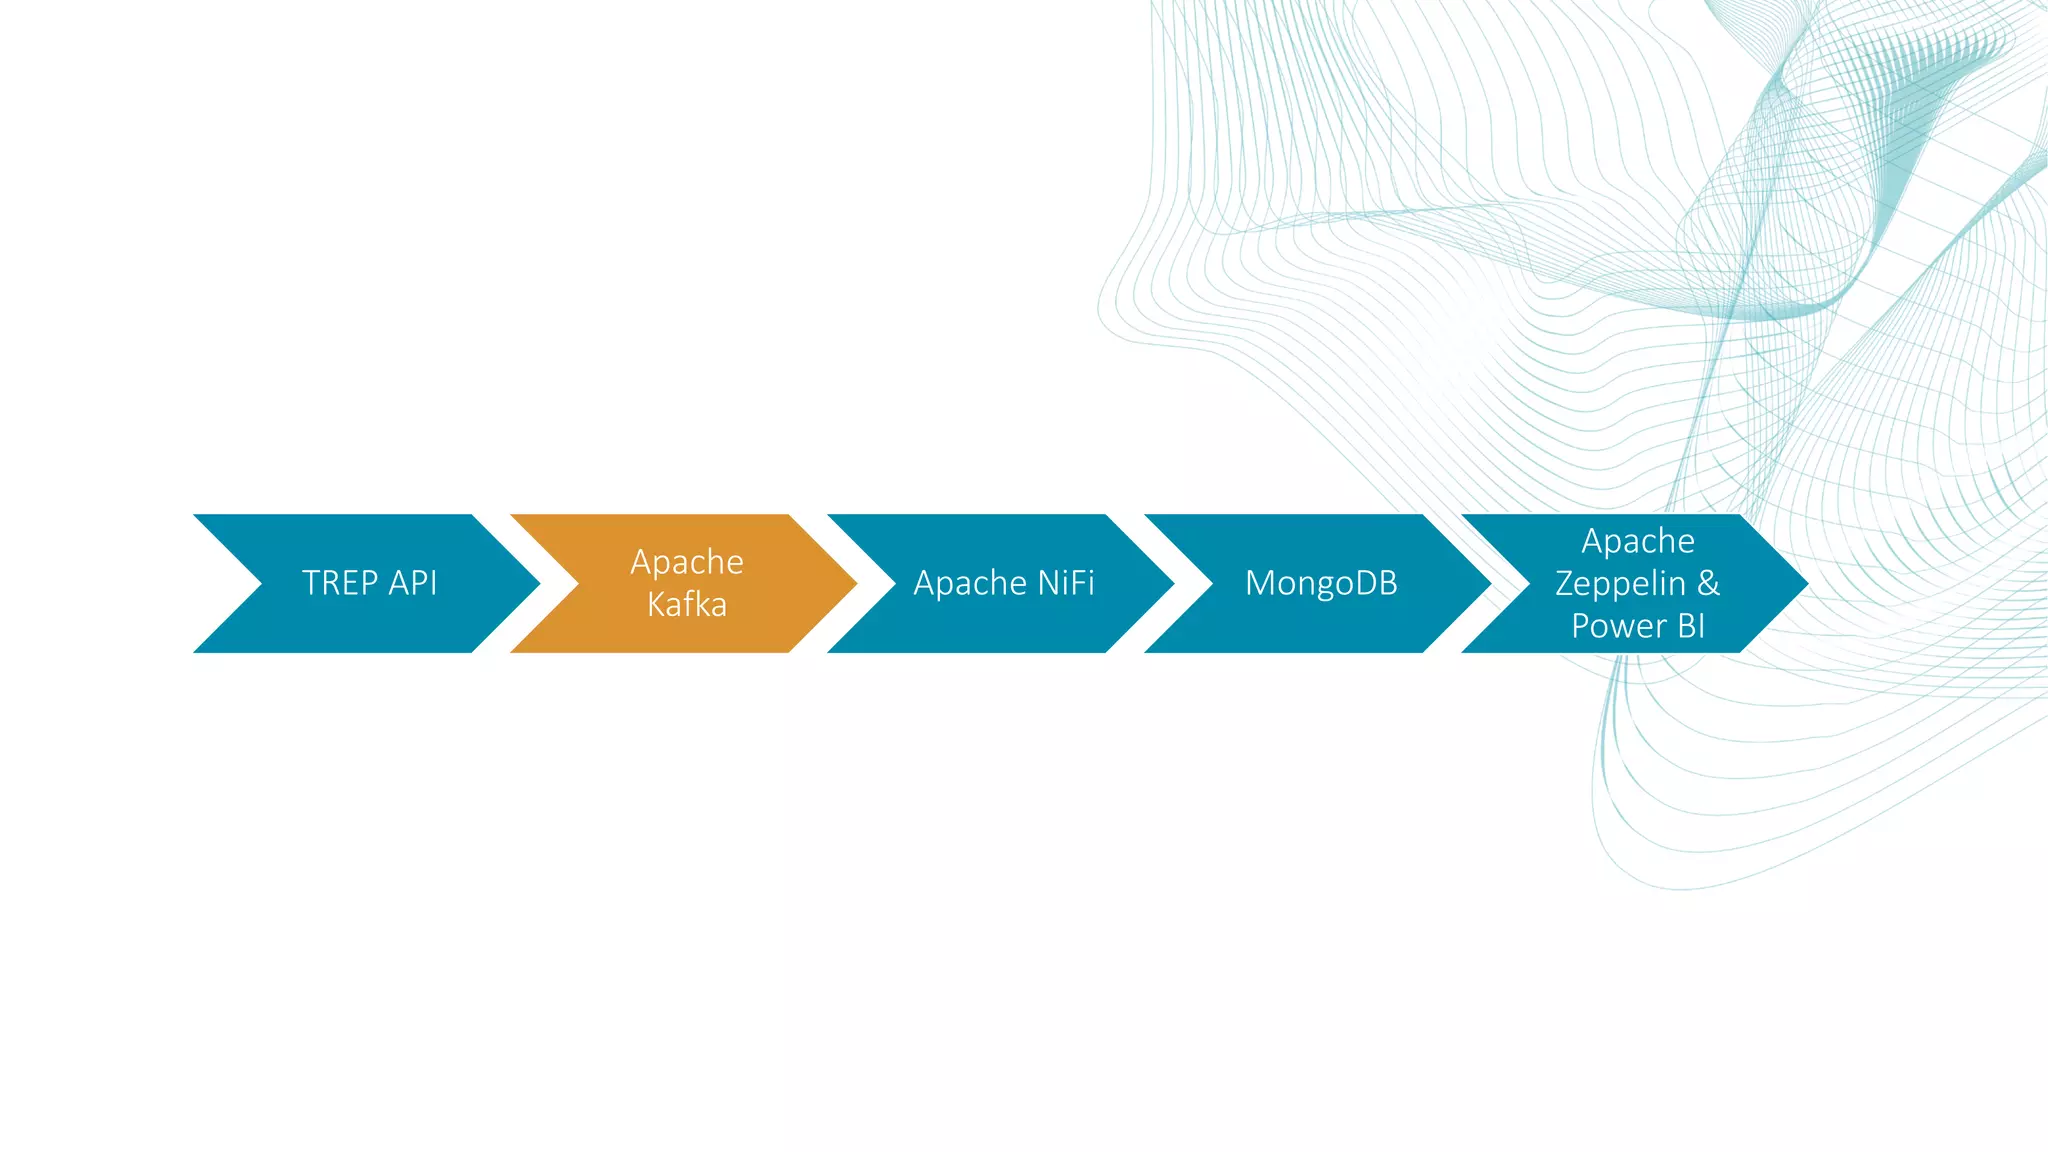
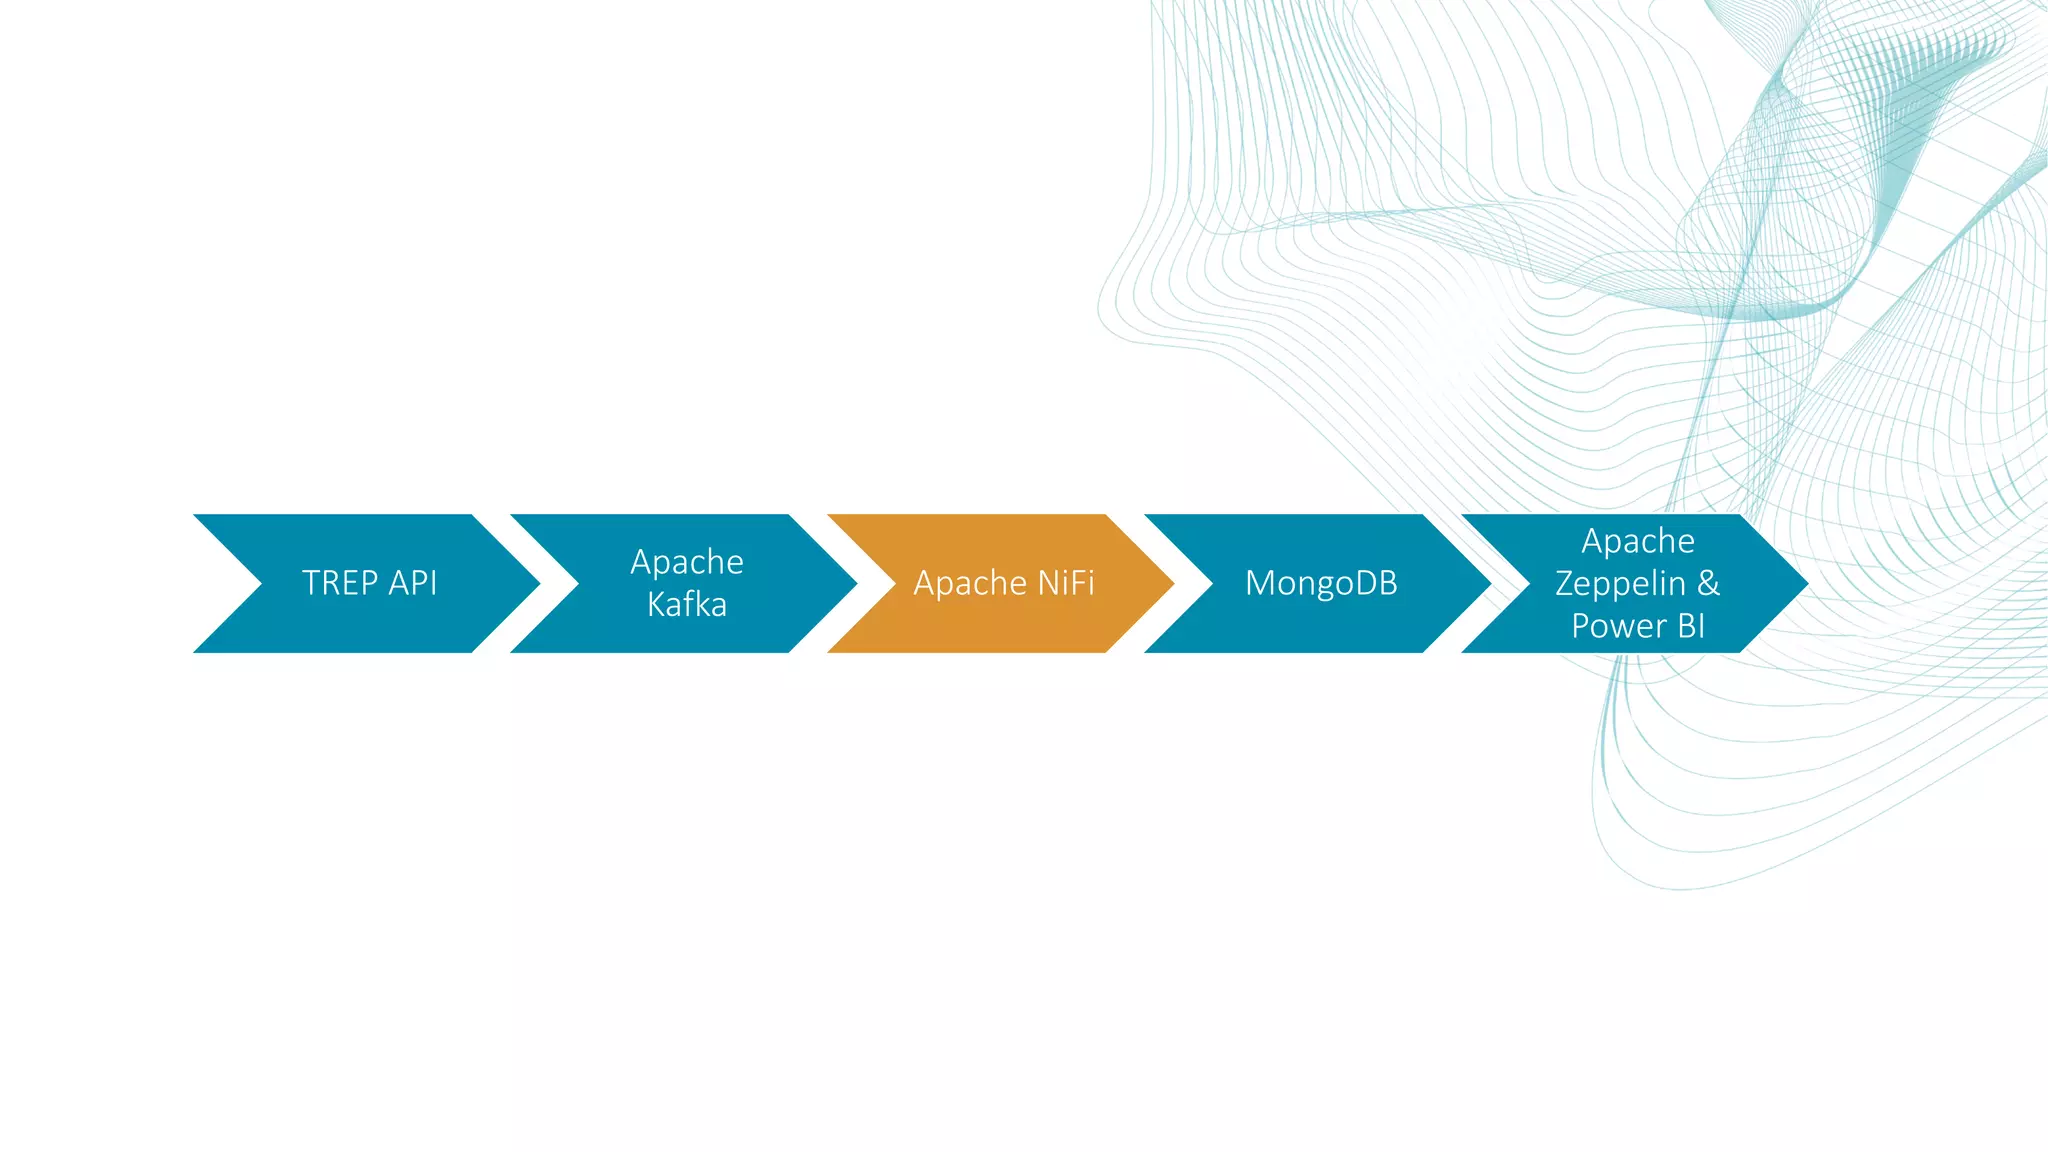
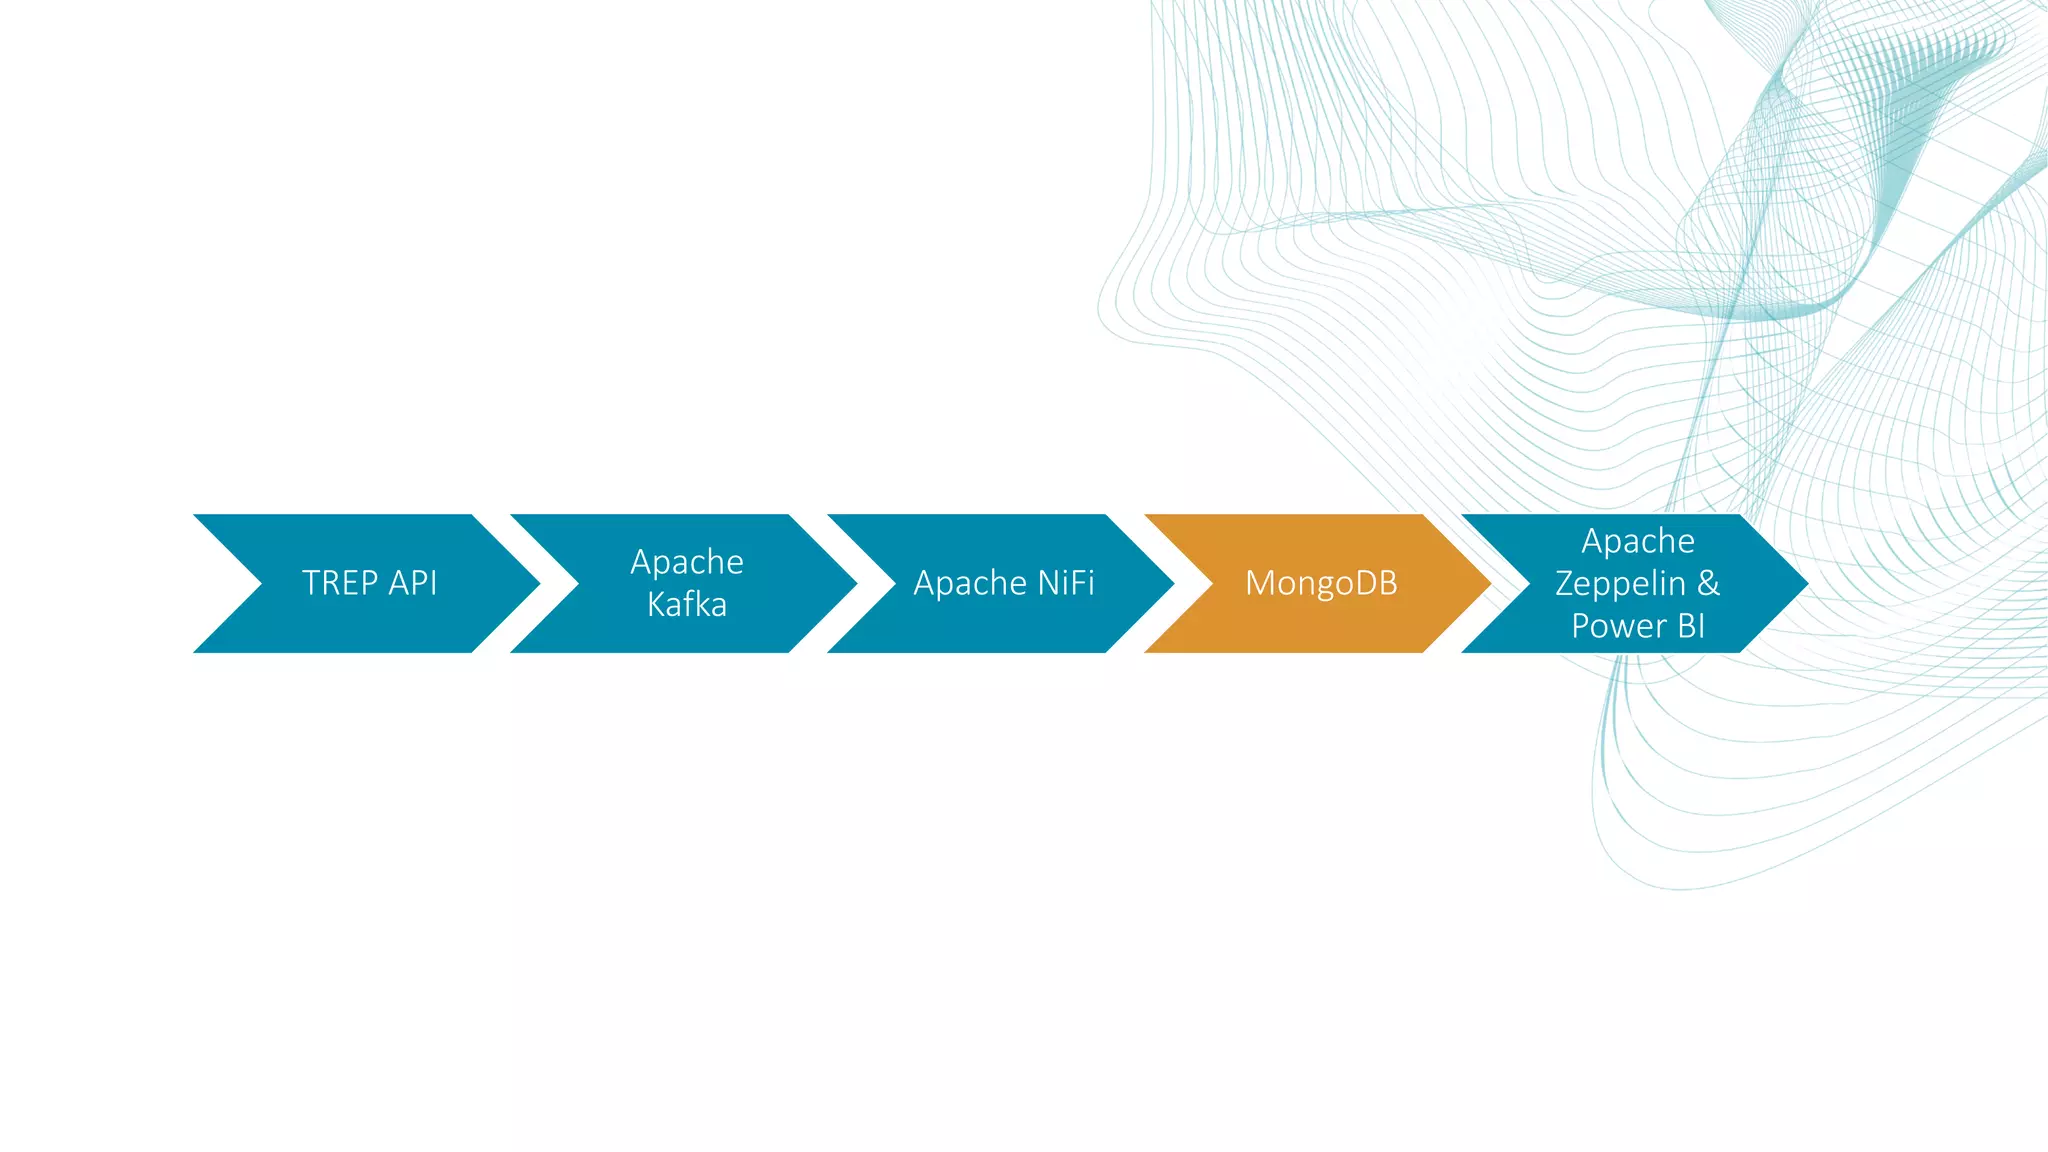
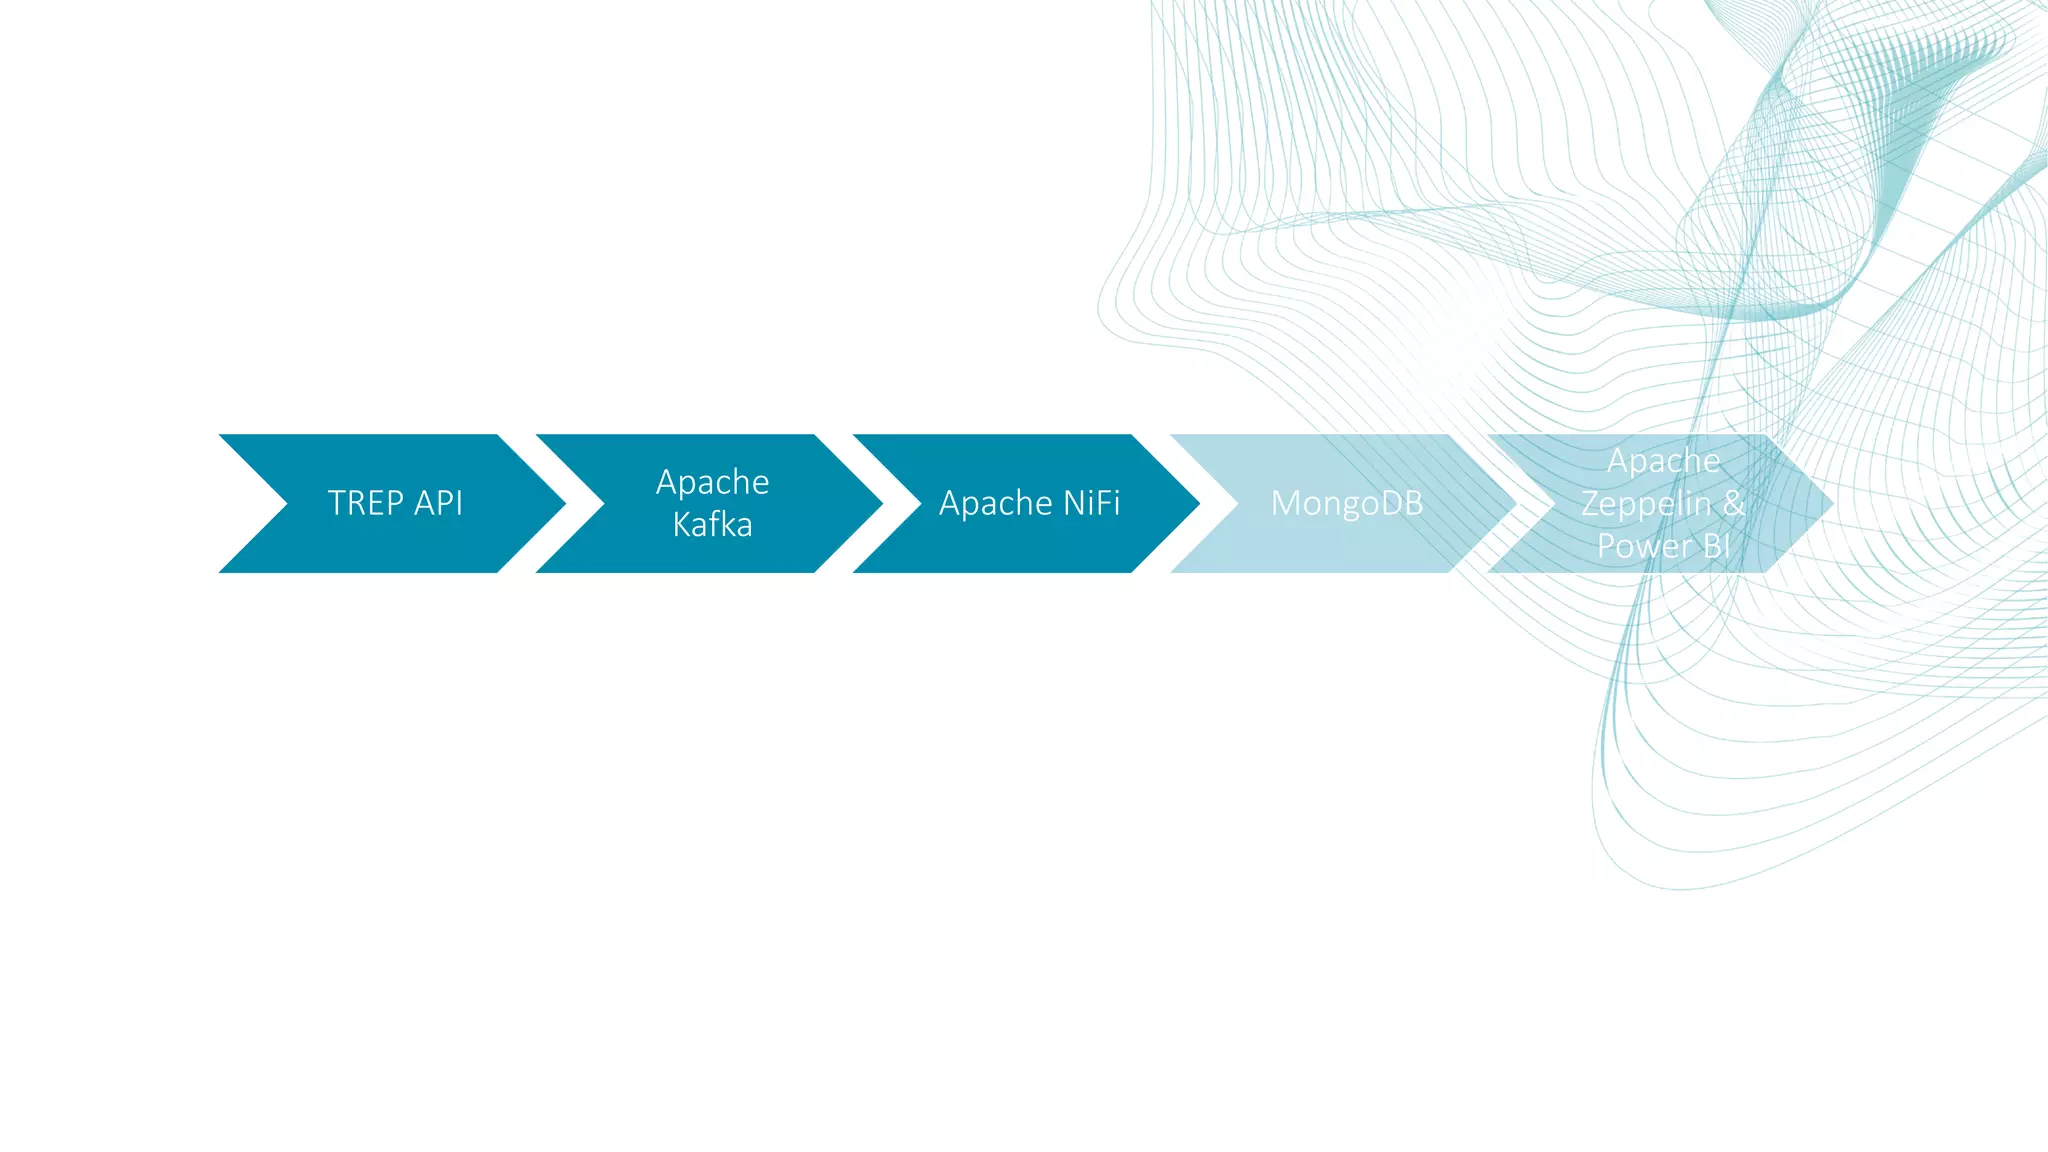
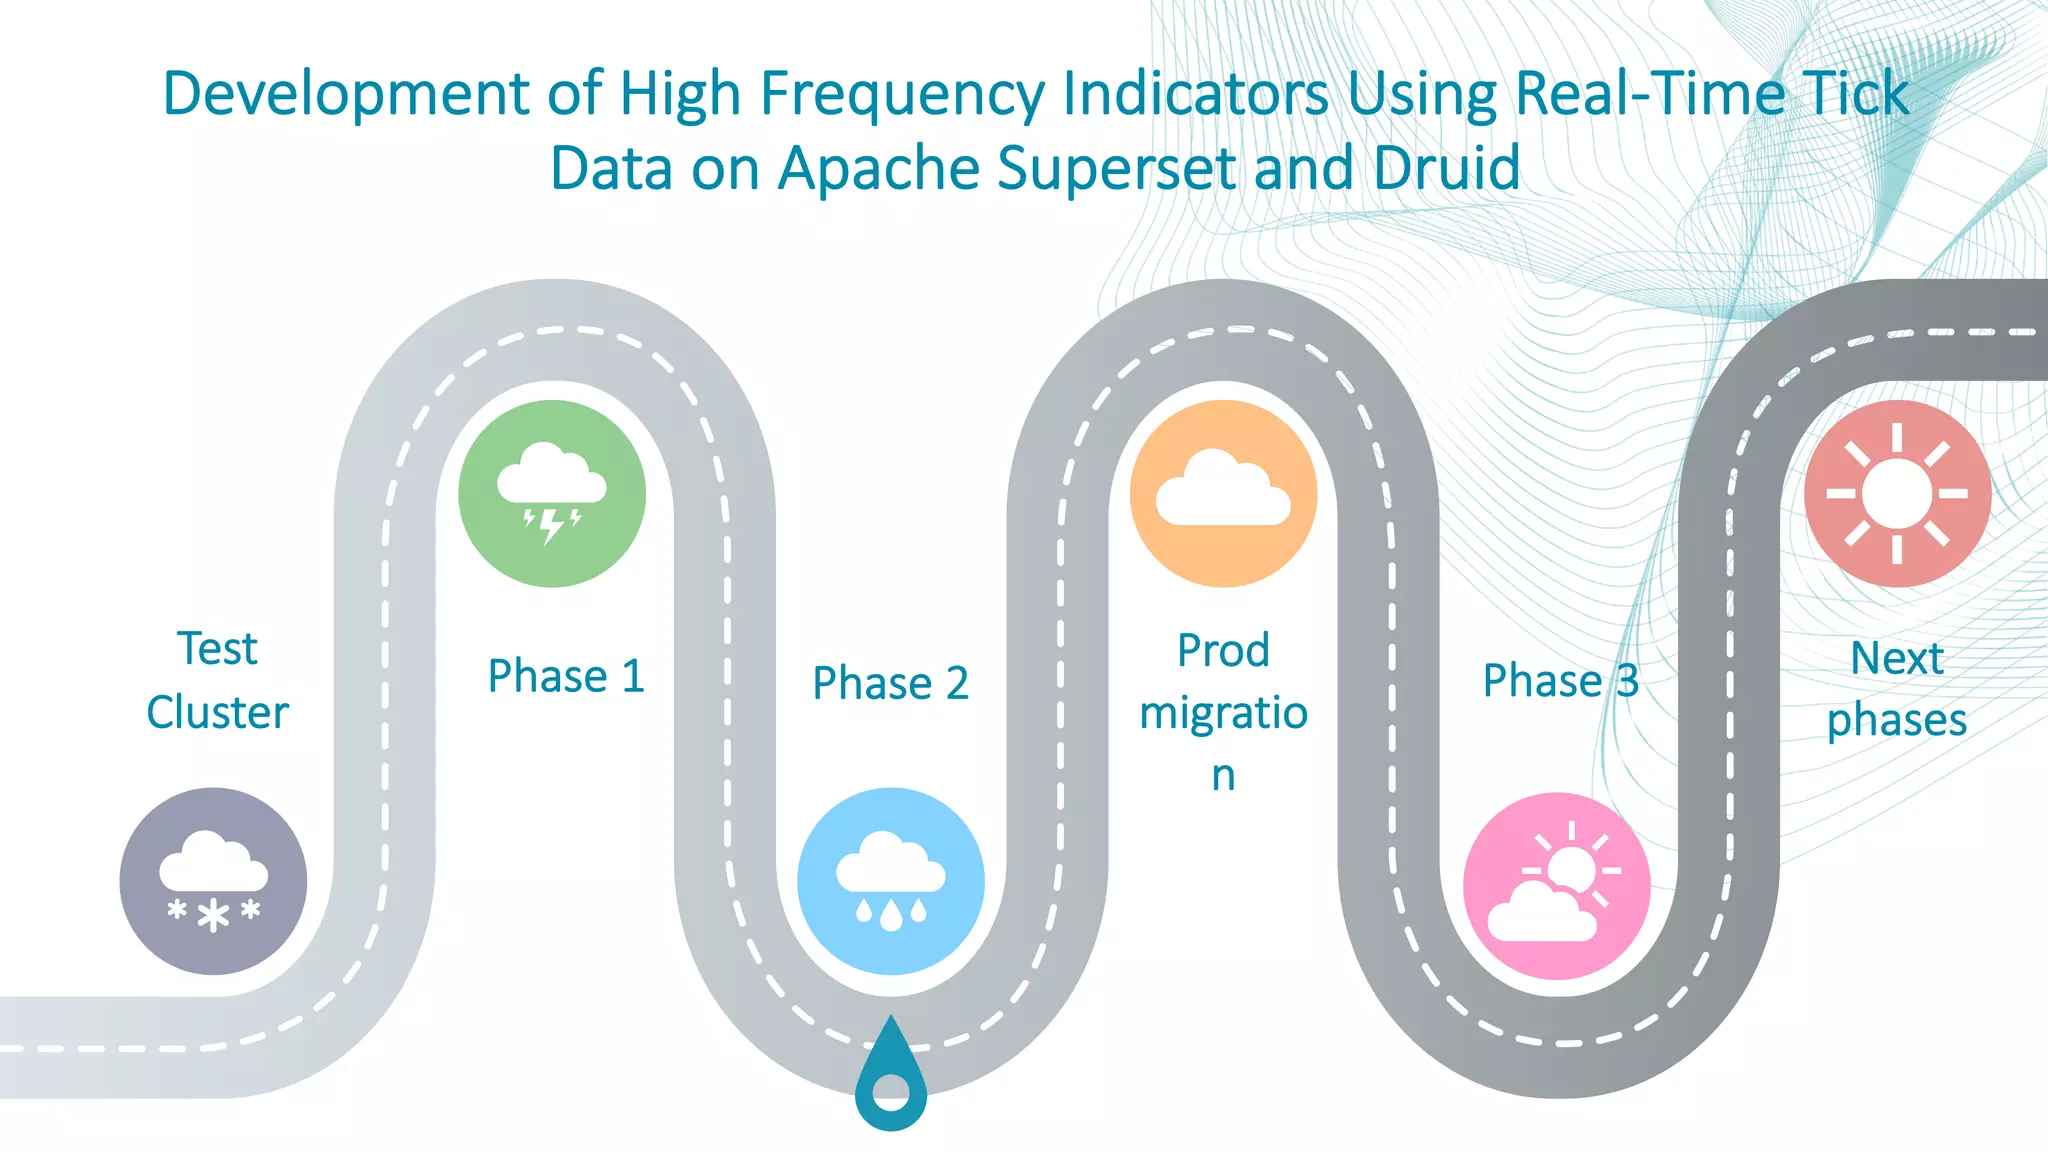
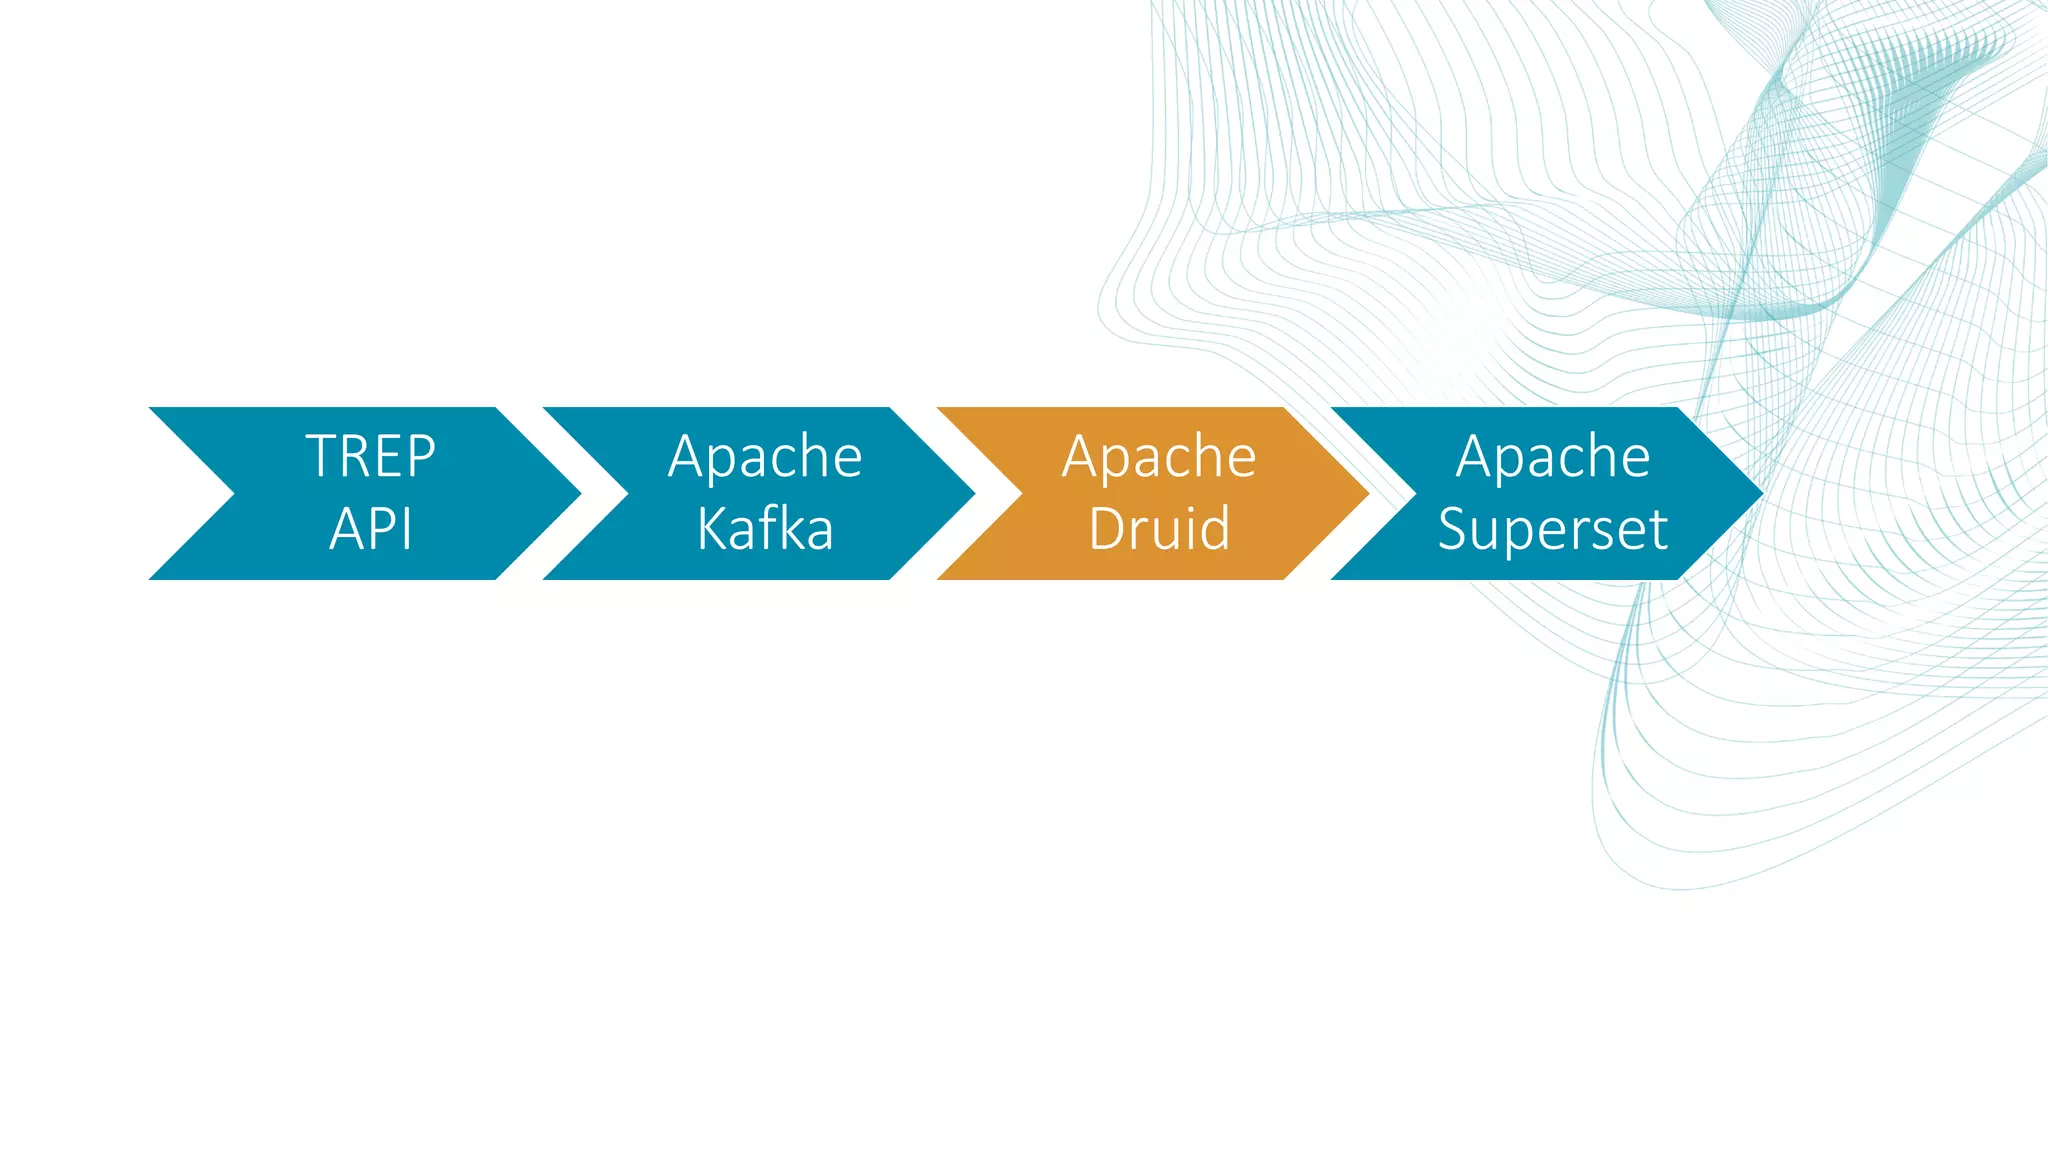
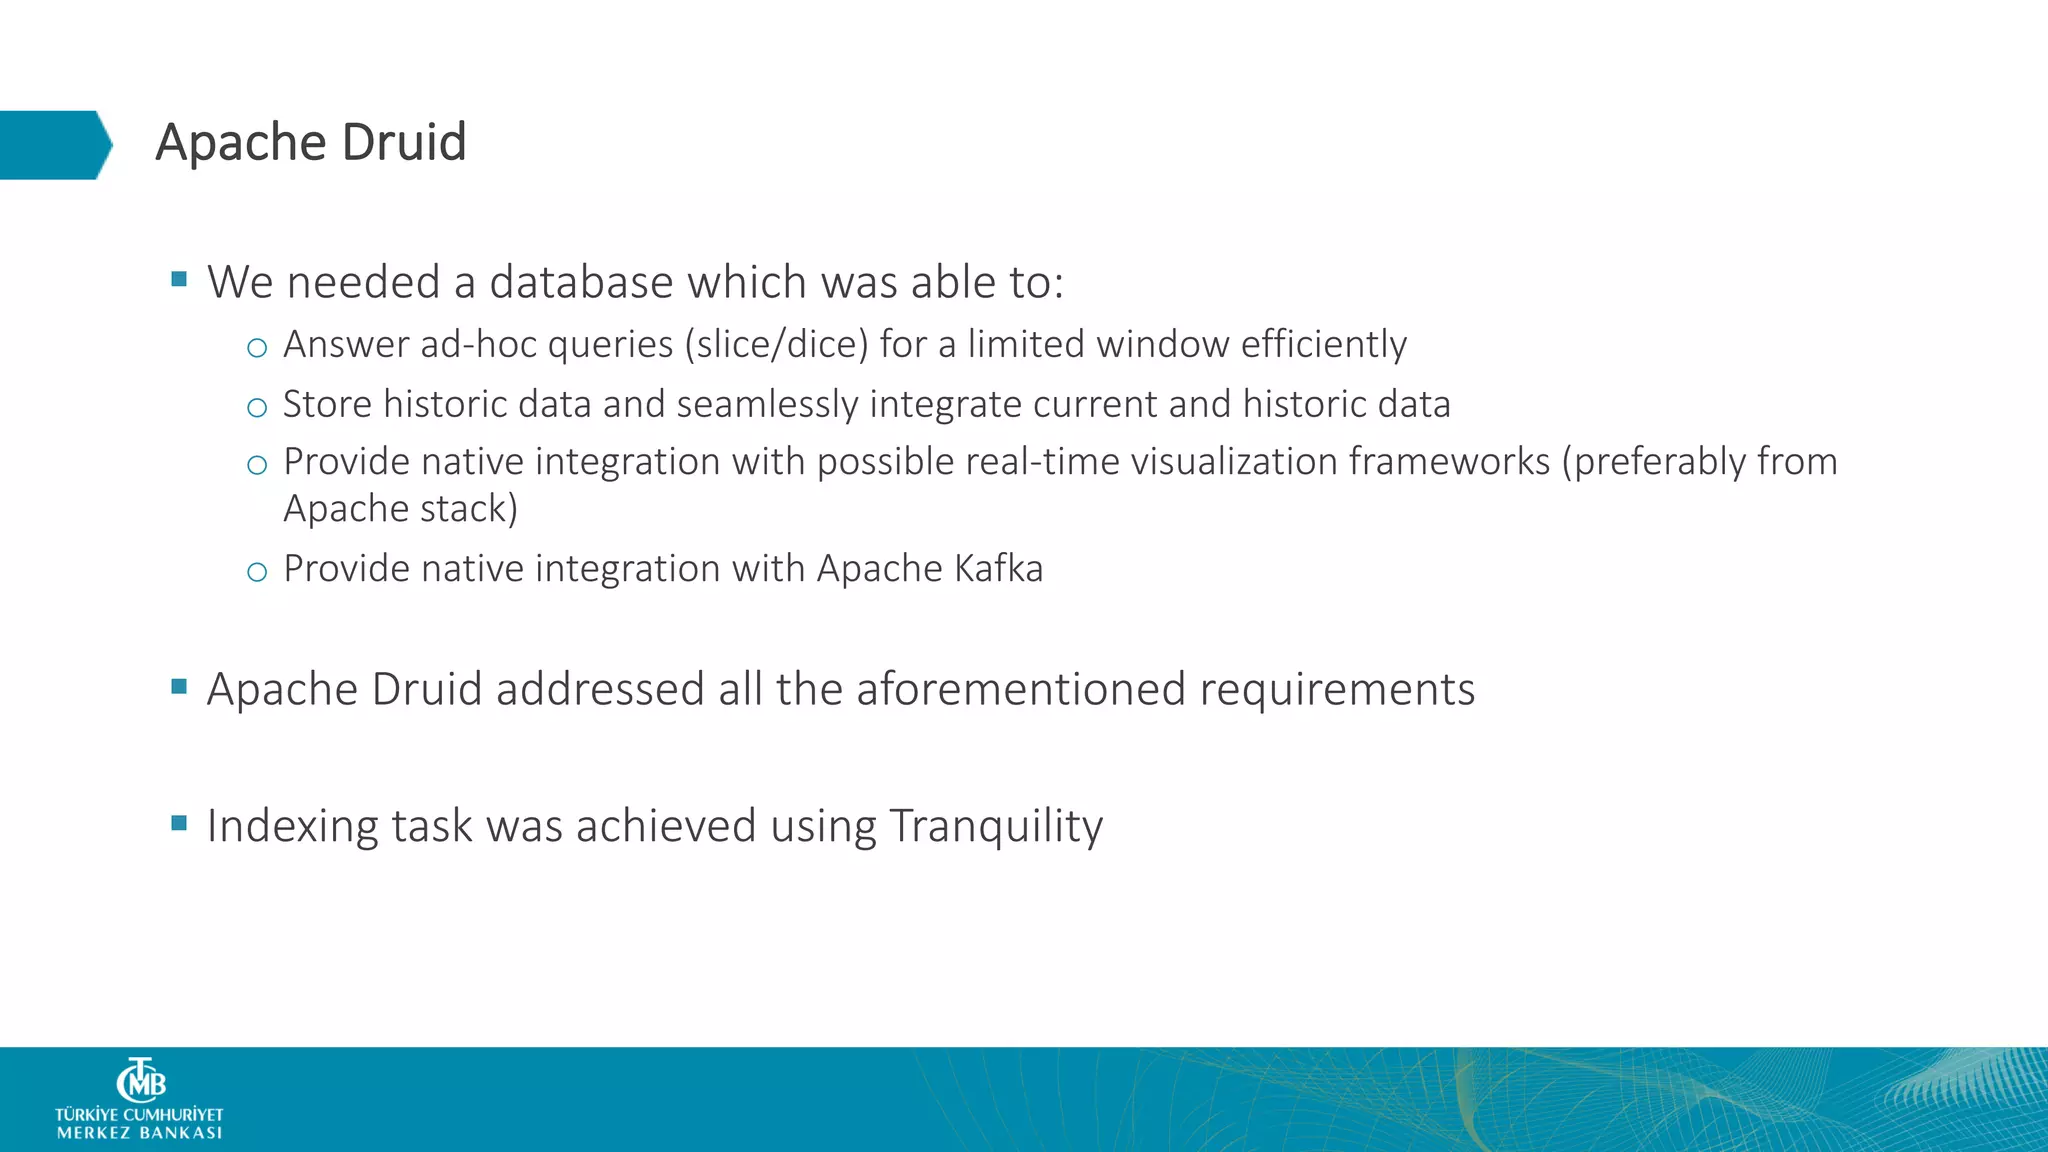
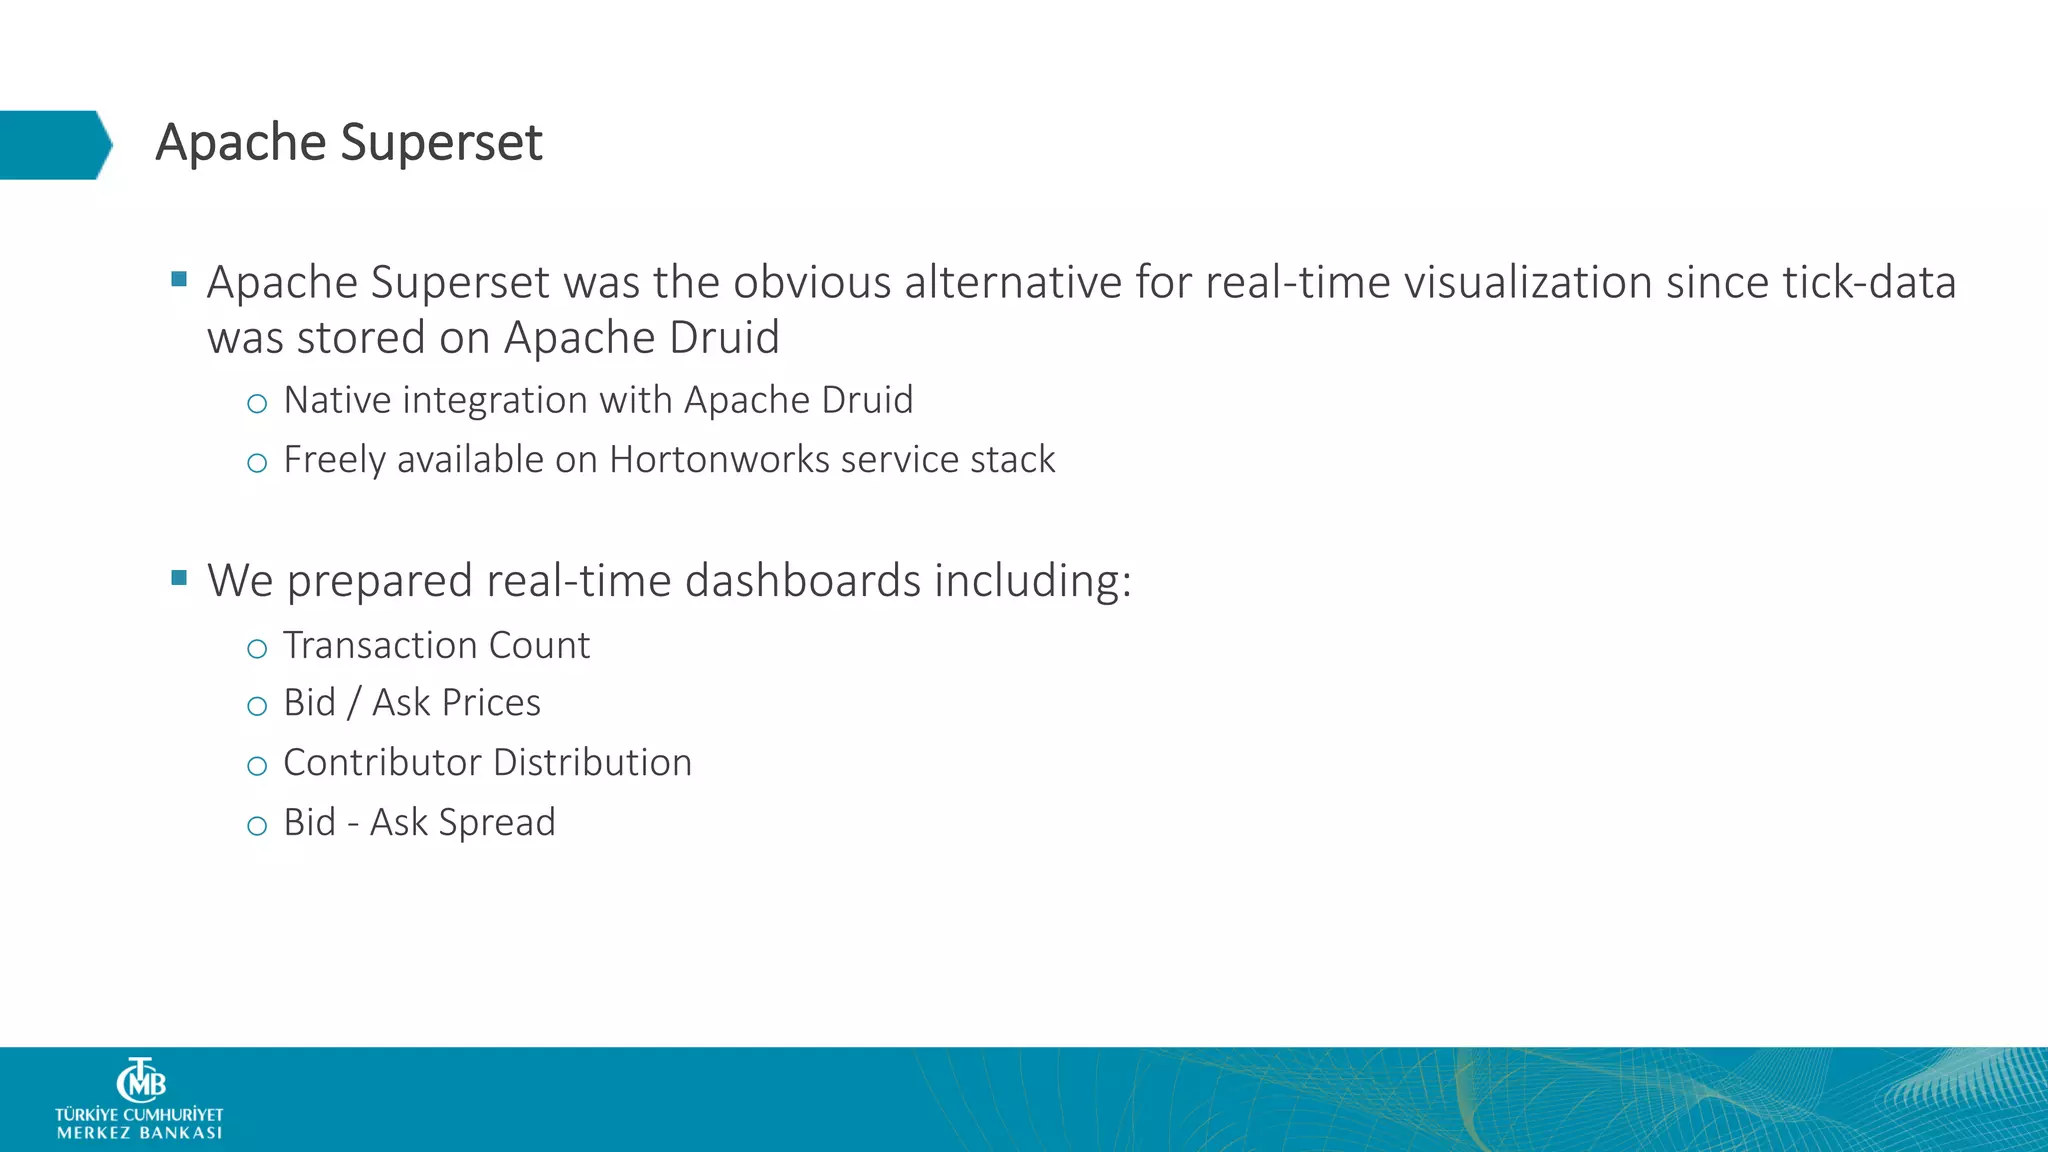
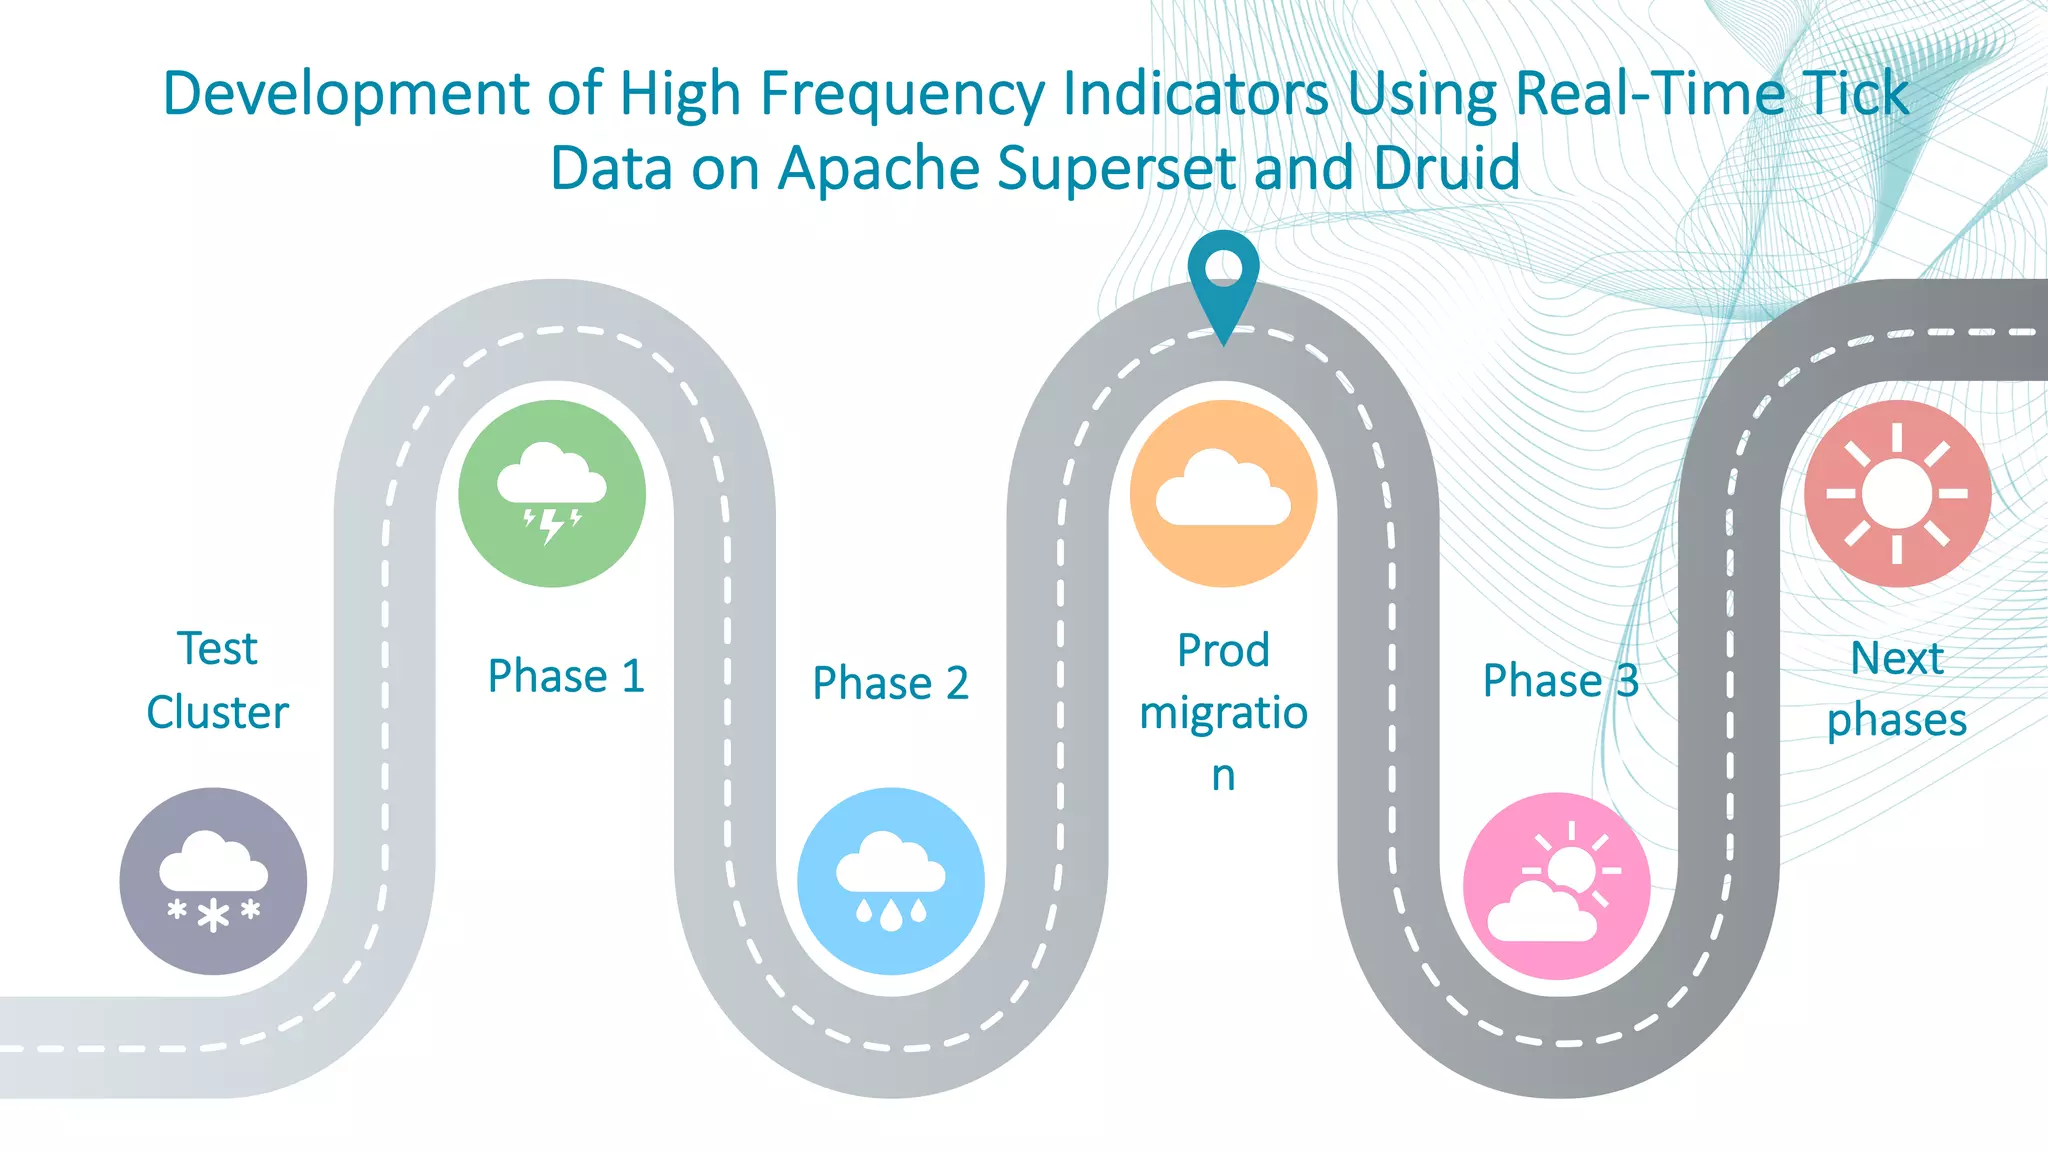
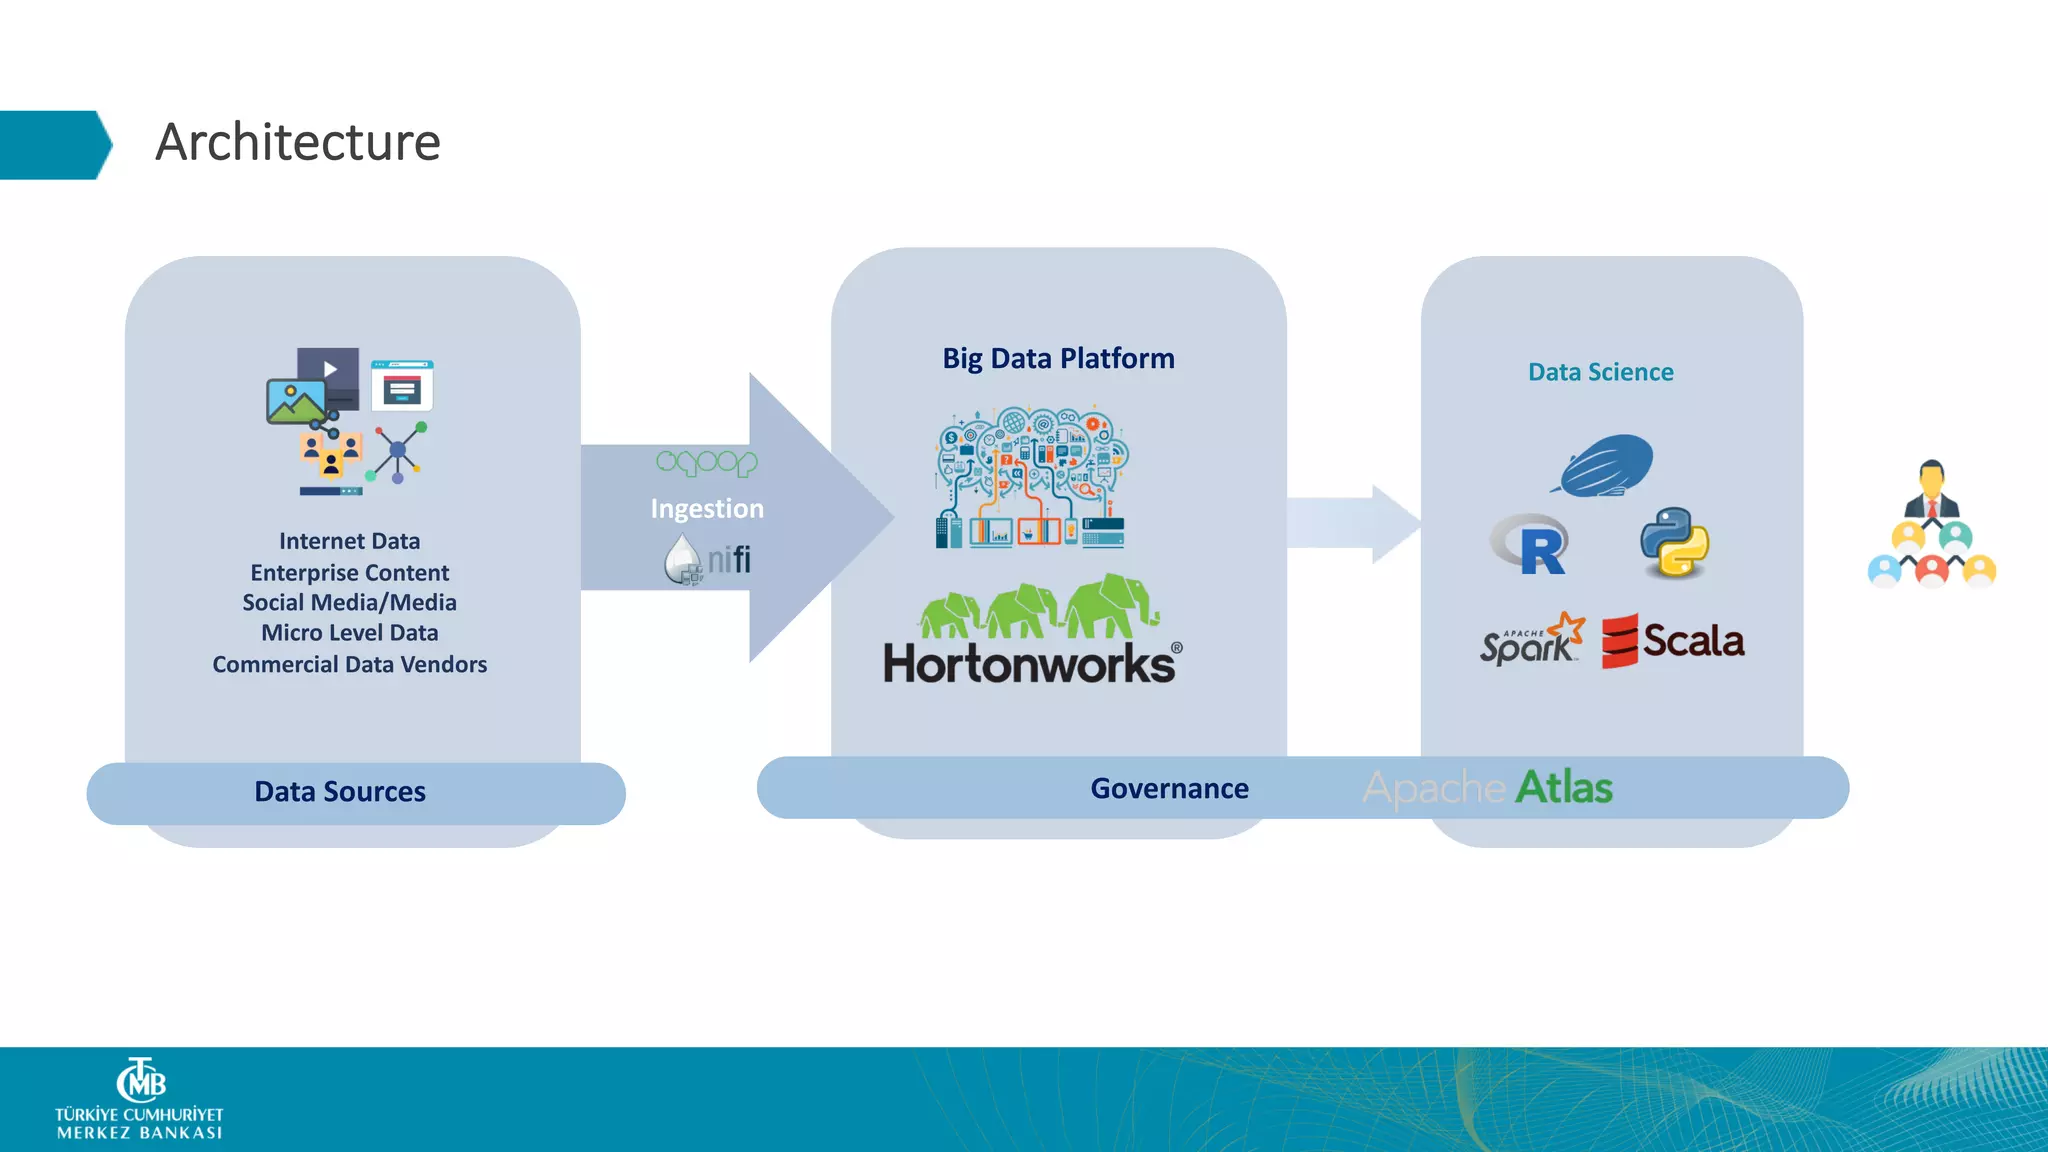
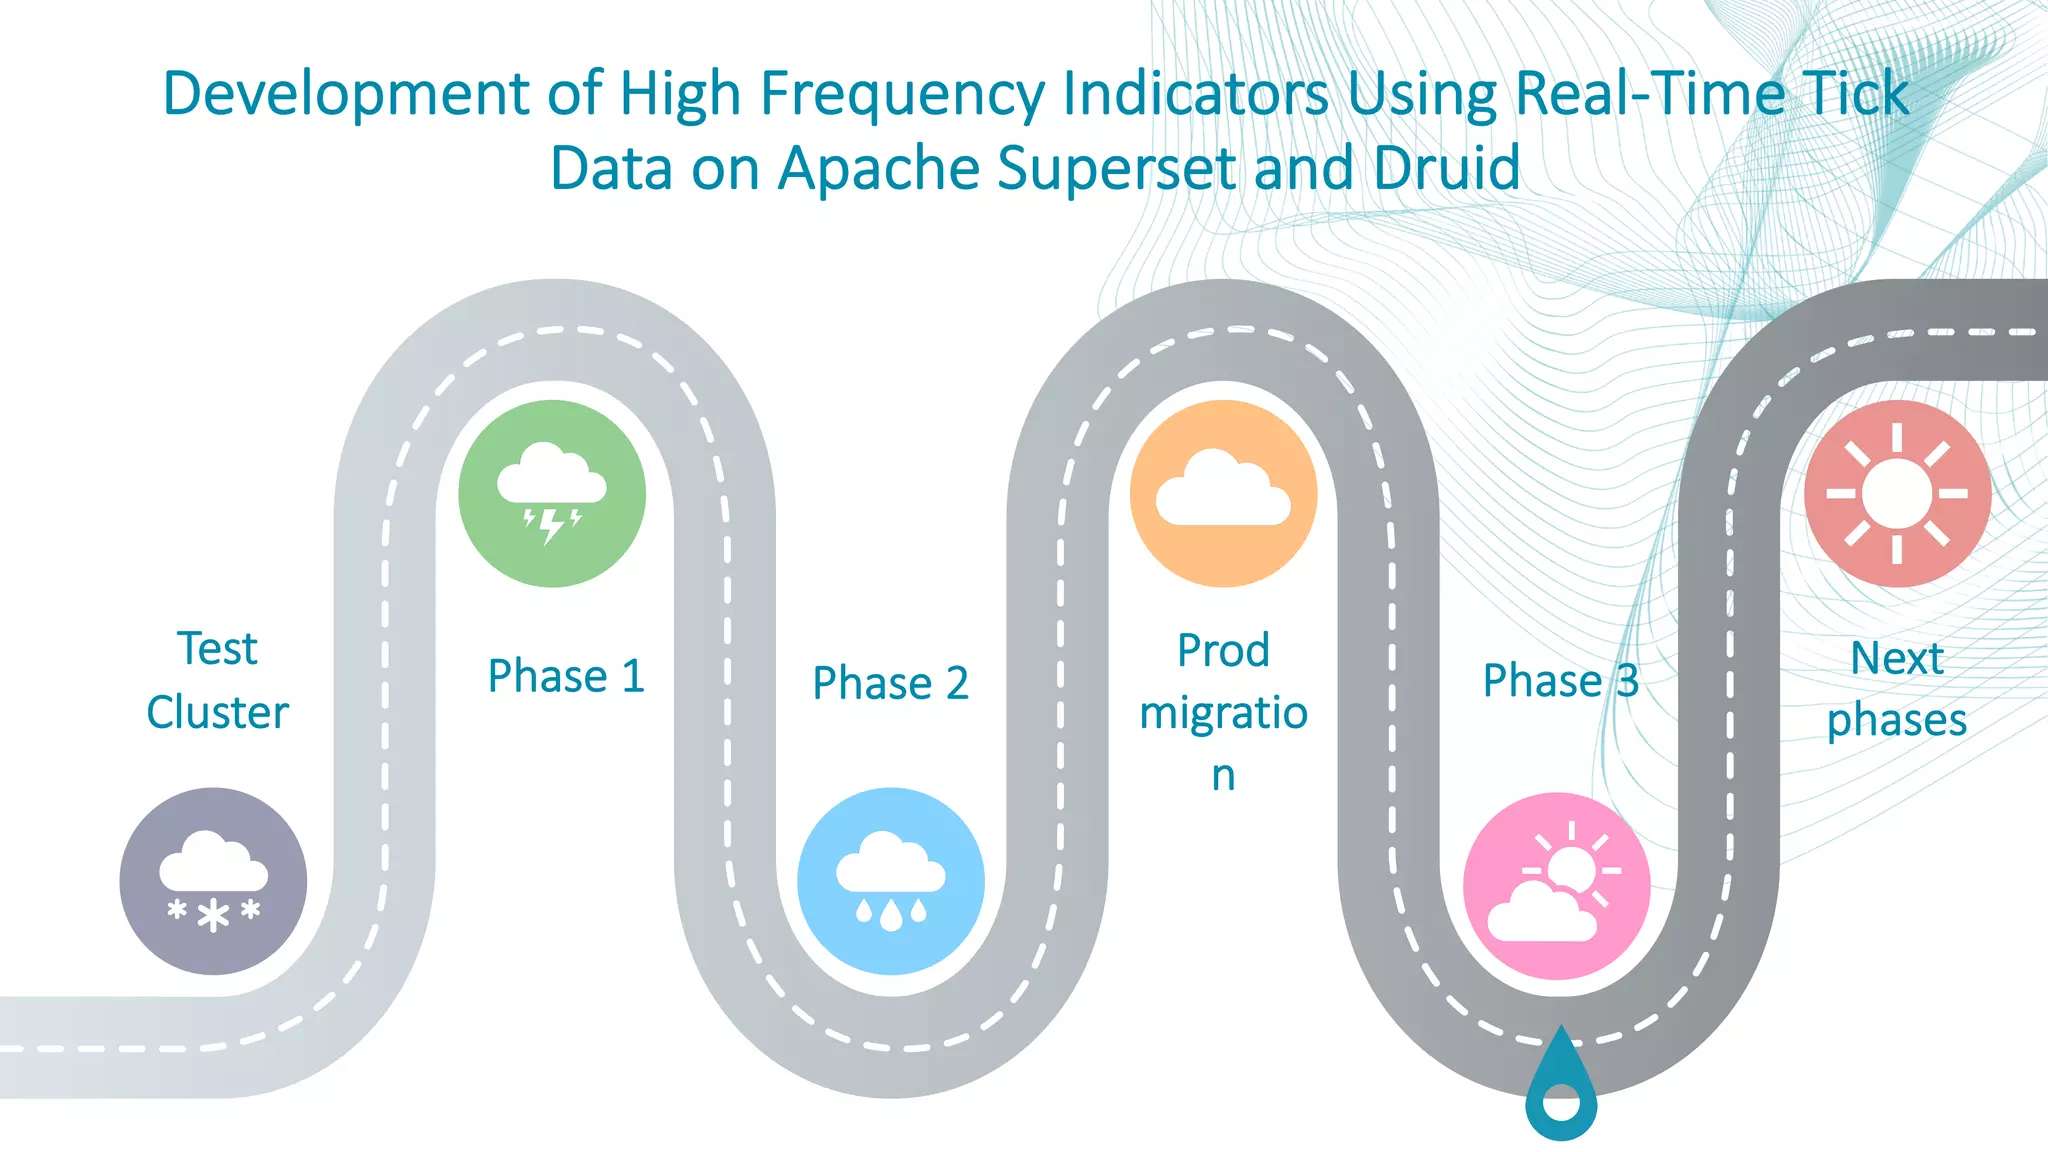
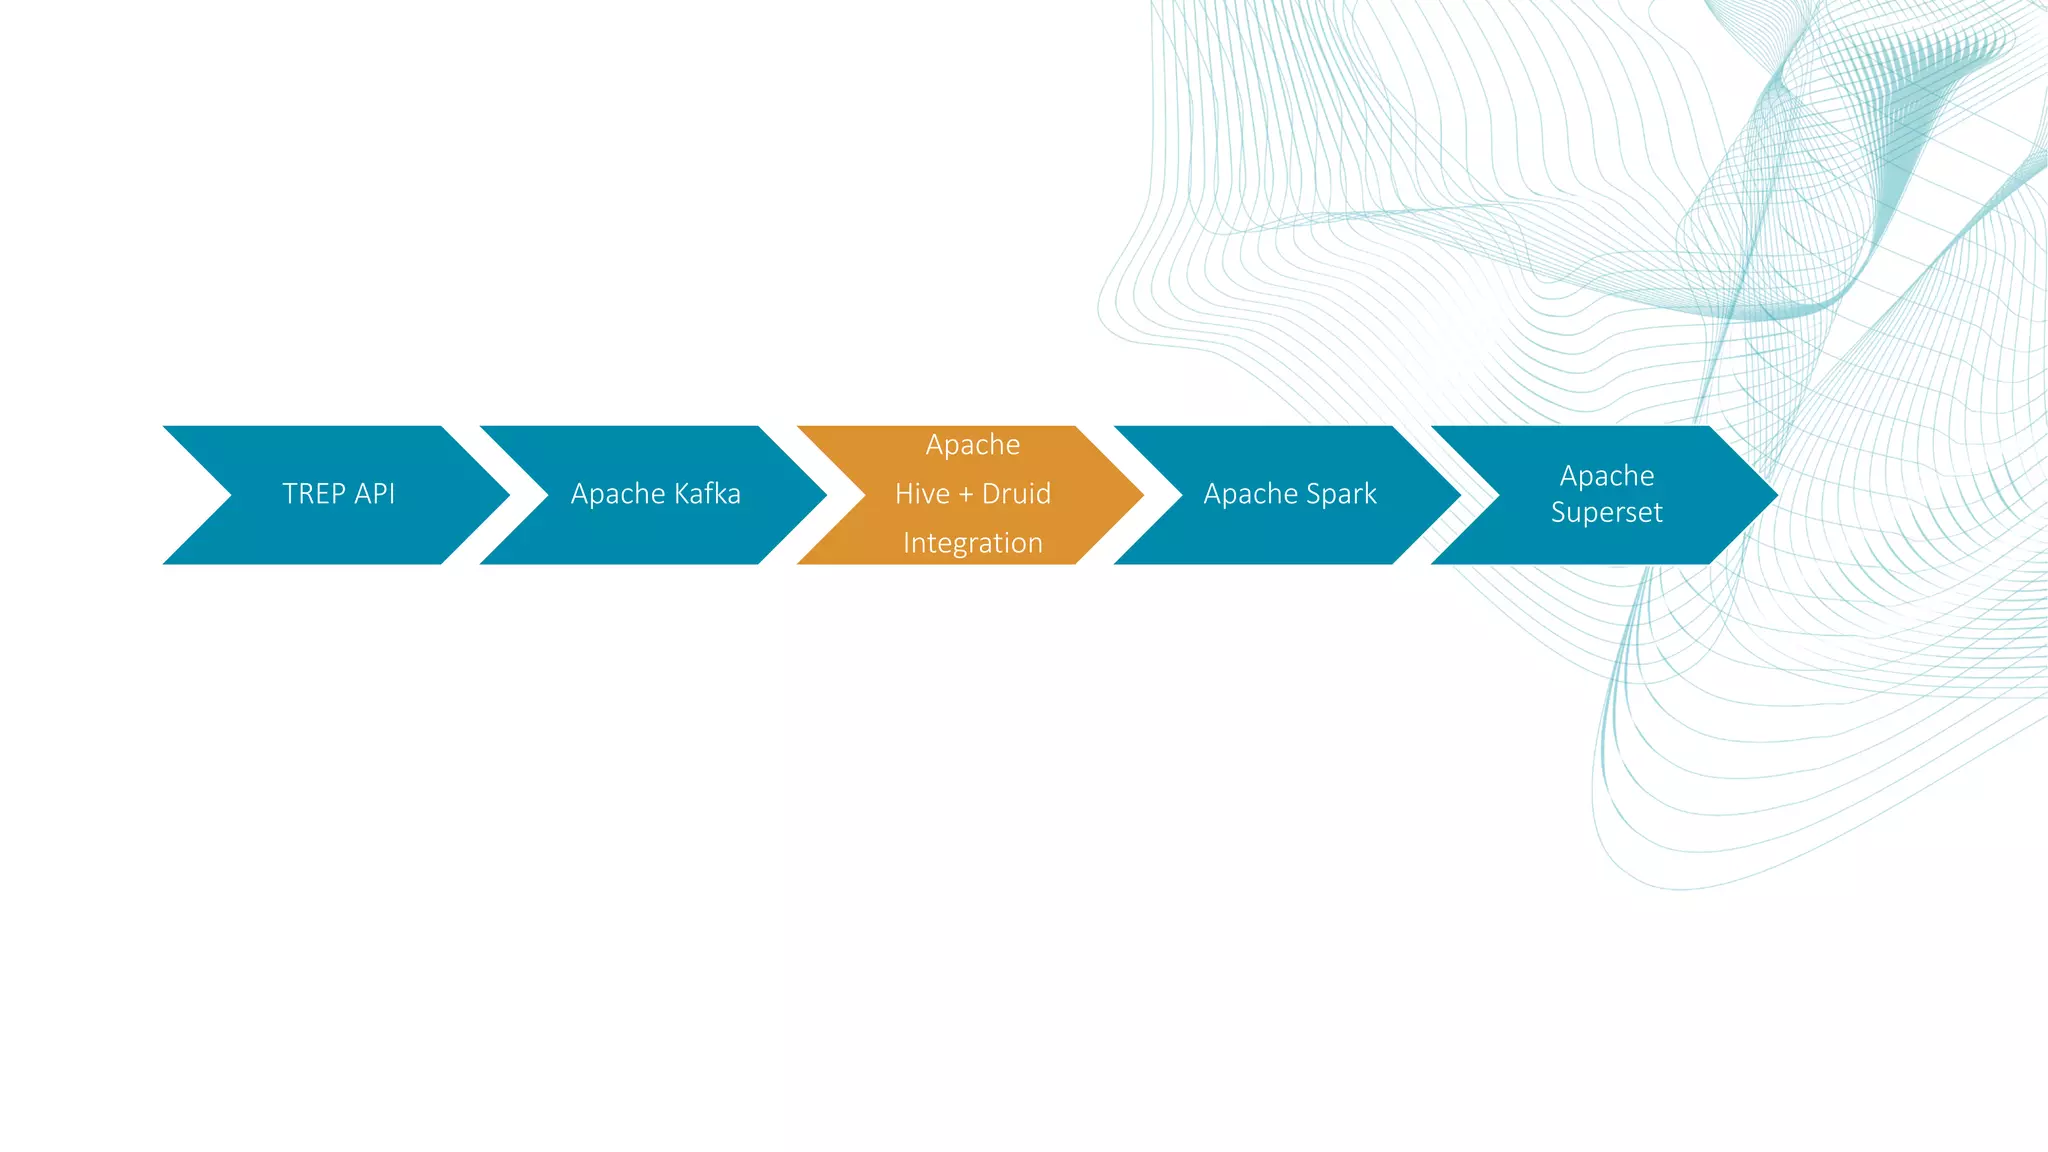
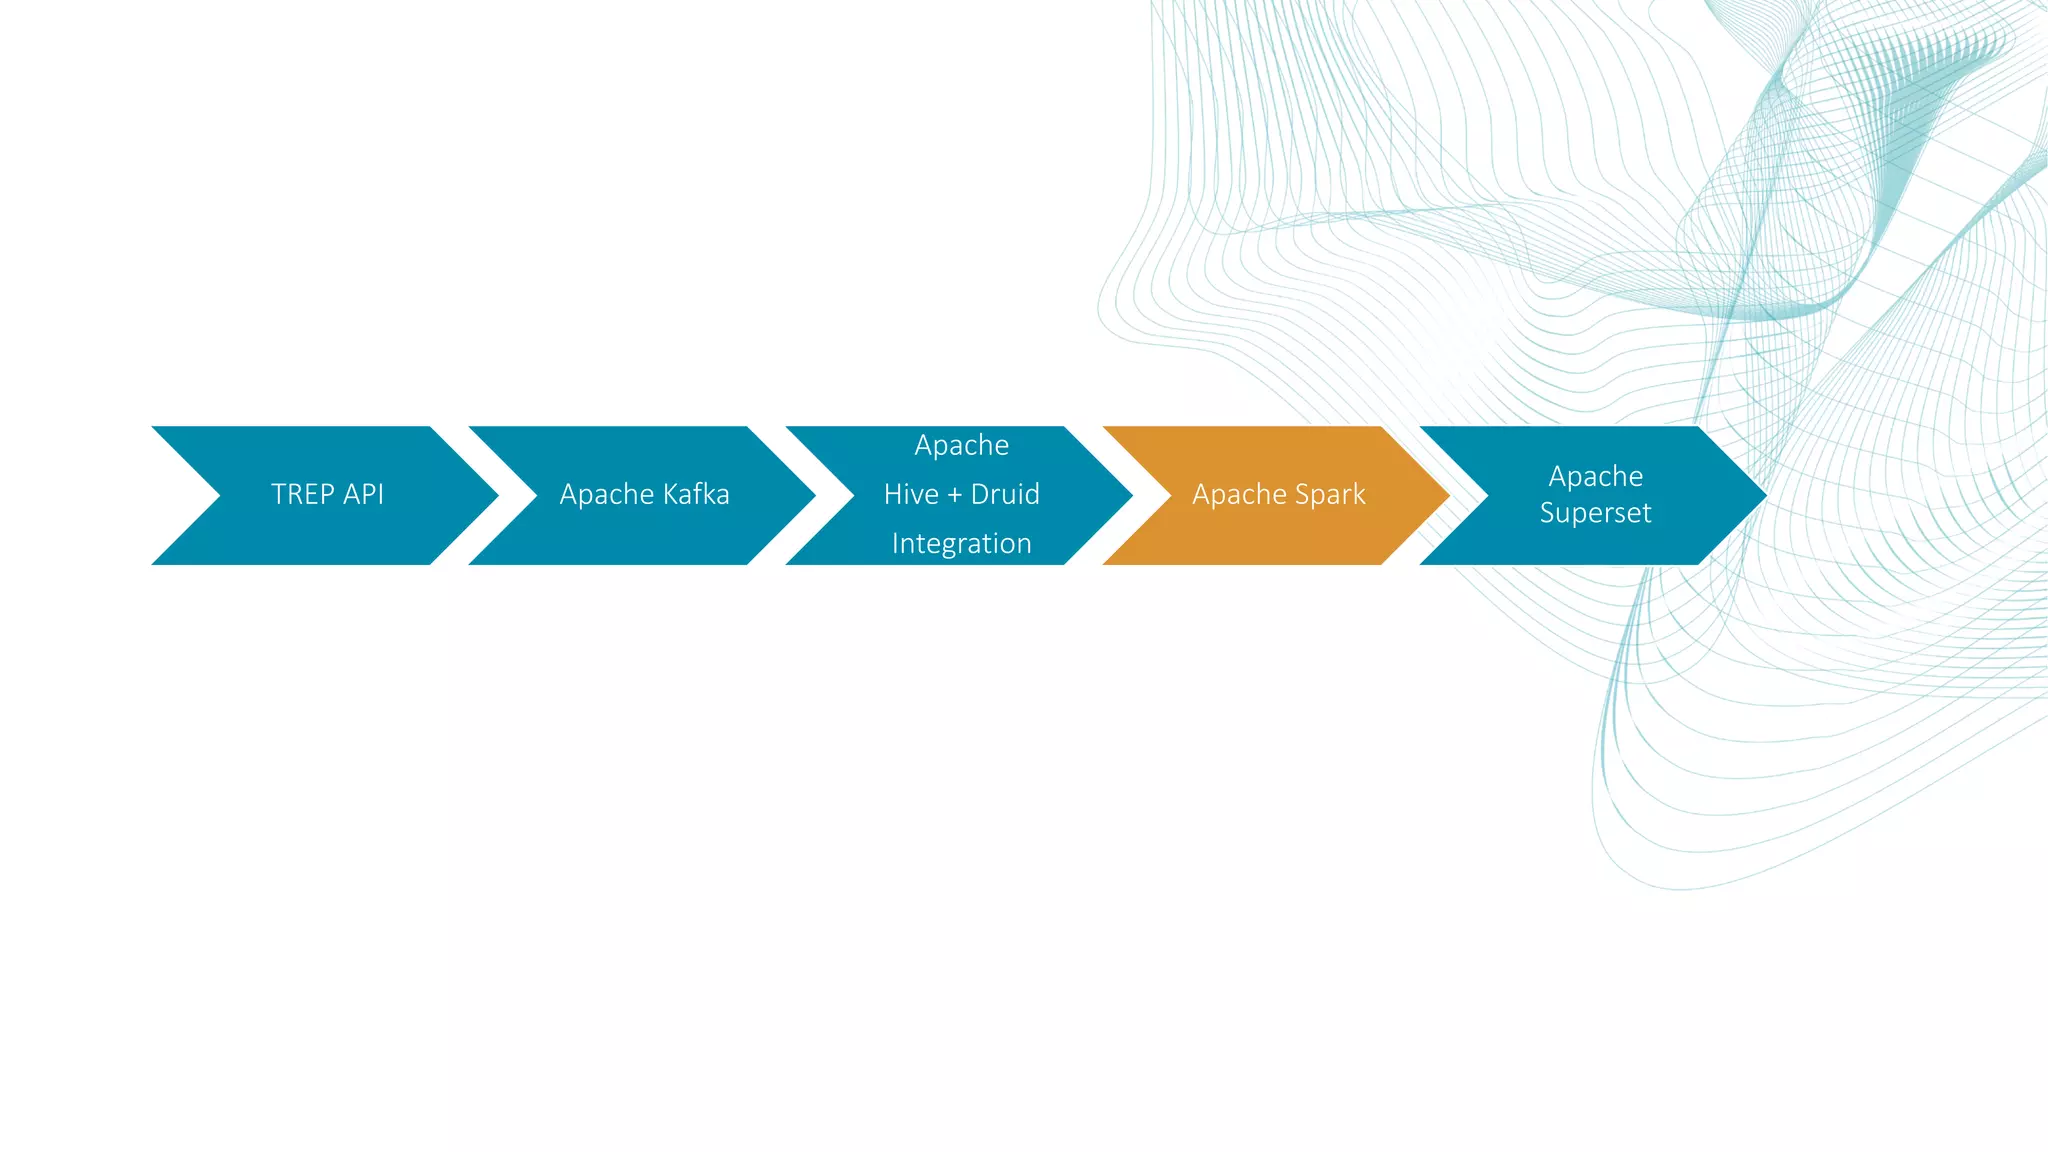
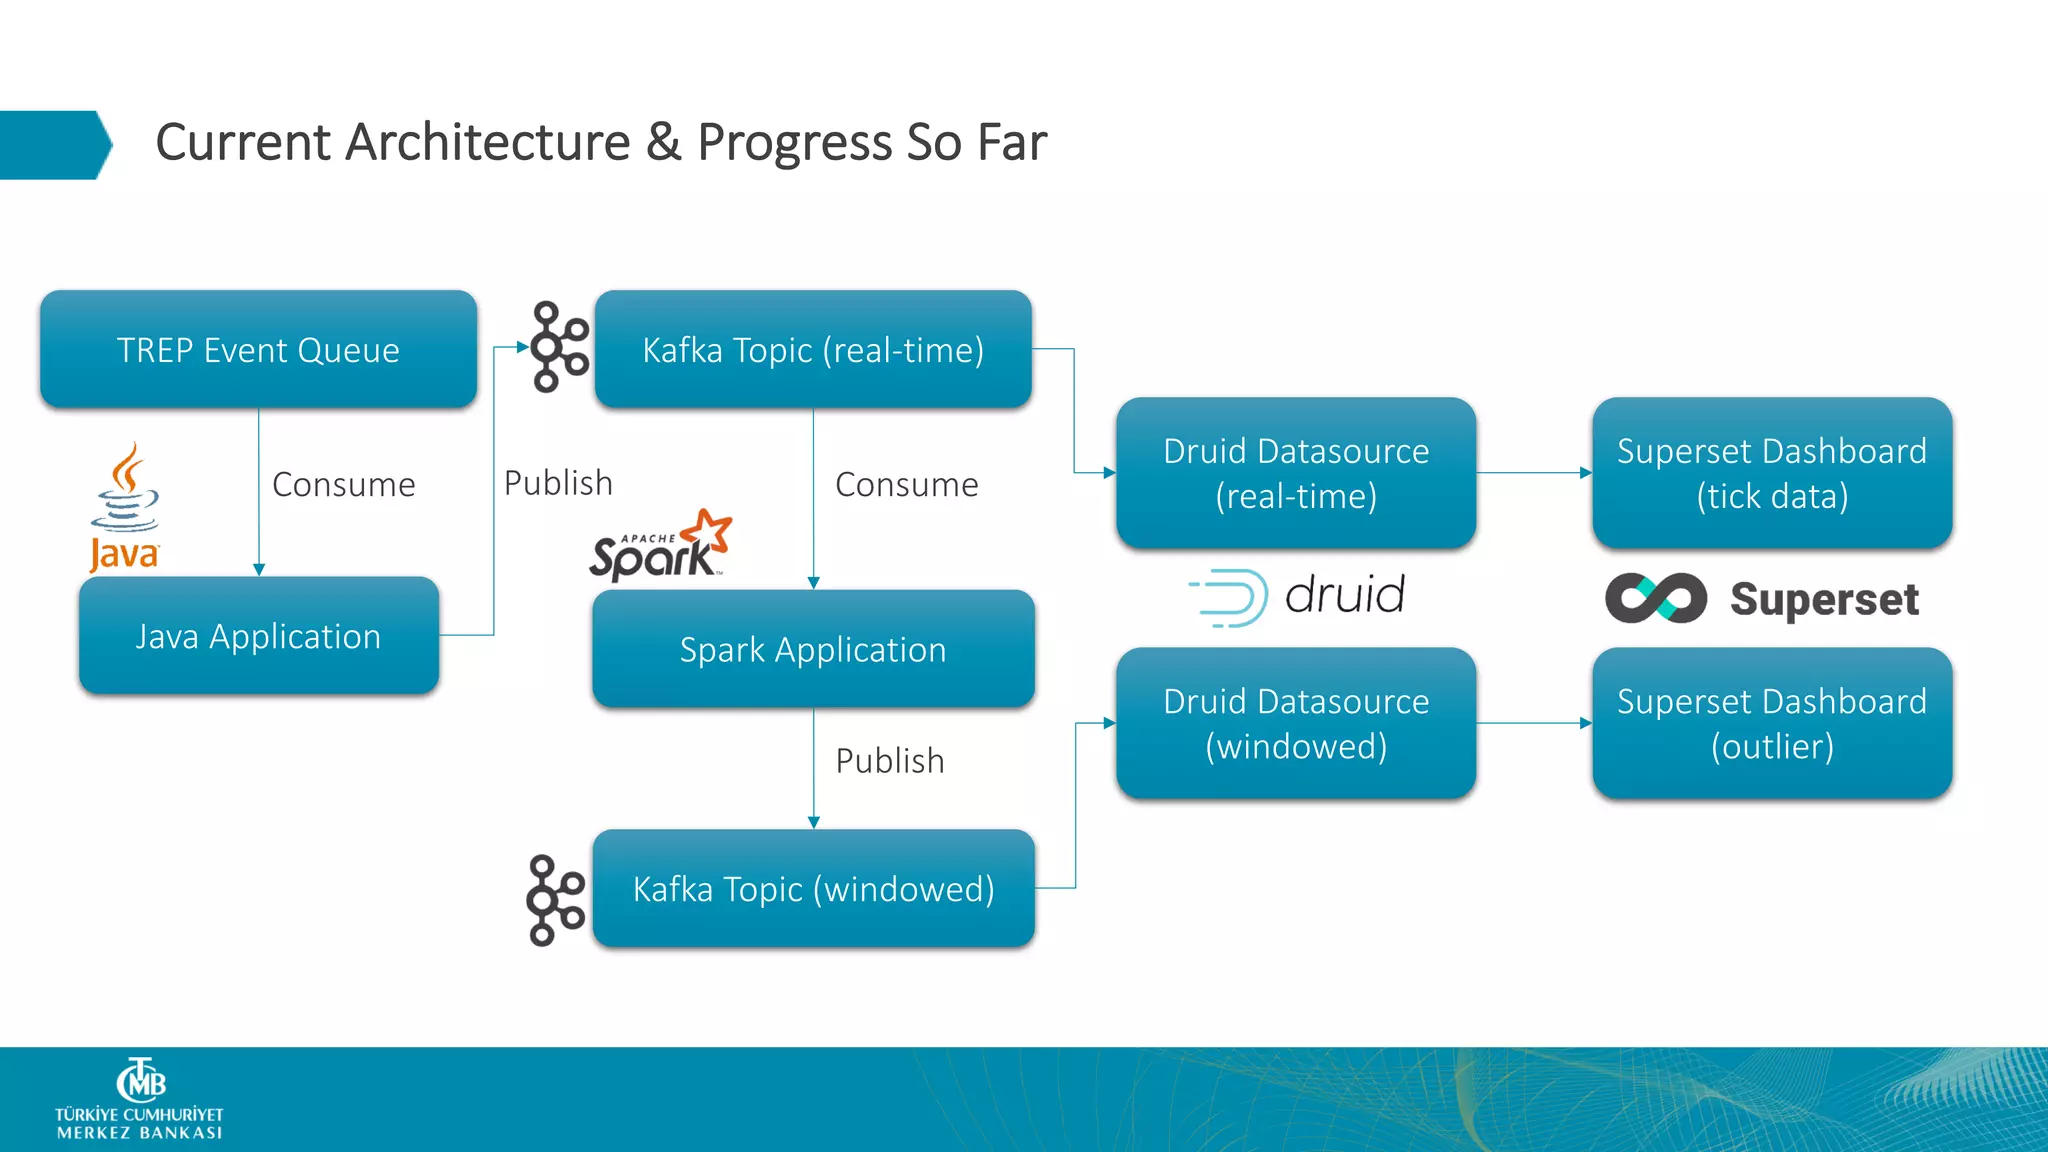
This document summarizes the Central Bank of Turkey's project to develop high frequency market indicators using real-time tick data from the Thomson Reuters Enterprise Platform. It describes how they set up Apache Kafka, Druid, Spark and Superset on Hadoop to ingest, store, analyze and visualize the data. Their goal was to observe foreign exchange markets in real-time to detect risks and patterns. The architecture evolved over three phases from an initial test cluster to integrating Druid and Hive for improved querying and scaling to production. Work is ongoing to implement additional indicators and integrate historical data for enhanced analysis.