This document presents a new methodology for detecting type-B artifacts in Visual Evoked Potentials (VEPS) using a median deviation algorithm. The study discusses the challenges posed by non-responsive channels and trials, and introduces tests such as standard deviation, clipping, and kurtosis to enhance the accuracy of evoked potential data. The findings indicate significant improvements in identifying and removing artifacts, thereby increasing the reliability of clinical evaluations based on VEPS.
![IOSR Journal of Electronics and Communication Engineering (IOSR-JECE) e-ISSN: 2278-2834,p- ISSN: 2278-8735.Volume 12, Issue 2, Ver. I (Mar.-Apr. 2017), PP 42-51 www.iosrjournals.org DOI: 10.9790/2834-1202014251 www.iosrjournals.org 42 | Page Detection of Type-B Artifacts in VEPs using Median Deviation Algorithm V. Adinarayana Reddy1 , P. Chandra Sekhar Reddy 2 1 KSRMCE, Cuddapah. JNTUH, Hyderabad2 Abstract: The primary goal of this research work is to introduce temporal artifact detection strategy to detect non responsive channels and trials in visual evoked potentials(VEPs) by tracing out the signals with very low energy and to remove artifacts in multichannel visual evoked potentials. The non responsive channels and trials are identified by calculating the energy of the average evoked potential of each channel, and the energy of the average evoked potential of each trial. Then channel wise and trial wise median test is conducted to detect and remove non-responsive channels and trials. An artifact is defined as any signal that may lead to inaccurate classifier parameter estimation. Temporal domain artifact detection tests include: a clipping (CL) test detect amplitude clipped EPs in each channel, a standard deviation (STD) test that can detect signals with little or abnormal variations in each channel, a kurtosis (KU) test to detect unusual signals that are not identified by STD and CL tests and median deviation test to detect signals containing large number of samples with very small deviation from their normal values. An attempt has been made to apply these techniques to 14-channel visual evoked potentials (VEPs) obtained from different subjects. Keywords: evoked potentials, energy, median, standard deviation, clip, kurtosis, median deviation. I. Introduction Evoked potentials (EPs) are event related potentials (ERPs) superimposed in electro-encephalogram (EEG). Evoked potentials are usually considered as the time locked and synchronized activity of a group of neurons that add to the background EEG. Evoked Potentials indicate how well the brain is processing stimuli from the sense organs (eg. eyes, ears or skin) and can help diagnose illnesses. An evoked potential (EP) is a signal that is generated as a result of the transmission of information induced by the application of a sensory stimulus to a sensory pathway. Examples of such stimuli are electric stimuli, visual stimuli, and auditory stimuli [26]. The application of a stimulus invokes a sequence of action potentials that is transmitted via a nervous pathway to the central nervous system (CNS). The activation of different parts in the nervous pathway leads to variations in the electromagnetic field that can be recorded on the scalp. Using surface electrodes a sequence of positive and negative peaks can be recorded; such a sequence is called a sensory evoked potential. These peaks are characterized by their amplitude and time after the stimulus, at which they occur the (post stimulus) latency. Evoked potentials are simultaneously recorded on the scalp with the spontaneous EEG. The EEG signal has much larger amplitude than the evoked potential. Averaging techniques are used to extract the signal related to the stimulus and reduce the amplitude of the ongoing EEG signal. Fig.1. The M-channel single trial EPs in response to stimulus c. Evoked potentials are used extensively in the study of human brain functions and in clinical investigations to study normal and abnormal brain functions. They are used to test conduction in the visual,](https://image.slidesharecdn.com/i1202014251-170704051532/75/Detection-of-Type-B-Artifacts-in-VEPs-using-Median-Deviation-Algorithm-1-2048.jpg)
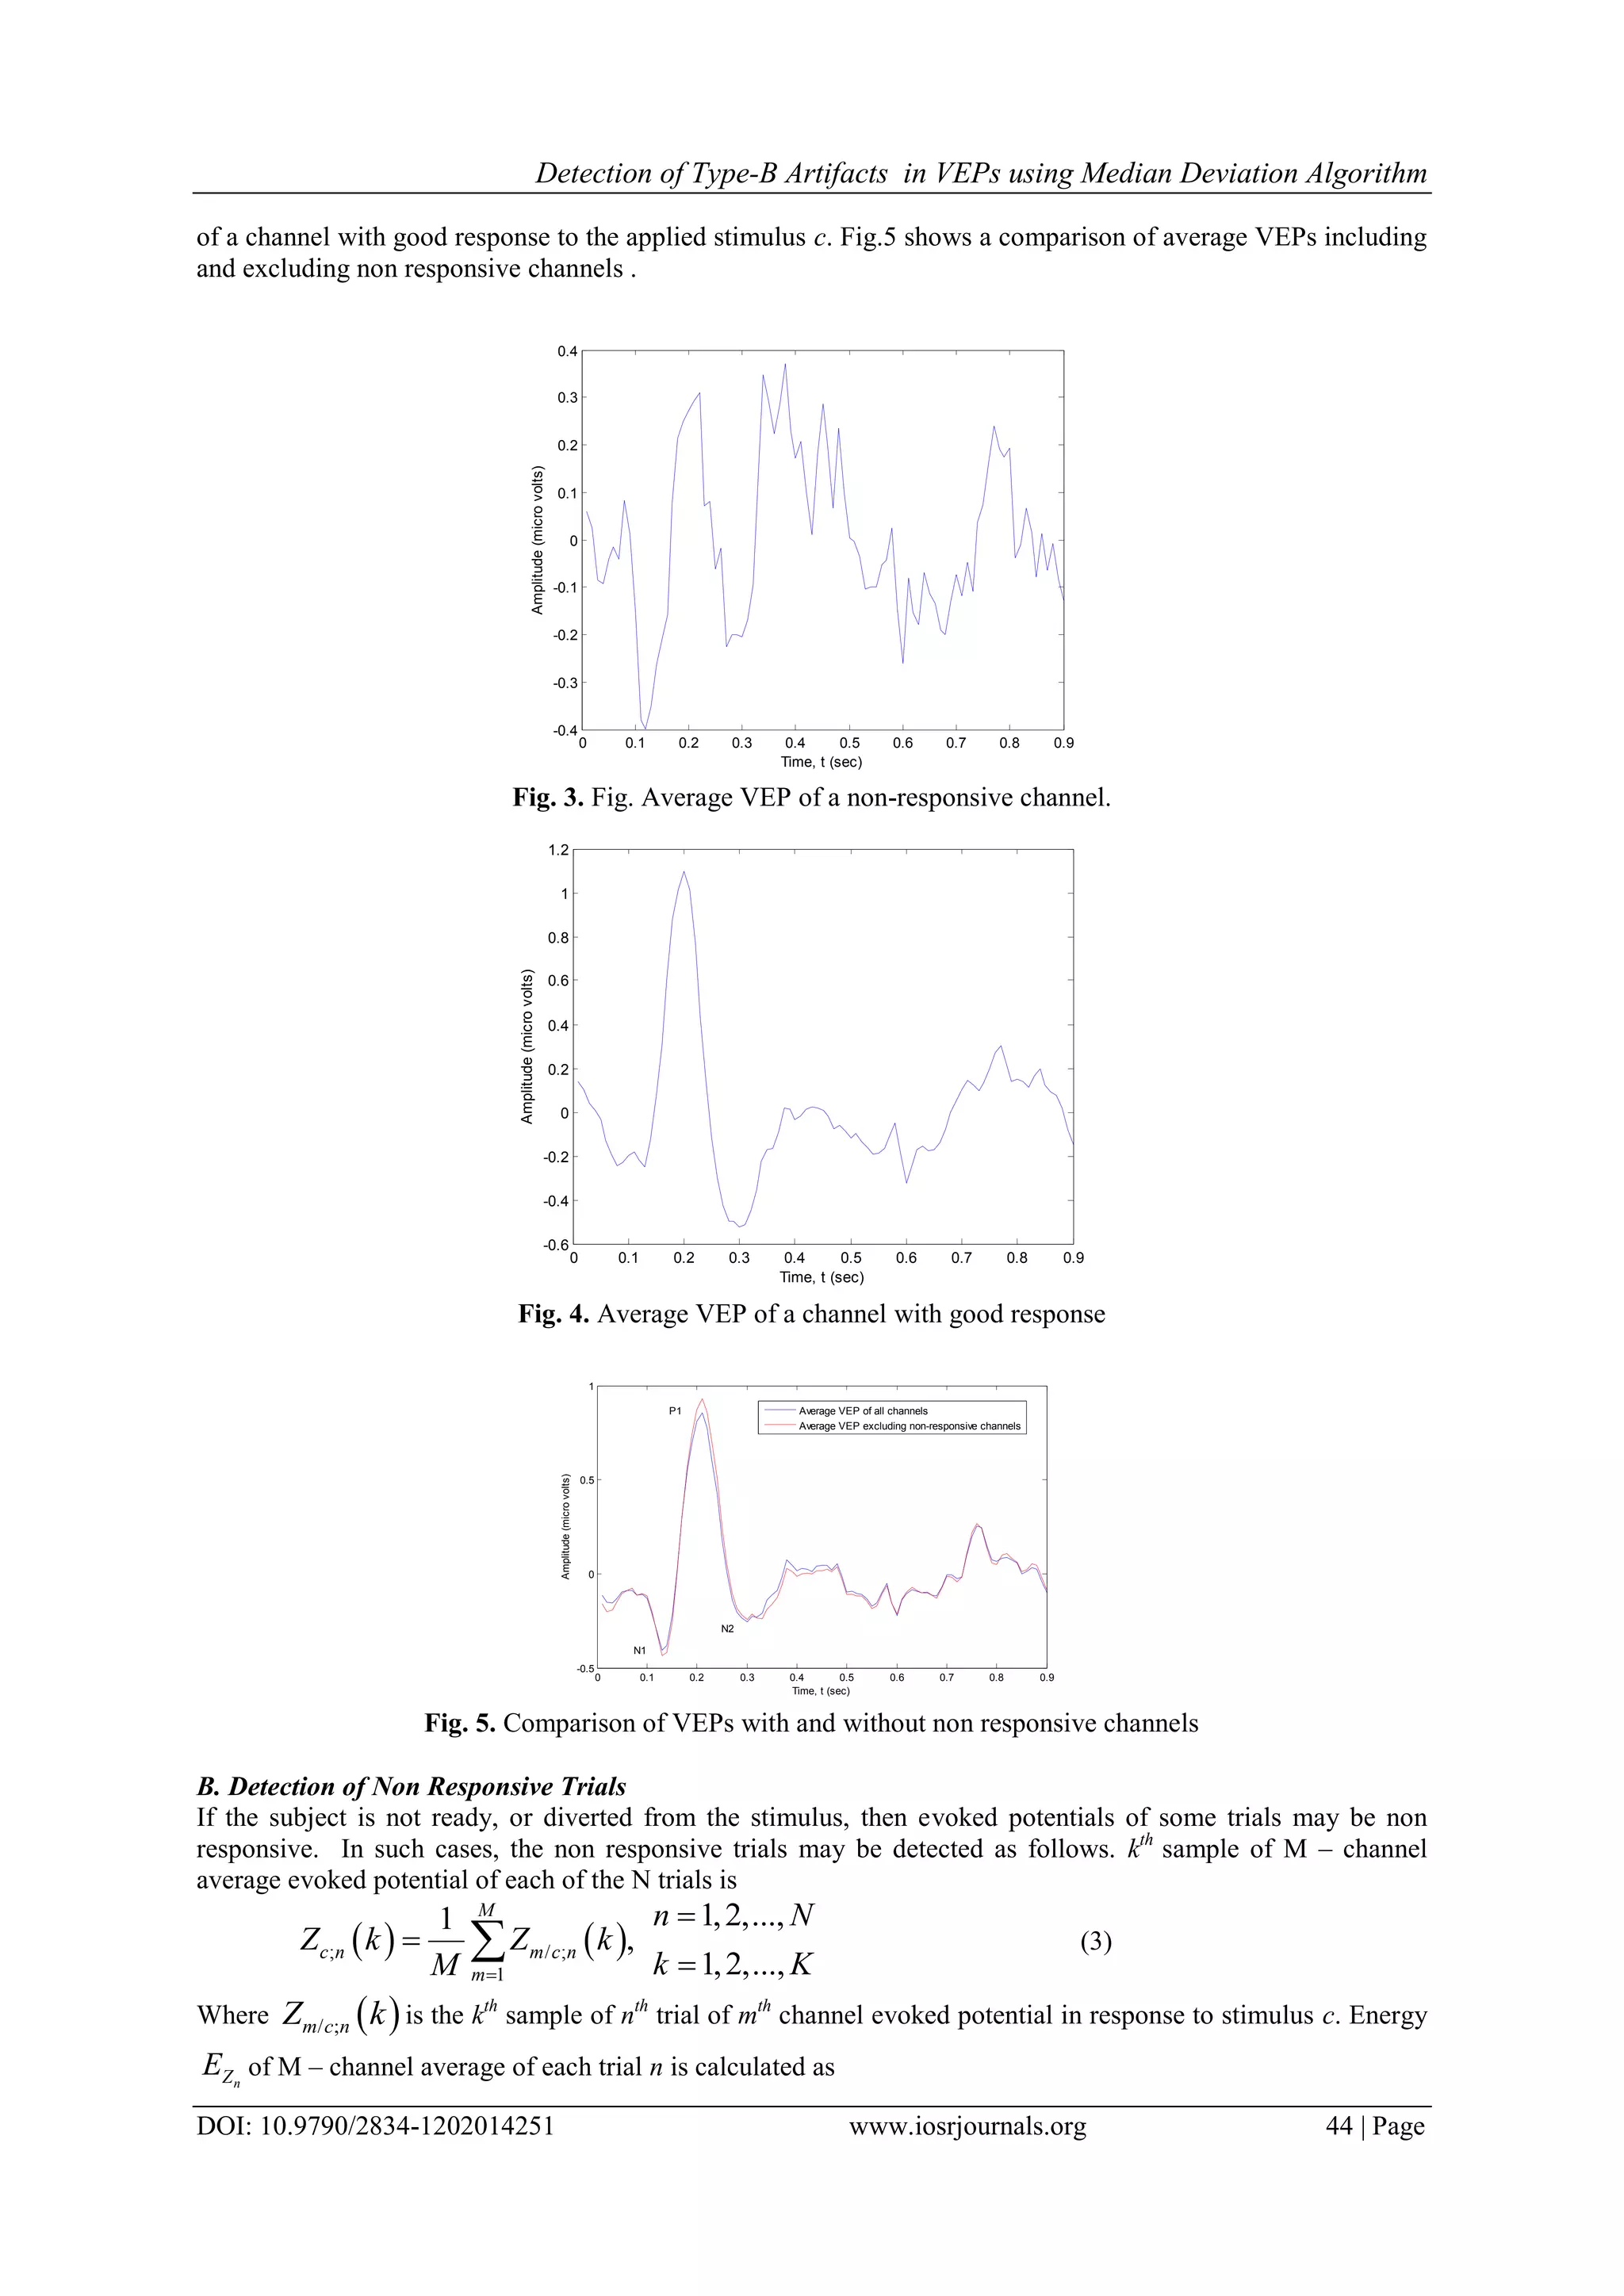
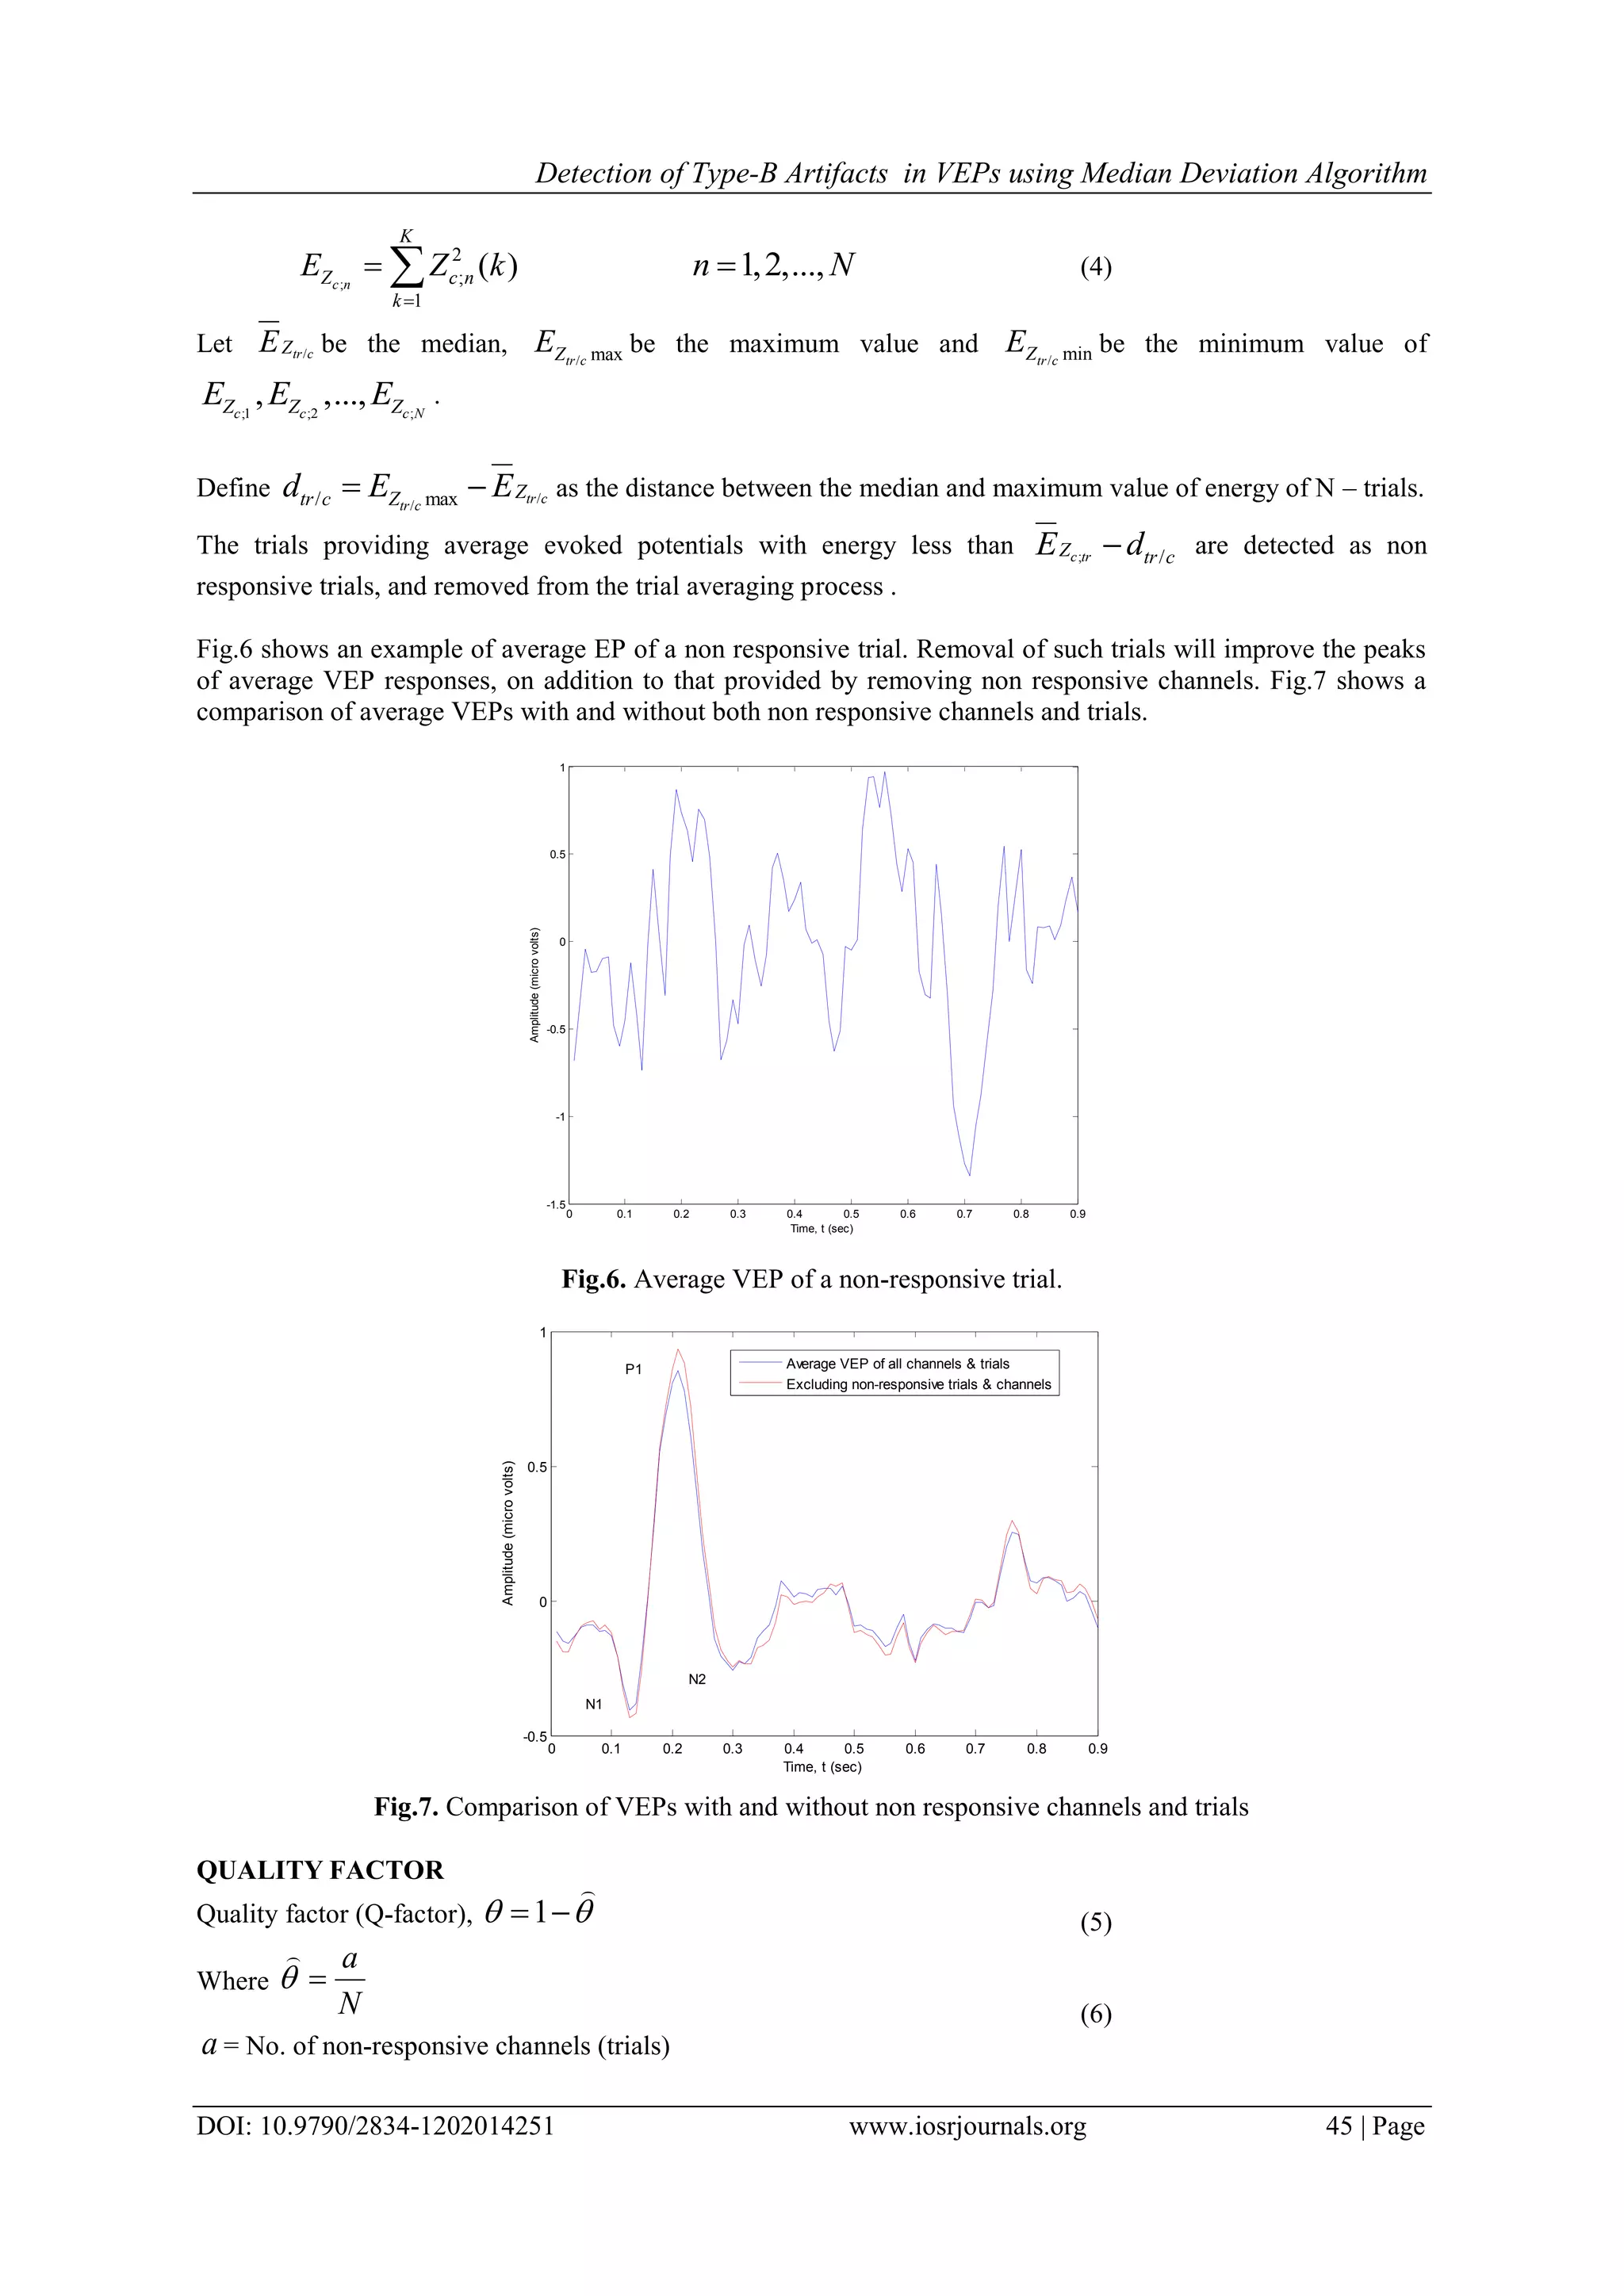
![Detection of Type-B Artifacts in VEPs using Median Deviation Algorithm DOI: 10.9790/2834-1202014251 www.iosrjournals.org 43 | Page auditory, and somatosensory systems. During surgery they can be used to monitor the condition of structures at the operative site. Fig.1. shows M single channel evoked potentials in response to stimulus c. Sensory evoked potentials can also be used for monitoring effects of anesthetics on the central nervous system (CNS). The choice of stimulus type to be used depends on the part of the nervous system to be investigated and the circumstances under which measurements are to be made. We define artifacts as patterns in the training set that lead to inaccurate estimation of classifier parameters and patterns in the test set that yield misleading performance evaluations. In real time classification, such artifacts can give inaccurate test results which can have serious consequences, such as inaccurate diagnosis in clinical evaluations [16]. Visual evoked potentials are very useful in detecting blindness in patients those cannot communicate, such as babies or animals. If repeated stimulation of the visual field causes no changes in EEG potentials then the subject's brain is probably not receiving any signals from his/her eyes. Other applications include the diagnosis of optic neuritis, which causes the signal to be delayed. Fig.2 (a) shows visual evoked potential recording setup where pattern reversal method is used as stimulus, and Fig.2 (b) shows a typical visual evoked potential. Artifacts in EP waveform recordings typically result from voltage changes due to eye blinks, eye movements, muscle activities, and power line noise. Artifact detection in EPs is essential because artifacts are known to frequently occur in evoked potential data acquisition [13],[17],[20]-[22]. Fig.2. Visual evoked potentials. (a) Recording setup where pattern reversal method is used as stimulation (b) typical VEP morphology. II. Detection of Non Responsive Channels and Trials by Median Distance Test Several researches are going on to improve the quality of bio-medical signals. Errors in averaging of small signal samples can be reduced more efficiently by using median rather than mean [1]-[3]. Artifacts in visual evoked potentials caused by eye movement, eye blink, external noise, internal noise of recording instruments, etc., are removed by using different techniques such as blind component separation, multichannel median test, standard deviation etc., [22]and[27]. A. Detection of Non Responsive Channels If a channel has stuck at fault, the EPs of that channel are discarded from further analysis. Some of the channels may not respond to a particular class of stimulus. In such cases, the non responsive channels may be detected as follows. kth sample of N – trial average evoked potential of each of the M channels is defined by equation (1). / / ; 1 1 , N m c m c n n Z k Z k N 1,2,..., 1,2,..., m M k K (1) Where / ;m c nZ k is the kth sample of nth trial of mth channel evoked potential in response to stimulus c. Energy mZE of N – trial average of each channel m is calculated as / 2 / 1 ( )m c K Z m c k E Z k 1,2,...,m M (2) Let /ch cZE be the median, / maxch cZE be the maximum value and / minch cZE be the minimum value of 1/ 2/ / , ,...,c c M cZ Z ZE E E . Define / // max ch c ch c Zch c Zd E E as the distance between the median and maximum value of energy of M – channels. The channels providing average evoked potentials with energy less than / /ch cZ ch cE d are detected as non responsive channels, and removed from the channel averaging process. This will improve the peaks average EP responses. Fig.3 shows an example of average VEP of a non responsive channel, whereas Fig.4 shows that](https://image.slidesharecdn.com/i1202014251-170704051532/75/Detection-of-Type-B-Artifacts-in-VEPs-using-Median-Deviation-Algorithm-2-2048.jpg)
![Detection of Type-B Artifacts in VEPs using Median Deviation Algorithm DOI: 10.9790/2834-1202014251 www.iosrjournals.org 46 | Page N = No. of tested channels (trilas) III. Removal of Clipped Signals using The clipping (CL) test This test is designed to exclude single trials whose amplitude have been clipped. An evoked potential will be detected as a clipped signal if more than samples have the same maximum or minimum values . To determine if / ;m c nz is clipped, Let 1 / ;max m c nz k (7) and 2 / ;min m c nz k , (8) where / ;m c nz k is sample k, k=1,2,…,K, of / ;m c nz Let / ; 1 1 1, , 1,2,..., 0. m c n k if z k k K v otherwise (9) Similarly let 2 1, 0, kv / ; 2 , 1,2,...,m c nif z k k K otherwise . (10) The single trial EP / ;m c nz is clipped if 1 1 K k k v or 2 1 K k k v . (11) If / ;m c nz is clipped for one or more values of m, then the MCEP ;c nz is regarded as clipped and removed from the ensemble of class c. The parameter is not a function of c. Fig.8 shows an example of a clipped visual evoked potential. Fig. 8. A signal with clipped peaks IV. Artifact detection strategy Artifacts are rejected by first removing signals with excessively large amplitude variations or signals with little or no amplitude variations using a standard deviation test. Signals with samples that have been clipped are removed using a clipping test [6],[18]. A signal having few samples with large deviation from their mean value is said to have type-A artifacts where as a signal having large number of samples with very little 0 0.1 0.2 0.3 0.4 0.5 0.6 0.7 0.8 0.9 -3 -2 -1 0 1 2 3 4 5 6 Time, t (sec) Amplitude(microvolts) An example of a clipped VEP](https://image.slidesharecdn.com/i1202014251-170704051532/75/Detection-of-Type-B-Artifacts-in-VEPs-using-Median-Deviation-Algorithm-5-2048.jpg)
![Detection of Type-B Artifacts in VEPs using Median Deviation Algorithm DOI: 10.9790/2834-1202014251 www.iosrjournals.org 47 | Page deviation from their mean value is said to have type-B artifacts. Kurtosis test is used to detect and reject type-A artifacts that could not be detected by standard deviation test. It enhances the peaks of the average evoked potentials. These tests can be used to identify faulty stuck-at recording channels that always give the same readings. If a channel has stuck at fault, the EPs of that channel are discarded from further analysis. We assure that, if an artifact occurs in one channel then the responses of all the channels are also artifacts. This assumption is valid as the EPs of neighboring channels are highly correlated. Therefore for a given trial, if an artifact is detected in any one or more channels, single trial data of all the channels for that trial are removed. The three tests are described using / ;m c nz to represent single trial EP ,n 1,2,...,n N , in the ensemble of class c, c = 1,2,…,C, recorded at channel m, m = 1,2,…,M. Where N is the number of single trial EPs in each ensemble, C is the number of brain activity categories, and M is the number of channels. The c-class ensemble of EPs collected at channel m will be referred to as m/c ensemble [12],[19],[24]and[25]. A. The Standard Deviation test Standard deviation of a single trial response / ;m c nz in the m/c ensemble is defined as 1/22 / ; / ; / ; 1 1 ˆ K m c n m c n m c n k z k z K (12) If the standard deviation / ;m c n of the samples of a single trial response / ;m c nz in the m/c ensemble is outside a threshold window 1 2, , then nth single trials of all M channels are regarded as artifacts and are discarded from the m/c ensemble [22]. That is, multi channel EP ;c nz is an artifact, if 1n . Where / , 1 M n m c n m (13) and / , 1m c n , if / ; 1m c n or / ; 2m c n , m = 1,2,…,M. The threshold 1 is selected to be close to zero, in order to detect responses that are relatively constant over the entire duration of the event related potential (ERP), whereas the threshold 2 is determined empirically. If the standard deviation is less than the threshold 2 , or greater than the threshold 2 for all n at any c, the channel is regarded as faulty and the EPs of the faulty channel are removed from further processing. Fig.9 shows type-A artifact detected by standard deviation test. Fig. 9. One of the artifact signals detected by standard deviation test. 0 0.1 0.2 0.3 0.4 0.5 0.6 0.7 0.8 0.9 -3 -2 -1 0 1 2 3 Time, t(sec) Amplitude,V(microvolts)](https://image.slidesharecdn.com/i1202014251-170704051532/75/Detection-of-Type-B-Artifacts-in-VEPs-using-Median-Deviation-Algorithm-6-2048.jpg)
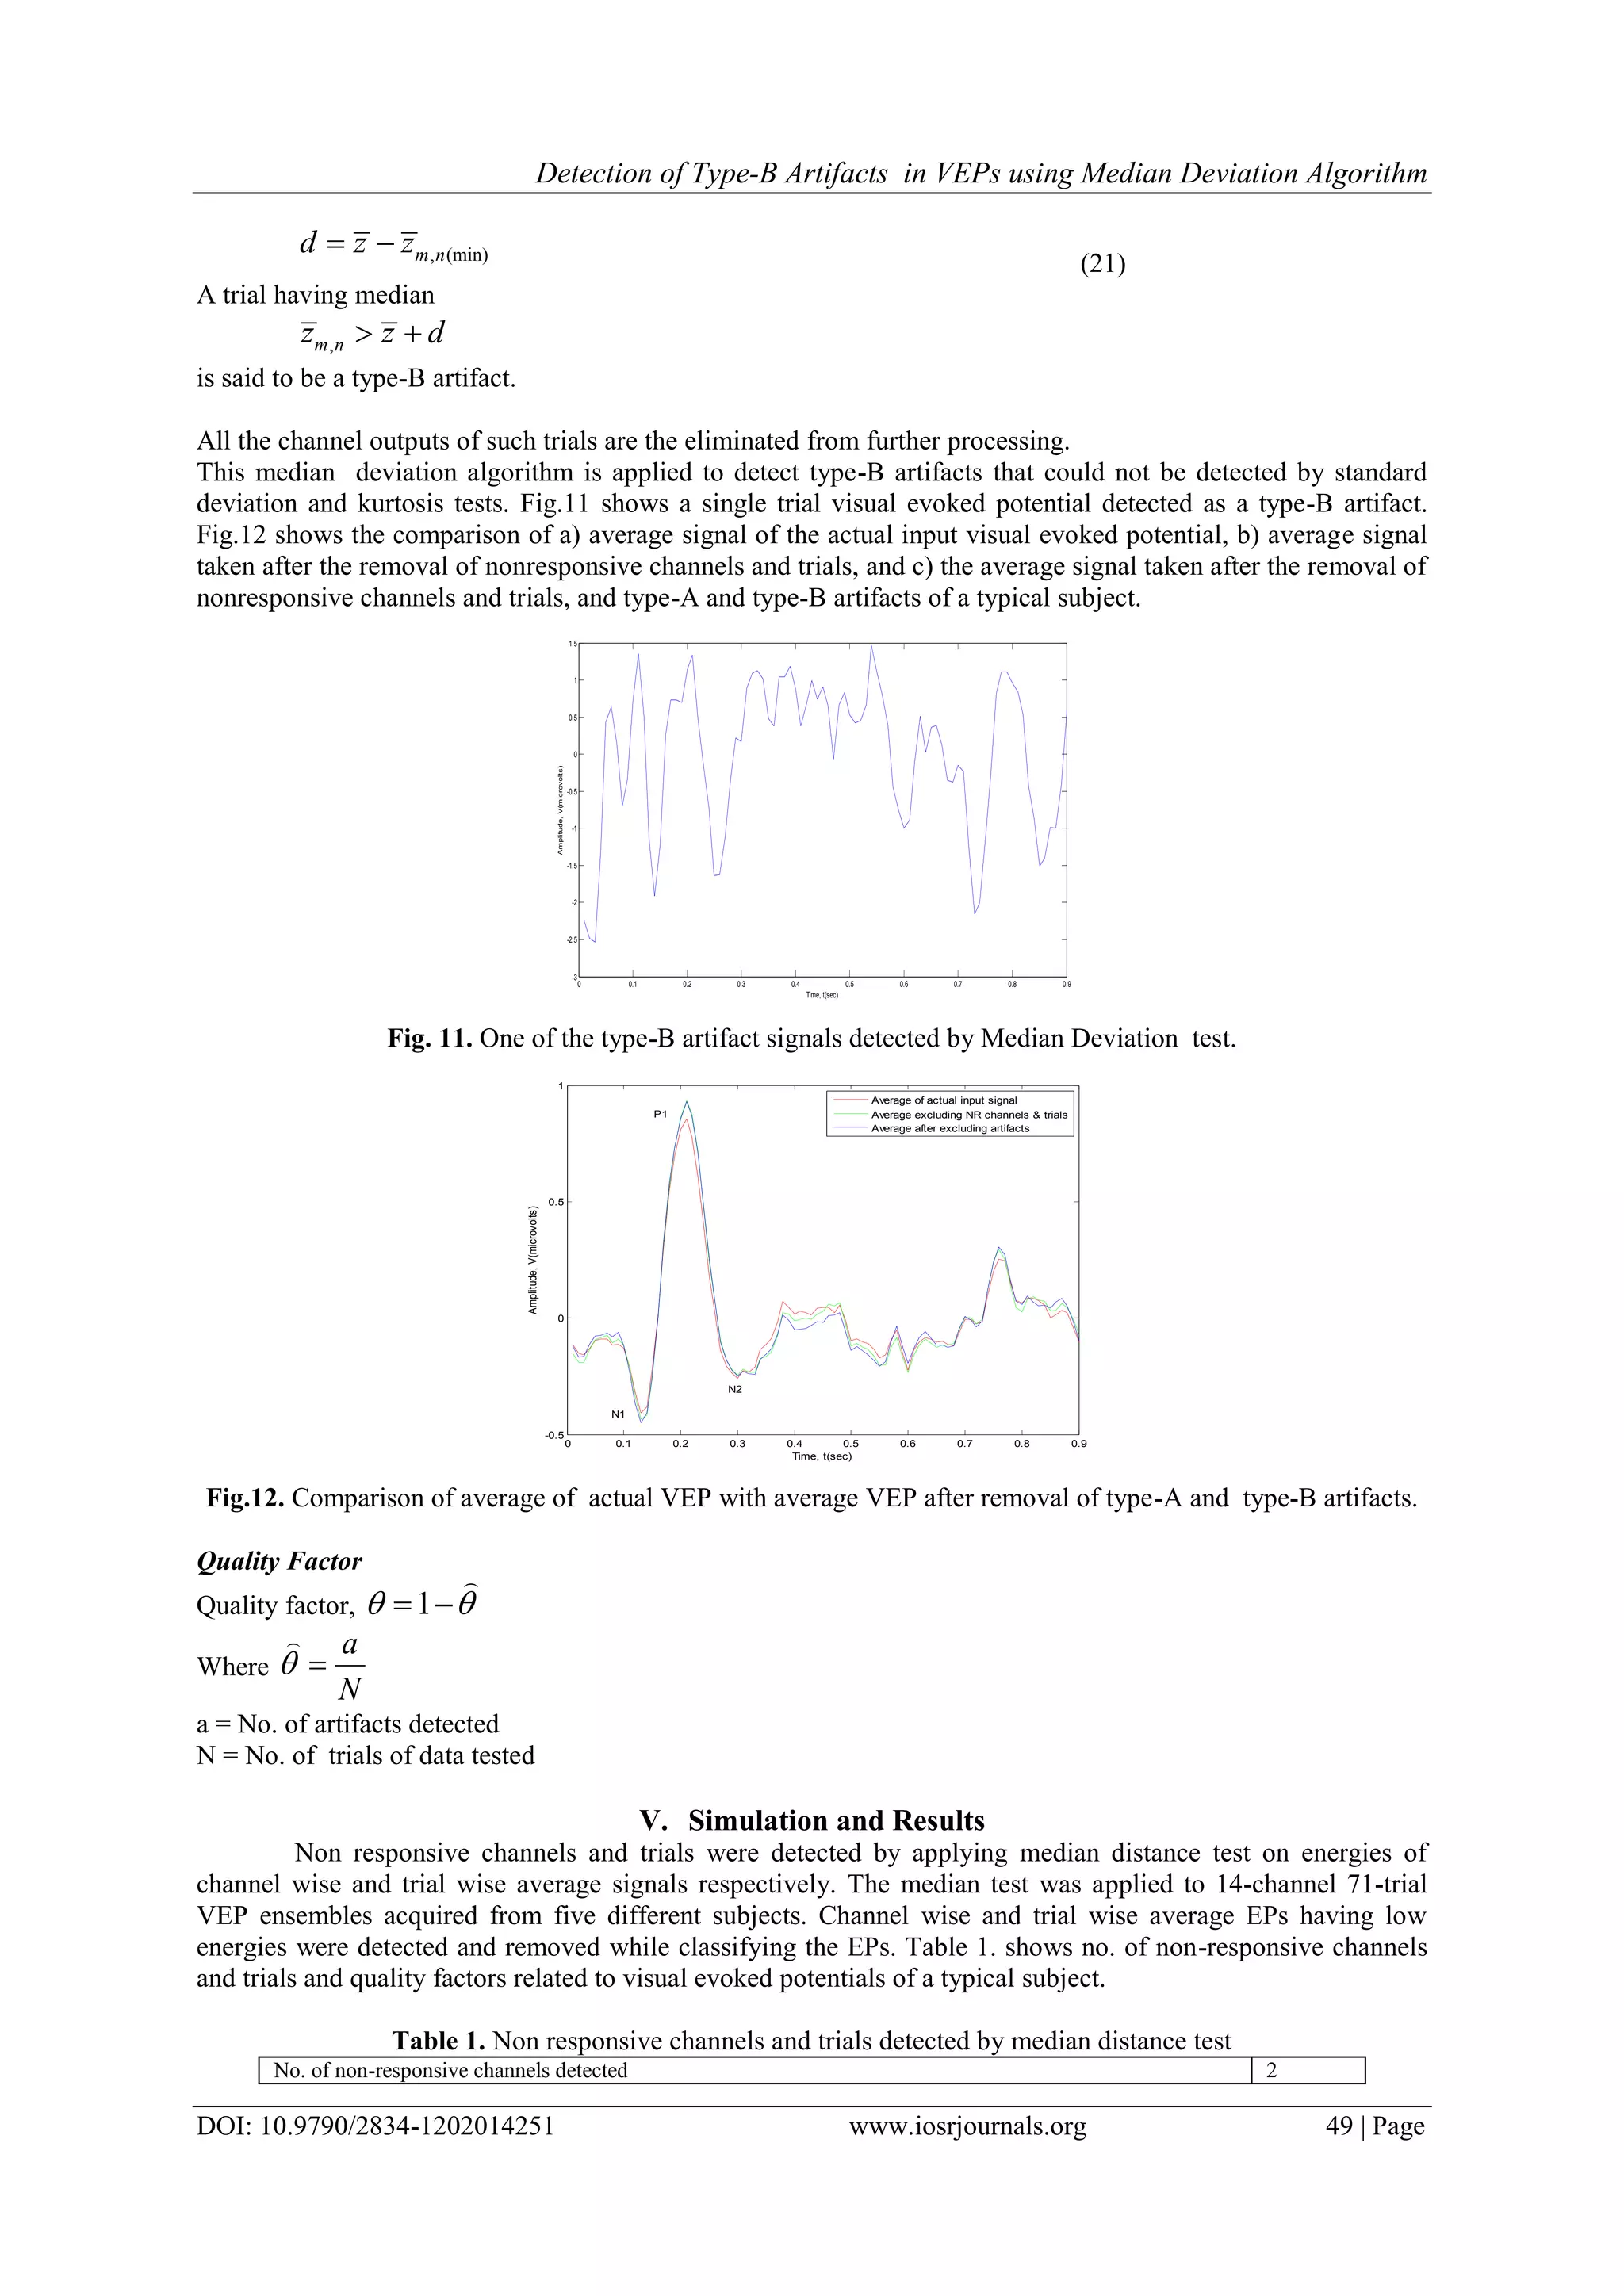
![Detection of Type-B Artifacts in VEPs using Median Deviation Algorithm DOI: 10.9790/2834-1202014251 www.iosrjournals.org 48 | Page B. The Kurtosis test Kurtosis is the fourth order moment, which is useful in the detection of transients due to external noise such as switching on/off of electrical or electronic equipment. If the kurtosis 4 / ; / ; / ; 1 / ; ˆ1 K m c n m c n m c n k m c n z k z K (14) of the samples of a single trial response / ;m c nz in the m/c ensemble is outside a threshold window 1 2 [ , ] , then the nth single trials for all M channels are regarded as artifacts and are discarded from m/c ensemble. Fig. 10. One of the artifact signals detected by kurtosis test. This test detects and excludes signals with higher peaks. Fig.10 shows a type-A artifact detected by kurtosis test. C. The Median Deviation Test Errors in averaging of small signal samples of biomedical signals can be reduced more efficiently by using median rather than mean. This iterative test is designed to identify the remaining atypical responses (type- B artifacts) in the ensembles after the clip, standard deviation and kurtosis tests have been applied.. The most obvious choice is the ensemble averaged EP, however, the ensemble average is a biased estimate of the central tendency in the presence of artifacts. We, therefore, use a median-based approach to exclude atypical EPs. In this second step, because data is valuable, we prefer to use a multichannel approach to decide if the MCEP Zc;n is an artifact rather than making a decision based on detecting artifacts in individual channels. Median signal evaluated over M - channels considering N - trials is (15) N - trail median signal of mth channel is / ;( ) [ ( ), ]m m c nz k Med z k n (16) Median of nth trial on mth channel is noted as , / ,[ ( )]m n m c nz Med z k (17) Minimum median value is , (min) ,[ ]m n m nz Min z (18) Maximum median value is , (max) ,[ ]m n m nz Max z (19) Overall median of these medians is ,[ ]m nz Med z (20) Median distance, 0 0.1 0.2 0.3 0.4 0.5 0.6 0.7 0.8 0.9 -4 -3 -2 -1 0 1 2 Time, t(sec) Amplitude,V(microvolts) ( ) [ ( ), ],mz k Med z k m 1,2,3,...,k K M N](https://image.slidesharecdn.com/i1202014251-170704051532/75/Detection-of-Type-B-Artifacts-in-VEPs-using-Median-Deviation-Algorithm-7-2048.jpg)
![Detection of Type-B Artifacts in VEPs using Median Deviation Algorithm DOI: 10.9790/2834-1202014251 www.iosrjournals.org 50 | Page No. of non-responsive trials detected after removal of non responsive channels 3 Channel wise Q - factor before removal of non-responsive channels 85.71% Q - factor after removal of non-responsive channels but before removal of non-responsive trials 95.78% Q - factor after removal of non-responsive channels and trials 100% The artifact detection strategies using standard deviation test, clip test and kurtosis test were applied to 14- channel VEP ensembles acquired from four different subjects. Single trial EPs having clipped peaks, lower (close to zero) or higher standard deviation or kurtosis or both, are detected as artifacts and removed while classifying the EPs. Examples of artifacts detected by standard deviation and kurtosis are shown in Fig. 3 to Fig. 5. The table 2. shows details of artifacts detected in 14-channel 71-trial evoked potentials of a typical subject. Table 2. Type-A artifacts detected by standard deviation and kurtosis tests and type-B artifacts detected by median deviation test No. of type-A artifacts detected using standard deviation test alone 3 No. of type-A artifacts detected using KU test after removal of artifacts using STD test 2 No. of type-B artifacts detected by median deviation test 1 Total no. of type-A and type-B artifacts detected 6 Quality factor before removal of artifacts 95.77% Quality factor after removal of type-A artifacts using STD test but before using KU test 97.05% Quality factor after removal of type-A artifacts 98.48% Quality factor after removal of type-A and type-B artifacts 100% VI. Conclusions The primary objective of this work is to identify and reject non responsive channels and trials and to identify and reject artifacts in the acquisition of evoked potentials. Energy of average EP of each channel, and of each trial is obtained. Then non responsive channels and trials are detected and removed by using channel wise and trial wise median test respectively. This improves the peaks of average EPs and hence classifier performance. The artifacts were first detected using a sequence of within channel standard deviation and clipping tests. Some more artifacts which could not be detected by these two tests are identified by using kurtosis test. It is observed that removal of artifacts using kurtosis test improves peaks of the average VEP and also it improves the performance of evoked potential classifiers, much more effectively in addition to that provided by standard deviation test. References [1]. G. D. Dawson, “A summation technique for detecting small signals in a large irregular background,” J. Physiol. (London), vol. 115, p. 2, 1951. [2]. G. D. Dawson, “A summation technique for the detection of small evoked potentials,”Electroencephal. Clin. Neurophysiol., vol. 6, pp. 65-.84, 1954 [3]. R. P. Borda and J. D. Frost, “Error reduction in small sample averaging through the use of the median rather than the mean,” lectroencephal. Lin. Neurophysiol., vol. 25, pp. 391-392, 1968 [4]. B. Lutkenhoner and C. Pantev, “Possibilities and limitations of weighted.averaging,” Biol. Cybern.,vol. 52, pp. 409-416, 1985 [5]. R. J. Chabot and E. R. Jhon, “Normative evoked potential data,” in Handbook of Electroencephalography and Clinical Electrophysiology: Clinical Applications of Computer Analysisof EEG and other Neurophysiological Signals, ch. 1, pp. 263-309, Amsterdam/New York: Elsevier,1986. [6]. P.J. Rousseeuw, A.M. Leroy, “Robust regression and outlier detection,” Wiley Series in Probability and Mathematical Statistics, Wiley, New York, 1987 [7]. A. Oppenheim and R. Schafer, Discrete-Time Signal Processing. PrenticeHall, 1989 [8]. C. Davilla and M. Mobin, “Weighted averaging of evoked potentials,” IEEE Trans. Biomed. Eng.,vol. 39, pp. 338-345, 1992. [9]. C. W. Therrien, Discrete Random Signals and Statistical Signal Processing. New Jersy: Prentice-Hall, 1993. [10]. S. M. Kay, “Spectral Estimation.” Advanced Topics in Signal Processing, chapter 2. Prentice Hall, 1993. [11]. T. W. Picton, O. G. Lins, and M. Scherg, “The recording and analysis of event related potentials,” in Handbook of Neurophysiology, Vol. 10 (F. Boller and J. Grafman, eds.), pp. 3-73, Baltimore, Elseviere Science, 1995. [12]. L. Gupta, D.L. Molfese, R. Tammana, P.G. Simos, “Non-linear alignment and averaging for estimating the evoked potential,” IEEE Tran. Biomed. Eng. 43 (4) (1996) 348–356. [13]. T.D. Lagerlund, F.W. Sharbrough, N.E. Busacker, “Spatial filtering of multichannel electroencephalo-graphic recordings through principal component analysis by singular value decomposition,” J. of Clin. Neurophysiol. 14 (1997) 73–82. [14]. G. G. Celesia and N. S. Peachey, “Visual evoked potentials and electroencephalograms,” in Electroencephalography. Basic Principles, Clinical Applications and Related Fields (E. Niedermeyer and F. Lopes da Silva, eds.), pp. 968-993, Baltimore: Williams & Wilkins, 1999. [15]. J. Polich, “P300 in clinical applications,” in Electroencephalography. Basic Principles, Clinical Applications and Related Fields (E. Niedermeyer and F. Lopes da Silva, eds.), pp. 1073-1091, Baltimore: Williams & Wilkins, 1999. [16]. R.J. Croft, R.J. Barry, “Removal of ocular artifact from EEG: a review,” Clin. Neurophysiol. 30 (1) (2000) 5–19. [17]. T.-P. Jung, S. Makeig, C. Humphries, T.-W. Lee, M.J. Mckeown, V. Iragui, T.J. Sejnowski, “Removing electroencephalographic artifacts by blind source separation,” Psychophysiology 37 (2000) 163–178. [18]. R. Barandela, E. Gasca, “Decontamination of training samples for supervised pattern recognition methods,” in: Proceedings of Joint IAPR International Workshops SSPR and SPR 2000, Springer, NewYork, 2000, pp. 621–630](https://image.slidesharecdn.com/i1202014251-170704051532/75/Detection-of-Type-B-Artifacts-in-VEPs-using-Median-Deviation-Algorithm-9-2048.jpg)
![Detection of Type-B Artifacts in VEPs using Median Deviation Algorithm DOI: 10.9790/2834-1202014251 www.iosrjournals.org 51 | Page [19]. L. Gupta, J. Phegley, D.L. Molfese, “Parametric classification of multichannel evoked potentials,” IEEE Trans. Biomed. Eng. 49 (8) (2002) 905–911 49(9) (2002) 1070 [20]. G.L. Wallstrom, R.E. Kass, A. Miller, J.F. Cohn, N.A. Fox, “Automatic correction of ocular artifacts in the EEG: a comparison of regression based and component-based methods,” Int. J. Psychophysiol. 53 (2) (2004) 105–119. [21]. S. Casarotto, A.M. Bianchi, S. Cerutti, G.A. Chiarenza, “Principal component analysis for reduction of ocular artifacts in event- related potentials of normal and dyslexic children,” Clin. Neurophysiol. 115 (3) (2004) 609–619. [22]. C.A. Joyce, I.F. Gorodnitsky, M. Kutas, “Automatic removal of eye movement and blink artifacts from EEG data using blind component separation,” Psychophysiology 41 (2) (2004) 313–325. [23]. Karl Friston, “A theory of cortical responses,” Philosophical Transactions of the Royal 9 April 2005) 815-836. [24]. F. Vazquez, J.S. Sanchez, F. Pla, “A stochastic approach to Wilson’s Editing Algorithm,” IbPRIA 2005, pp. 34–42. [25]. L. Gupta, B. Chung, M.D. Srinath, D.L. Molfese, H. Kook, “Multichannel fusion models for the parametric classification of differential brain activity,” IEEE Trans. Biomed. Eng. 52 (11) (2005) 1869–1881. [26]. Rodrigo Quan Quroga, Evoked potentials Encyclopedia of Medical Devices and Instru-mentation, Second Edition, John Wiley & Sons, Inc.(2006). [27]. Hyunseok Kook, Lalit Gupta, Srinivas Kota, Dennis Molfese, H. Lyytinen, “An offline/real-time artifact rejection strategy to improve the classification of multi-channel evoked potentials,” Pattern Recognition (2008), pp. 1985-1996. [28]. H. Cecotti, “Classification of Steady-State Visual Evoked Potentials based on the Visual Stimuli Duty Cycle,” IEEE, 3rd International Symposium on Applied Sciences in Biomedical and Communication Technologies (ISABEL), 2010. [29]. Zhiguo Zhang, Keith D. K. Luk, and Yong Hu, “Identification of detailed time-frequency components in somatosensory evoked potentials,” IEEE Transactions on Neural Systems and Rehabilation Engineering, Vol. 18, NO. 3, pp.245-254, 2010. [30]. Ruben Gaitan-Ortiz, Oscar Yanez-Suarez, and Juan M Cornejo-Cruz, “Evoked potentials SNR maximization by PCA and genetic algorithms,” Proceedings of the 5th International IEEE EMBS Conference on Neural Engineering Cancun, Mexico, April 27 - May 1, 2011, pp. 166-169, 2011. [31]. H. Nezamfar, U. Orhan1, D. Erdogmus, K.E. Hild, S. Purwar1, B. Oken and M.Fried-Oken, “On visual evoked potentials in EEG induced by multiple pseudorandom binary sequences for brain computer interface design,” IEEE International Conference on Acoustics, Speech and Signal Processing (ICASSP), pp. 2044-2047, 2011. [32]. Gary Garcia-Molina, and Danhua Zhu, “Optimal spatial filtering for the steady state visual evoked potential: BCI application,”Proceedings of the 5th International IEEE EMBS Conference on Neural Engineering Cancun, Mexico, April 27 - May 1, 2011, pp. 156-160, 2011. About the Author- V. Adinarayana Reddy received his graduate degree in Electronics and Telecommunication Engineering from The Institution of Electronics and Telecommunication Engineers, New Delhi in1996 and M. Tech in Electronic Instrumentation and Communication Systems from Sri Venkateswara University, Tirupati in 1999. He joined as faculty in the Department of Electronics and Communication Engineering at KSRM College of Engineering, Cuddapah. About the Author- Dr Putta Chandra Sekhar Reddy received the B.Tech. degree in the electronics and commu-nications engg from JNTUH, Hyderabad, India and M.E from Bharatiyar University, Coimbatore. He received M.Tech and Ph.D from JNT University, Hyderabad, India. He joined as faculty in JNTU, Anantapur. Currently he is working as Professor Co-ordinator in JNTUH Hyderabad, India. He is an author of numerous technical papers in the Fields of High speed networking and wireless networks. His research interests include mobile and wireless communications and networks, personal communications service and high speed communications and protocols.](https://image.slidesharecdn.com/i1202014251-170704051532/75/Detection-of-Type-B-Artifacts-in-VEPs-using-Median-Deviation-Algorithm-10-2048.jpg)