GDB (GNU DEBUGGER) senkumar@juniper.net Debugging Modern C++ Application with For a fish, the archer fish is known to shoot down bugs from low hanging plants by spitting water at them. Debugging is twice as hard as writing the code in the first place. Therefore, if you write the code as cleverly as possible, you are, by definition, not smart enough to debug it. - Brian Kernighan
DISCLAIMER The opinions expressed in this presentation and on the following slides are solely those of the presenter. Neither the presenter guarantee the accuracy or reliability of the information provided herein. May you do good and not evil. May you find forgiveness for yourself and forgive others. May you share freely, never taking more than you give!
SIMPLEST DEBUG TOOL?
printf cout
NEXT SIMPLEST DEBUG TOOL?
assert
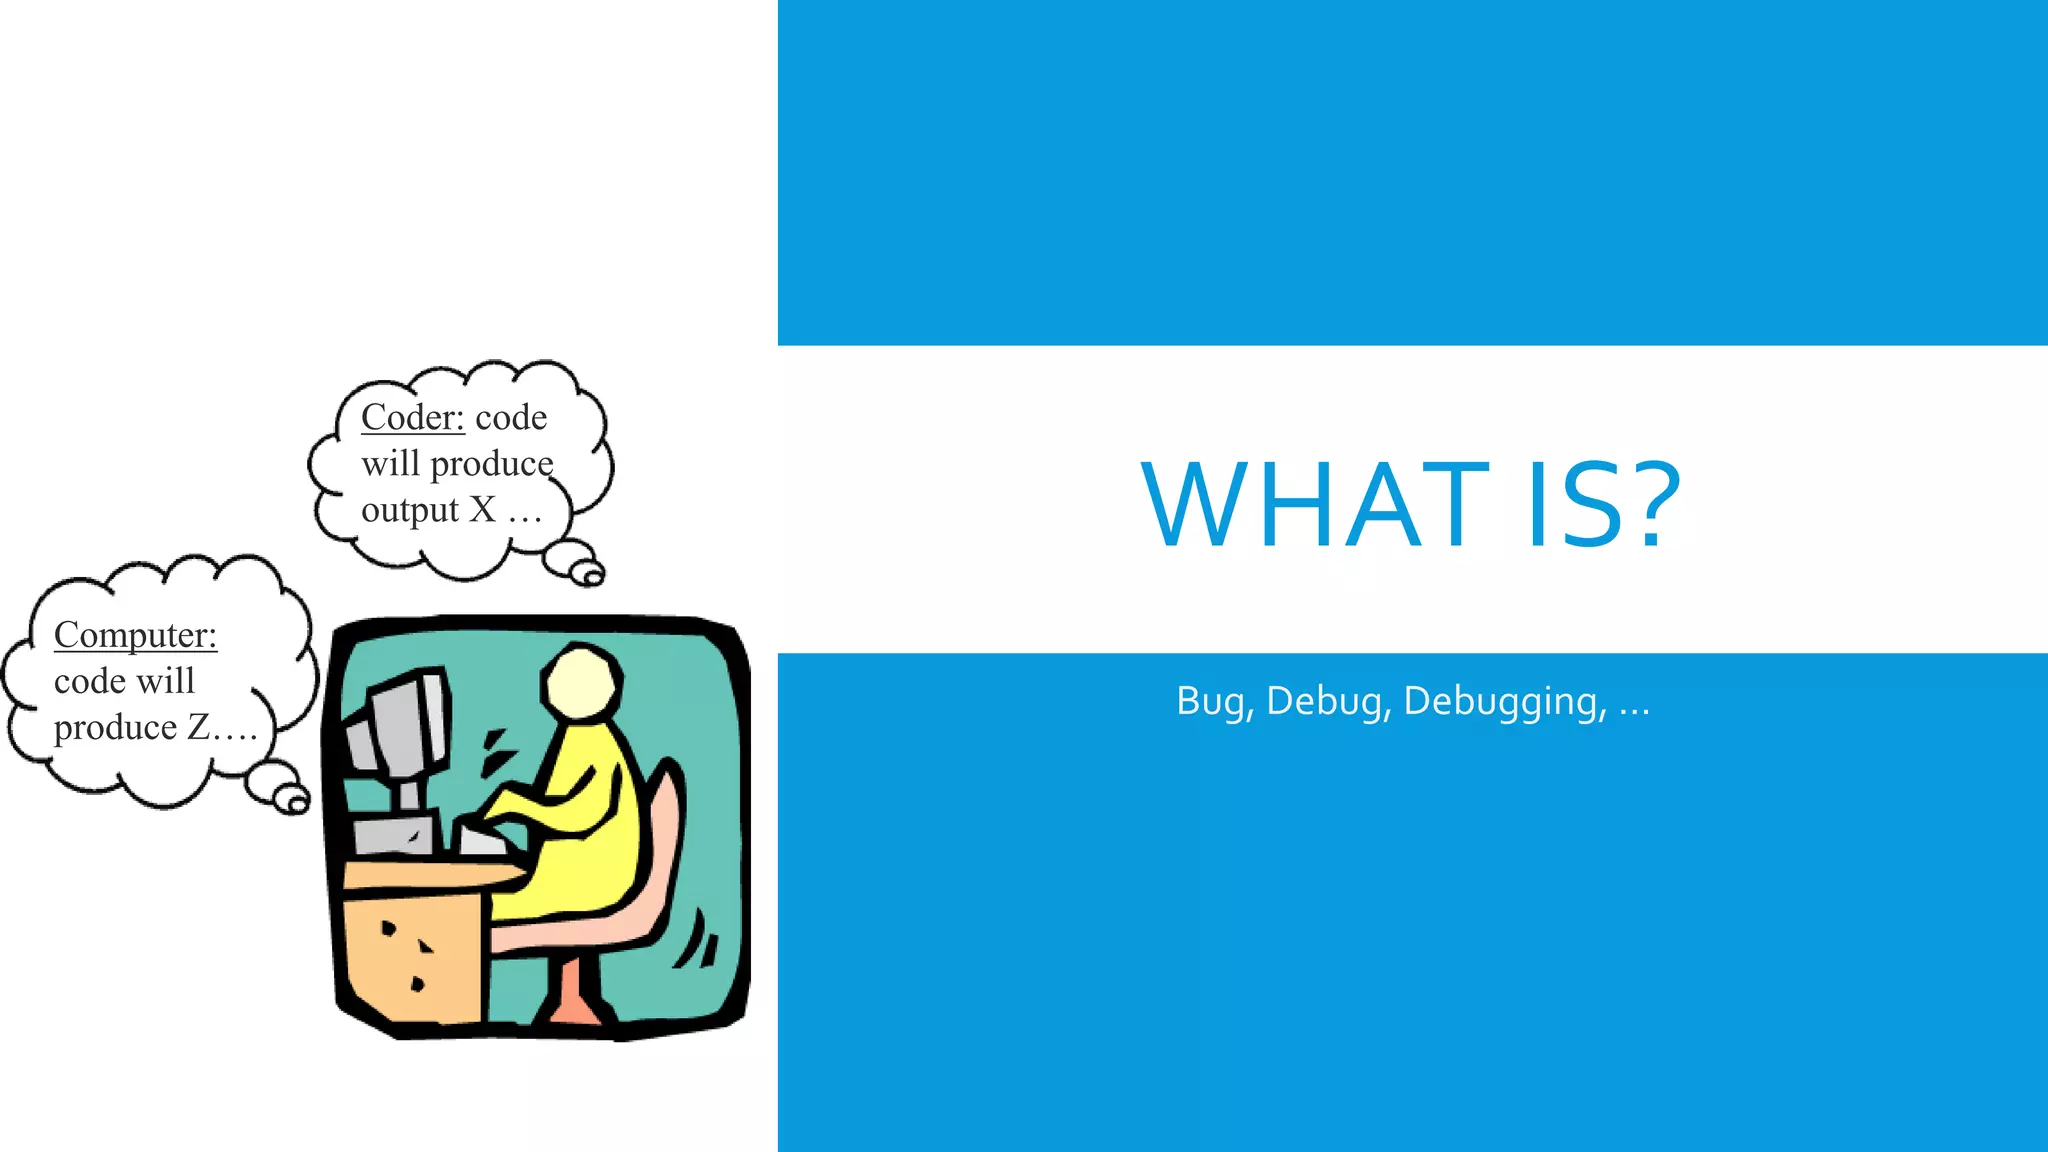
WHAT IS? Bug, Debug, Debugging, … Coder: code will produce output X … Computer: code will produce Z….
WHAT IS - BUG, DEBUG, DEBUGGING, …  Debugging is the process of finding and resolving defects or problems within a computer program that prevent correct operation of computer software or a system.  The terms "bug" and "debugging" are popularly attributed to Admiral Grace Hopper in the 1940s.  On a Mark II computer at Harvard University, a moth stuck in a relay and thereby impeding operation, whereupon she remarked that they were "debugging" the system.  The term "bug", in the sense of "technical error", dates back at least to 1878 andThomas Edison (see software bug for a full discussion).
THE PRINCIPLES OF DEBUGGING
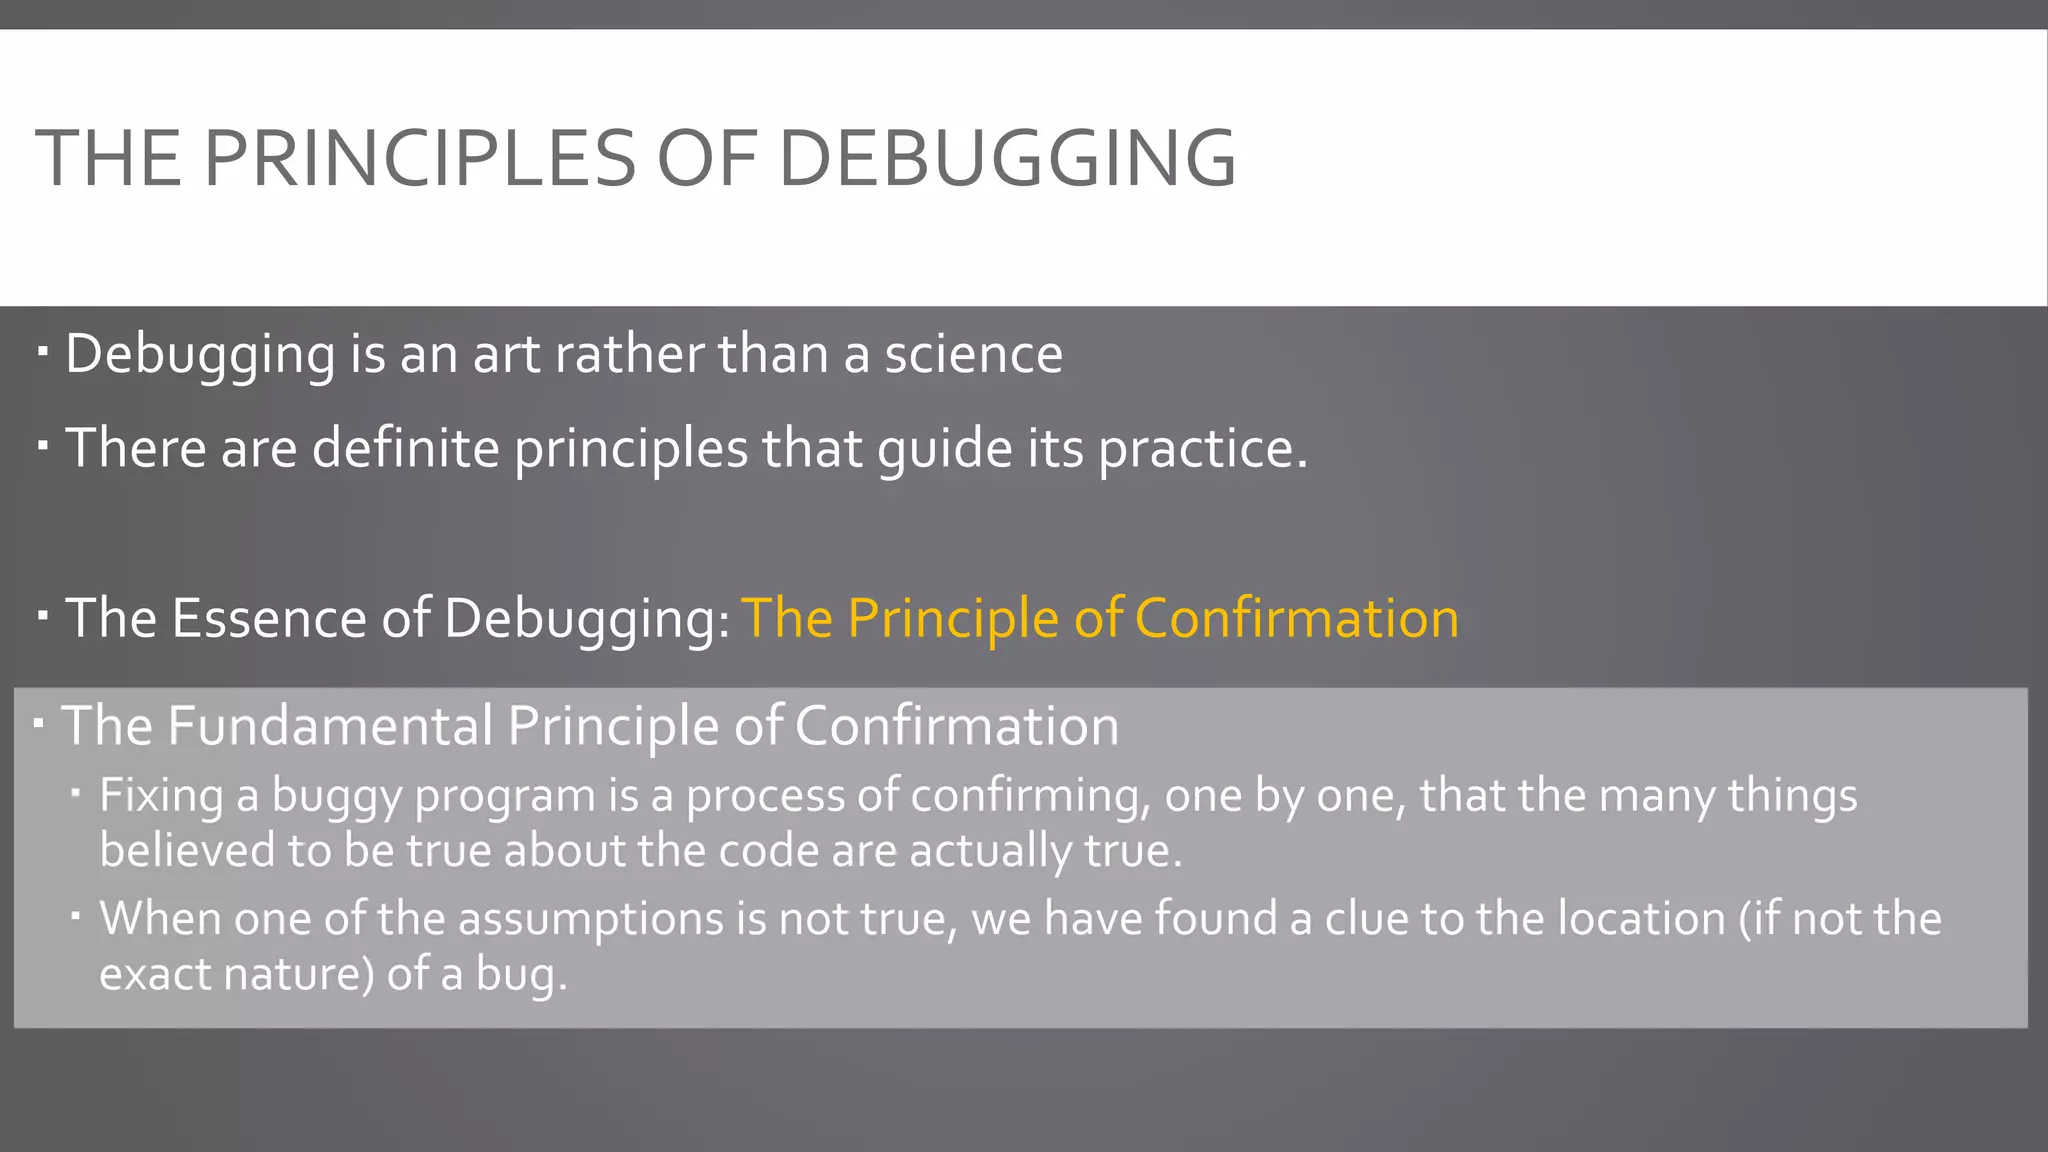
THE PRINCIPLES OF DEBUGGING  Debugging is an art rather than a science  There are definite principles that guide its practice.  The Essence of Debugging:The Principle of Confirmation  The Fundamental Principle of Confirmation  Fixing a buggy program is a process of confirming, one by one, that the many things believed to be true about the code are actually true.  When one of the assumptions is not true, we have found a clue to the location (if not the exact nature) of a bug.
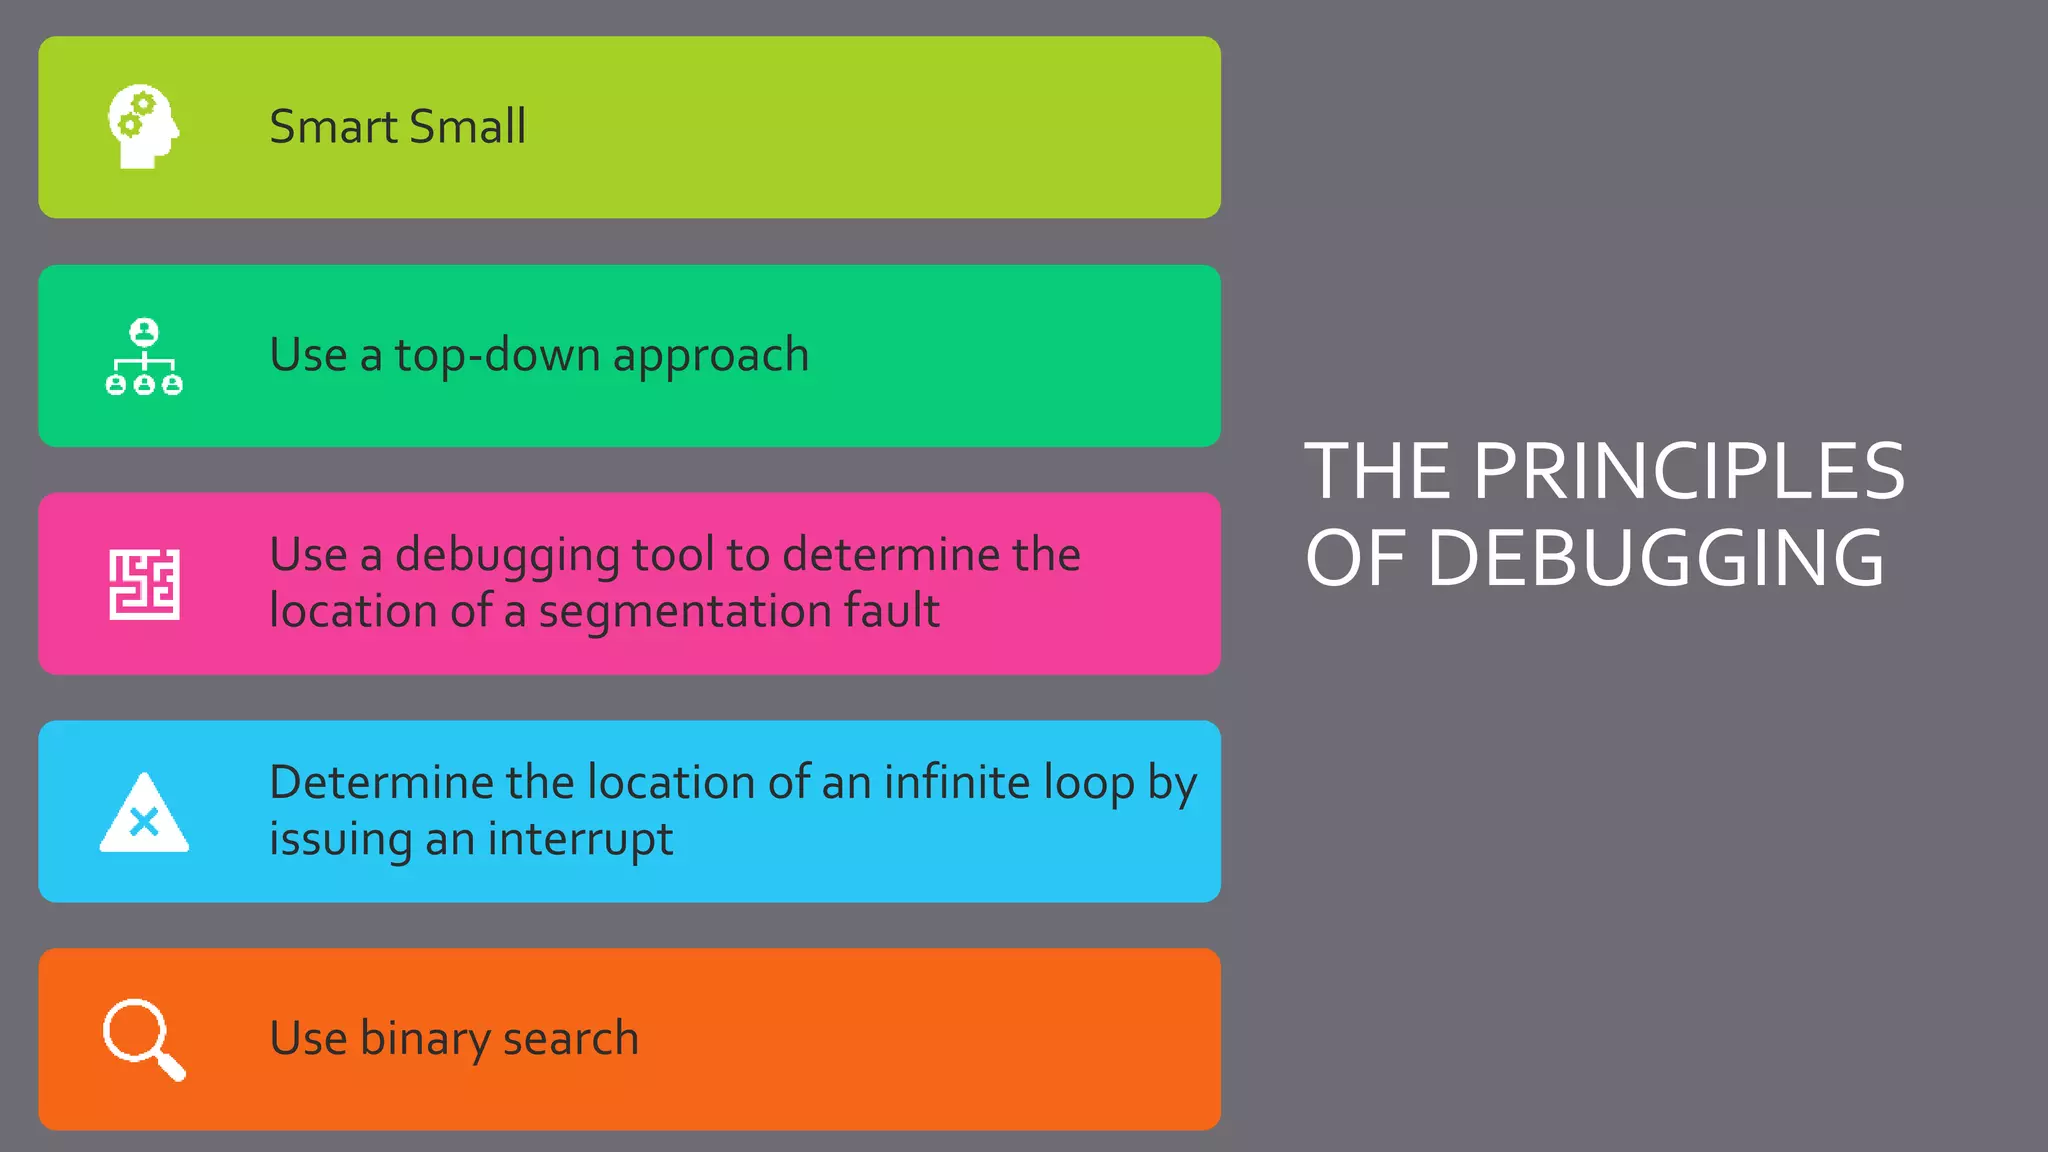
THE PRINCIPLES OF DEBUGGING Smart Small Use a top-down approach Use a debugging tool to determine the location of a segmentation fault Determine the location of an infinite loop by issuing an interrupt Use binary search
WHY TO USE A TOOL TO DEBUG? What is the value of a DebuggingTool for the Principle of Confirmation?
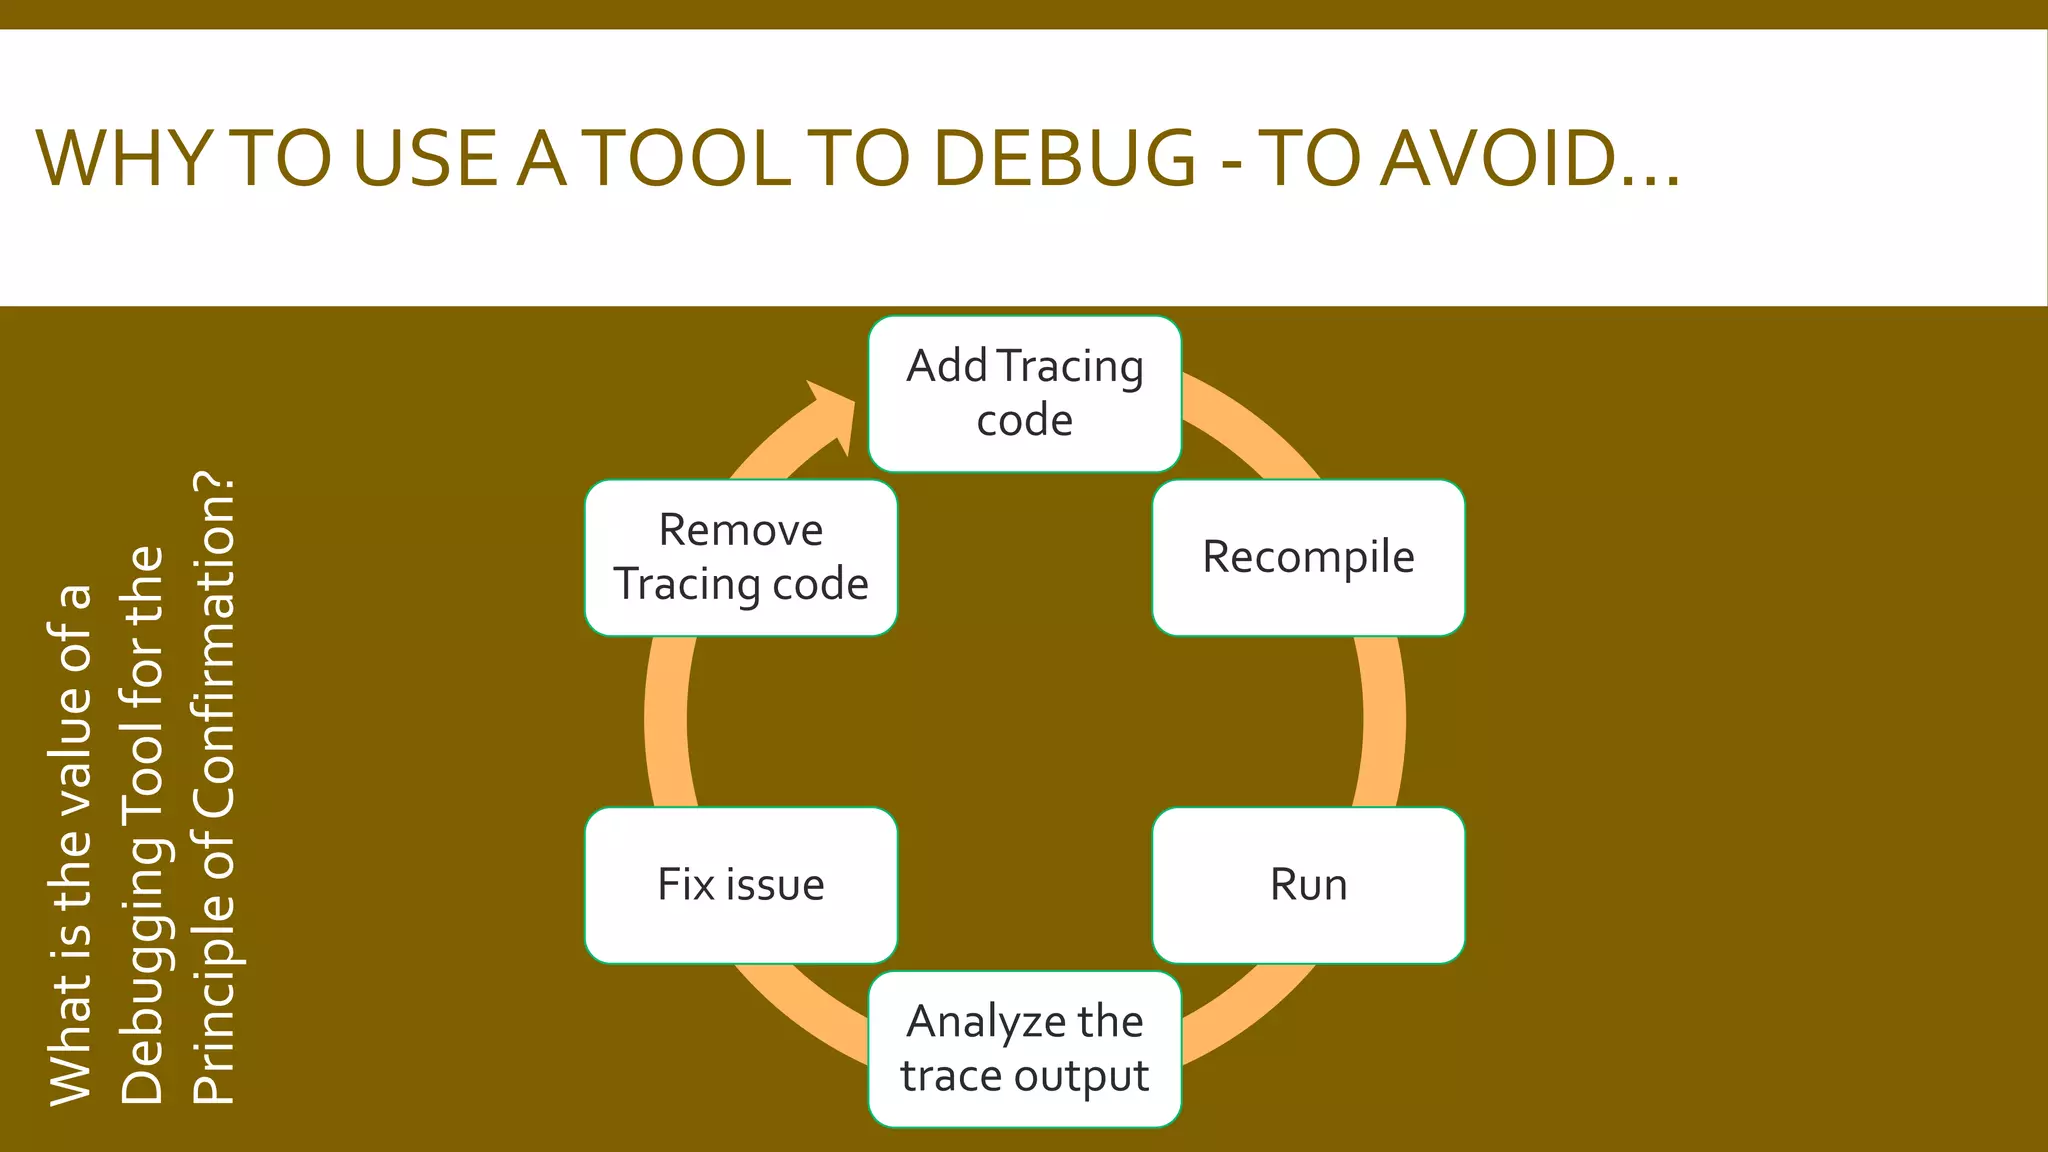
WHYTO USE ATOOLTO DEBUG -TO AVOID… AddTracing code Recompile Run Analyze the trace output Fix issue Remove Tracing code Whatisthevalueofa DebuggingToolforthe PrincipleofConfirmation?
WHAT TO EXPECT OUT OF A DEBUG TOOL? What is the value of a DebuggingTool for the Principle of Confirmation?
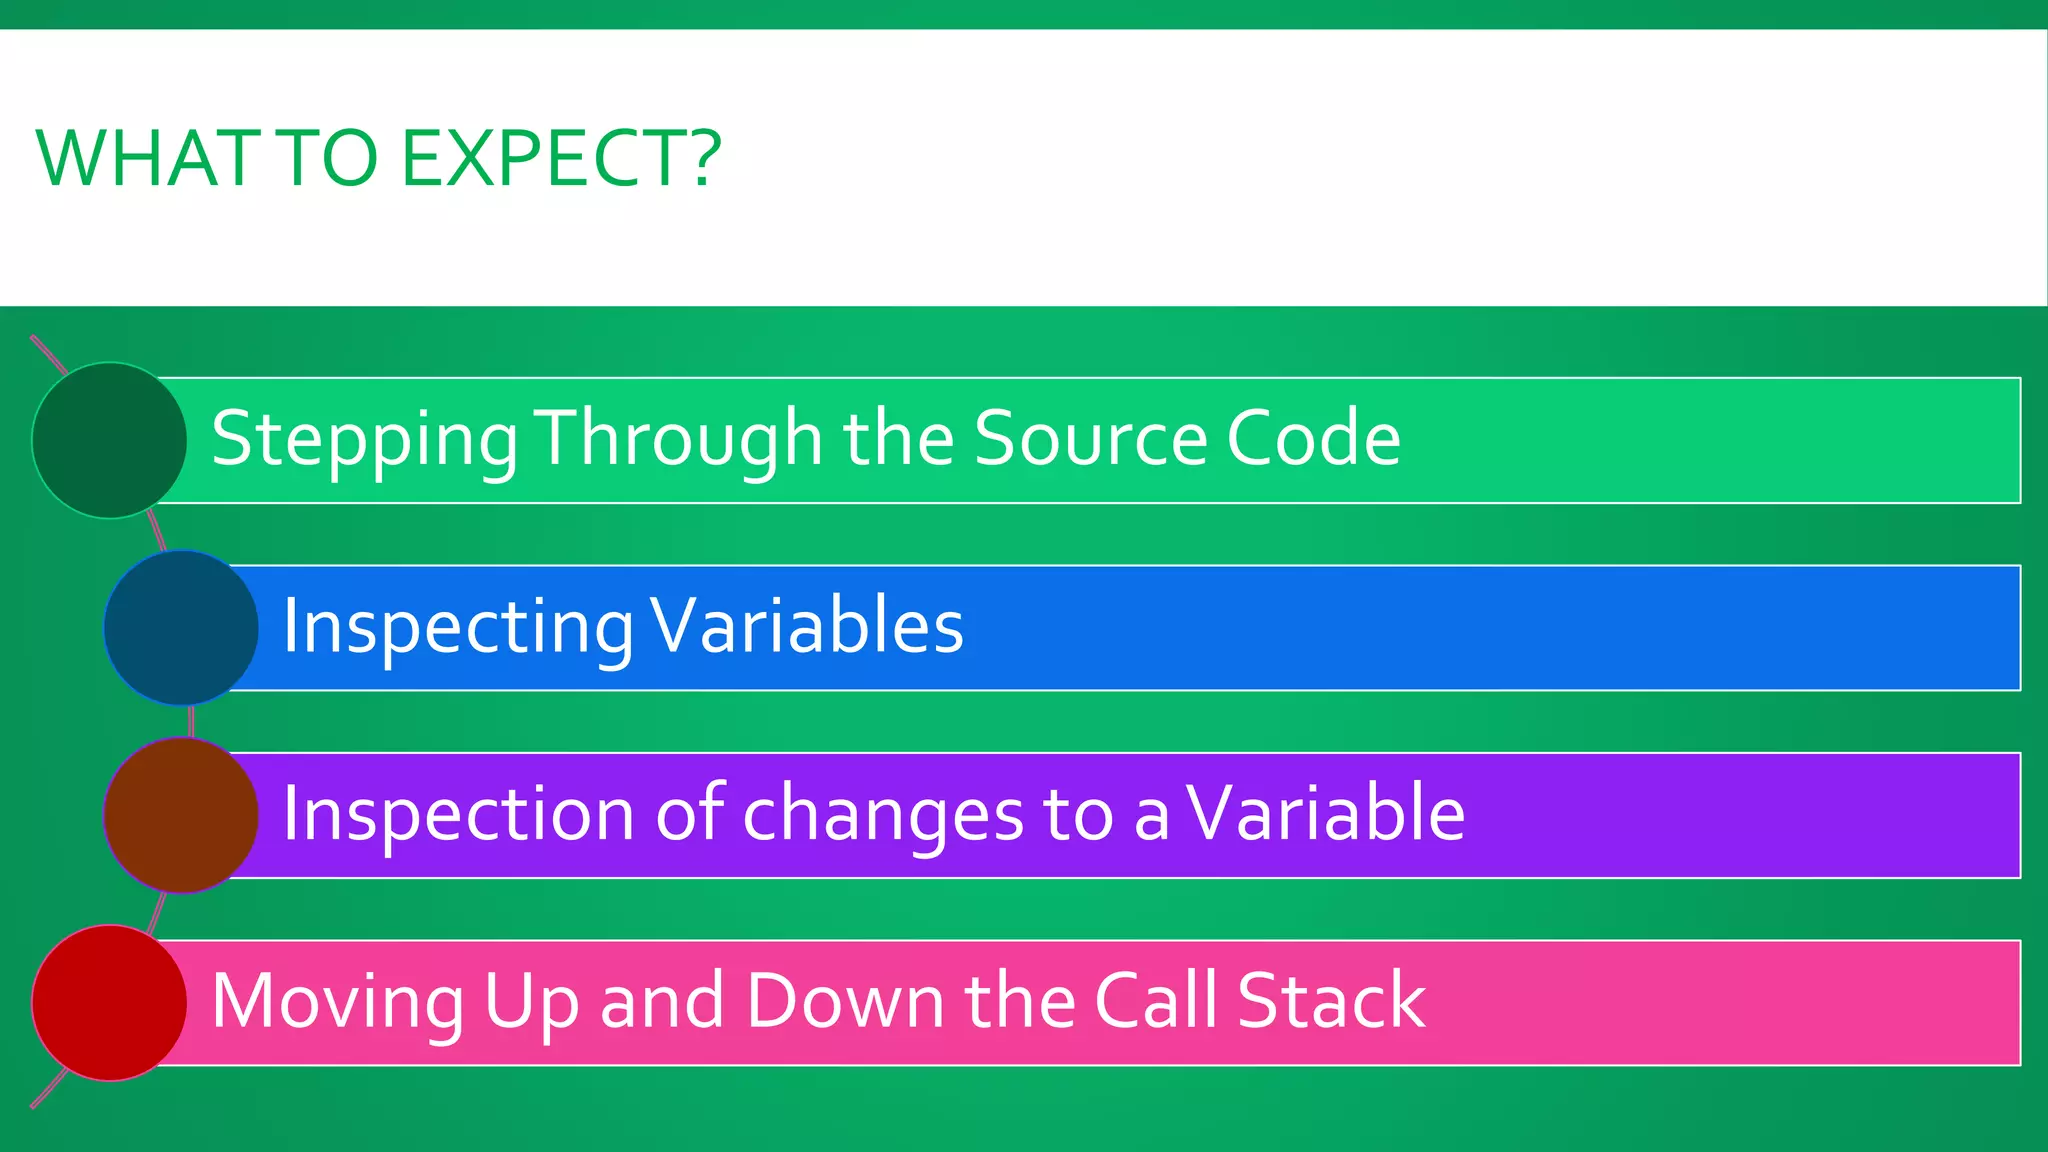
WHATTO EXPECT? SteppingThrough the Source Code InspectingVariables Inspection of changes to aVariable Moving Up and Down the Call Stack
WHATTO EXPECT? SteppingThrough the Source Code Breakpoints Single-stepping Resume
 Debuggers are programs which allow you to execute your program in a controlled manner, so you can look inside your program to find a bug.  Tools that can examine the state of a running program.  Debuggers allow for more fine-tuned control, and don’t force you to repeatedly re-compile your code every time you want to test something new  Common debuggers: adb, dbx, gdb, kdb, wdb, xdb, pdb, ... DEBUGGERS It’s not a tool to remove bugs!
WHAT IS GDB?  GDB is the GNU Project debugger  Richard Stallman was the original author of gdb  GDB can be used to debug programs written in C, C++.  gdb is a reasonably sophisticated text-based debugger.  Start your program, specifying anything that might affect its behavior.  Make your program stop on specified conditions.  Examine what has happened, when your program has stopped.  Change things in your program, so you can experiment with correcting the effects of one bug and go on to learn about another.
WHYTO LEARN GDB? Despite its age, gdb remains an amazingly versatile and flexible tool Mastering it can save you huge amounts of time when trying to debug problems in your code.
USAGE  Usage gdb [prog] [core | procID]  GDB is invoked by running the program gdb.  Once the debugger is started, GDB reads command until you tell it to exit.  To exit gdb: quit  GDB can be started with variety of arguments and options.  gdb program – one argument, which is an executable file more than one arguments can be provided  gdb program core – two arguments, one executable and one core file  gdb program 1234 – specify process id as second argument
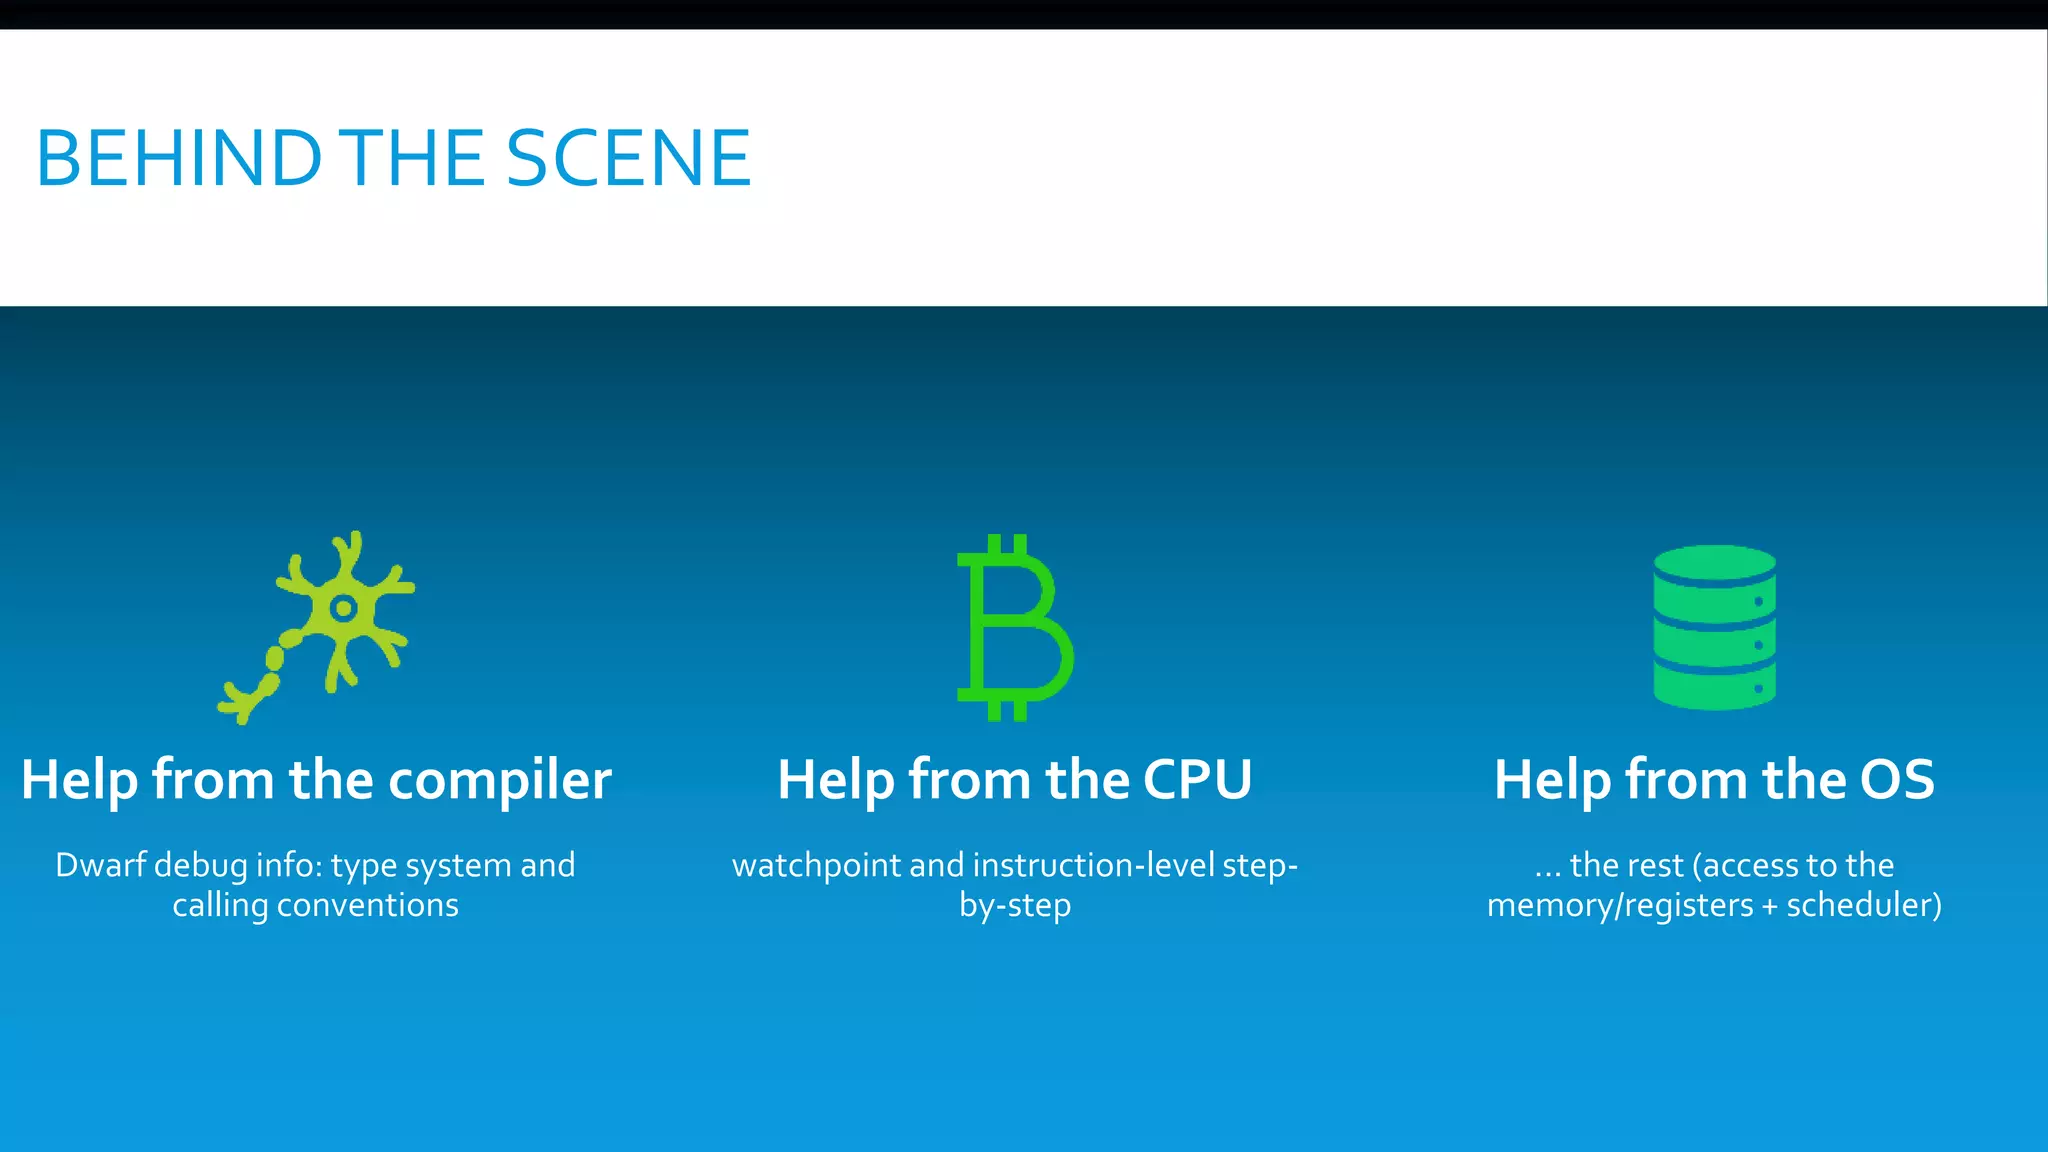
Help from the compiler Dwarf debug info: type system and calling conventions Help from the CPU watchpoint and instruction-level step- by-step Help from the OS ... the rest (access to the memory/registers + scheduler) BEHINDTHE SCENE
COMPILING FOR DEBUGGING  In order to debug a program effectively, you need to generate debugging information when you compile it.  Debugging information is stored in the object file; it describes the data type of each variable or function and the correspondence between source line numbers and addresses in the executable code.  With gcc and g++, this is accomplished using the -g option.  This option tells the compiler to insert more information about data types, etc., so the debugger gets a better understanding of it.
 The .gdinit file is the initialization file for gdb.  Contain GDB commands to automatically execute during GDB startup  ~/.gdbinit - User initialization file.  It is executed unless user specifiedGDB options - nx, -n or -nh.  ./.gdbinit - Initialization file for current directory.  It may need to be enabled with GDB security command set auto-load local-gdbinit. .GDBINIT
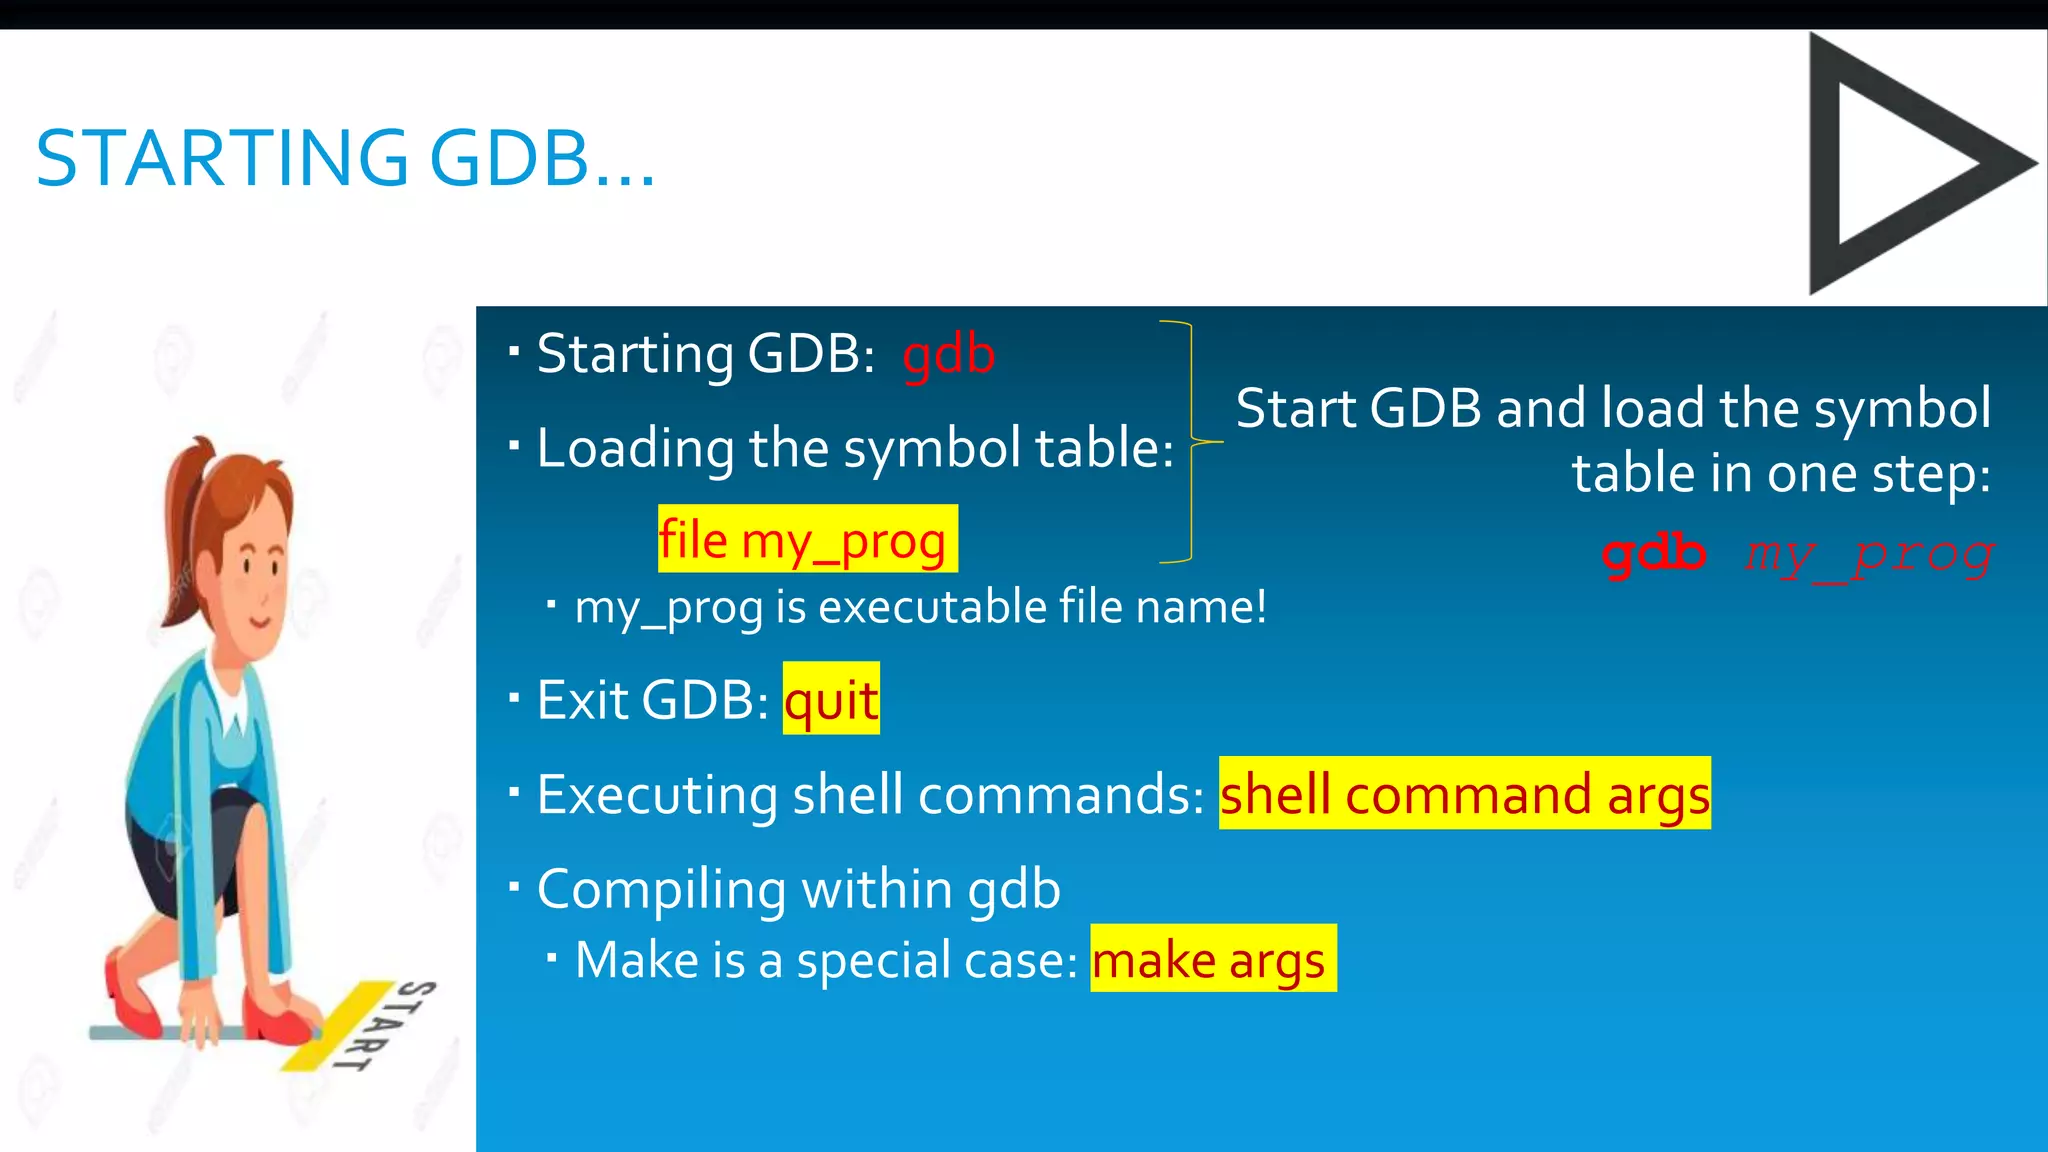
STARTING GDB…  Starting GDB: gdb  Loading the symbol table: file my_prog  my_prog is executable file name!  Exit GDB: quit  Executing shell commands: shell command args  Compiling within gdb  Make is a special case: make args Start GDB and load the symbol table in one step: gdb my_prog
GDB COMMAND SHORT-HANDS  Command names may be truncated if the abbreviation is unambiguous: s (for step), r (for run)  UNIX styleTAB completion for the command names.  Alternative way: complete chars. Eg.: complete h results in: handle hbreak help  Getting help:  help (or h) – lists all classes of commands.  h command - displays a short description of the command
RUNNING A PROGRAM  When gdb starts, the program is not actually running. It won't run until it is instructed.  run (or r) -- creates an inferior process that runs your program.  If there are no execution errors the program will finish and results will be displayed  In case of error, the GDB will show:  The line the program has stopped on and  A short description of what it believes has caused the error  Redirecting output: run > outfile direct the output to the file outfile.  "Inferior" is a general term to mean "something that you are using gdb to debug" -- generally a process or perhaps a kernel running on an emulator or on some other piece of hardware connected on a serial line.
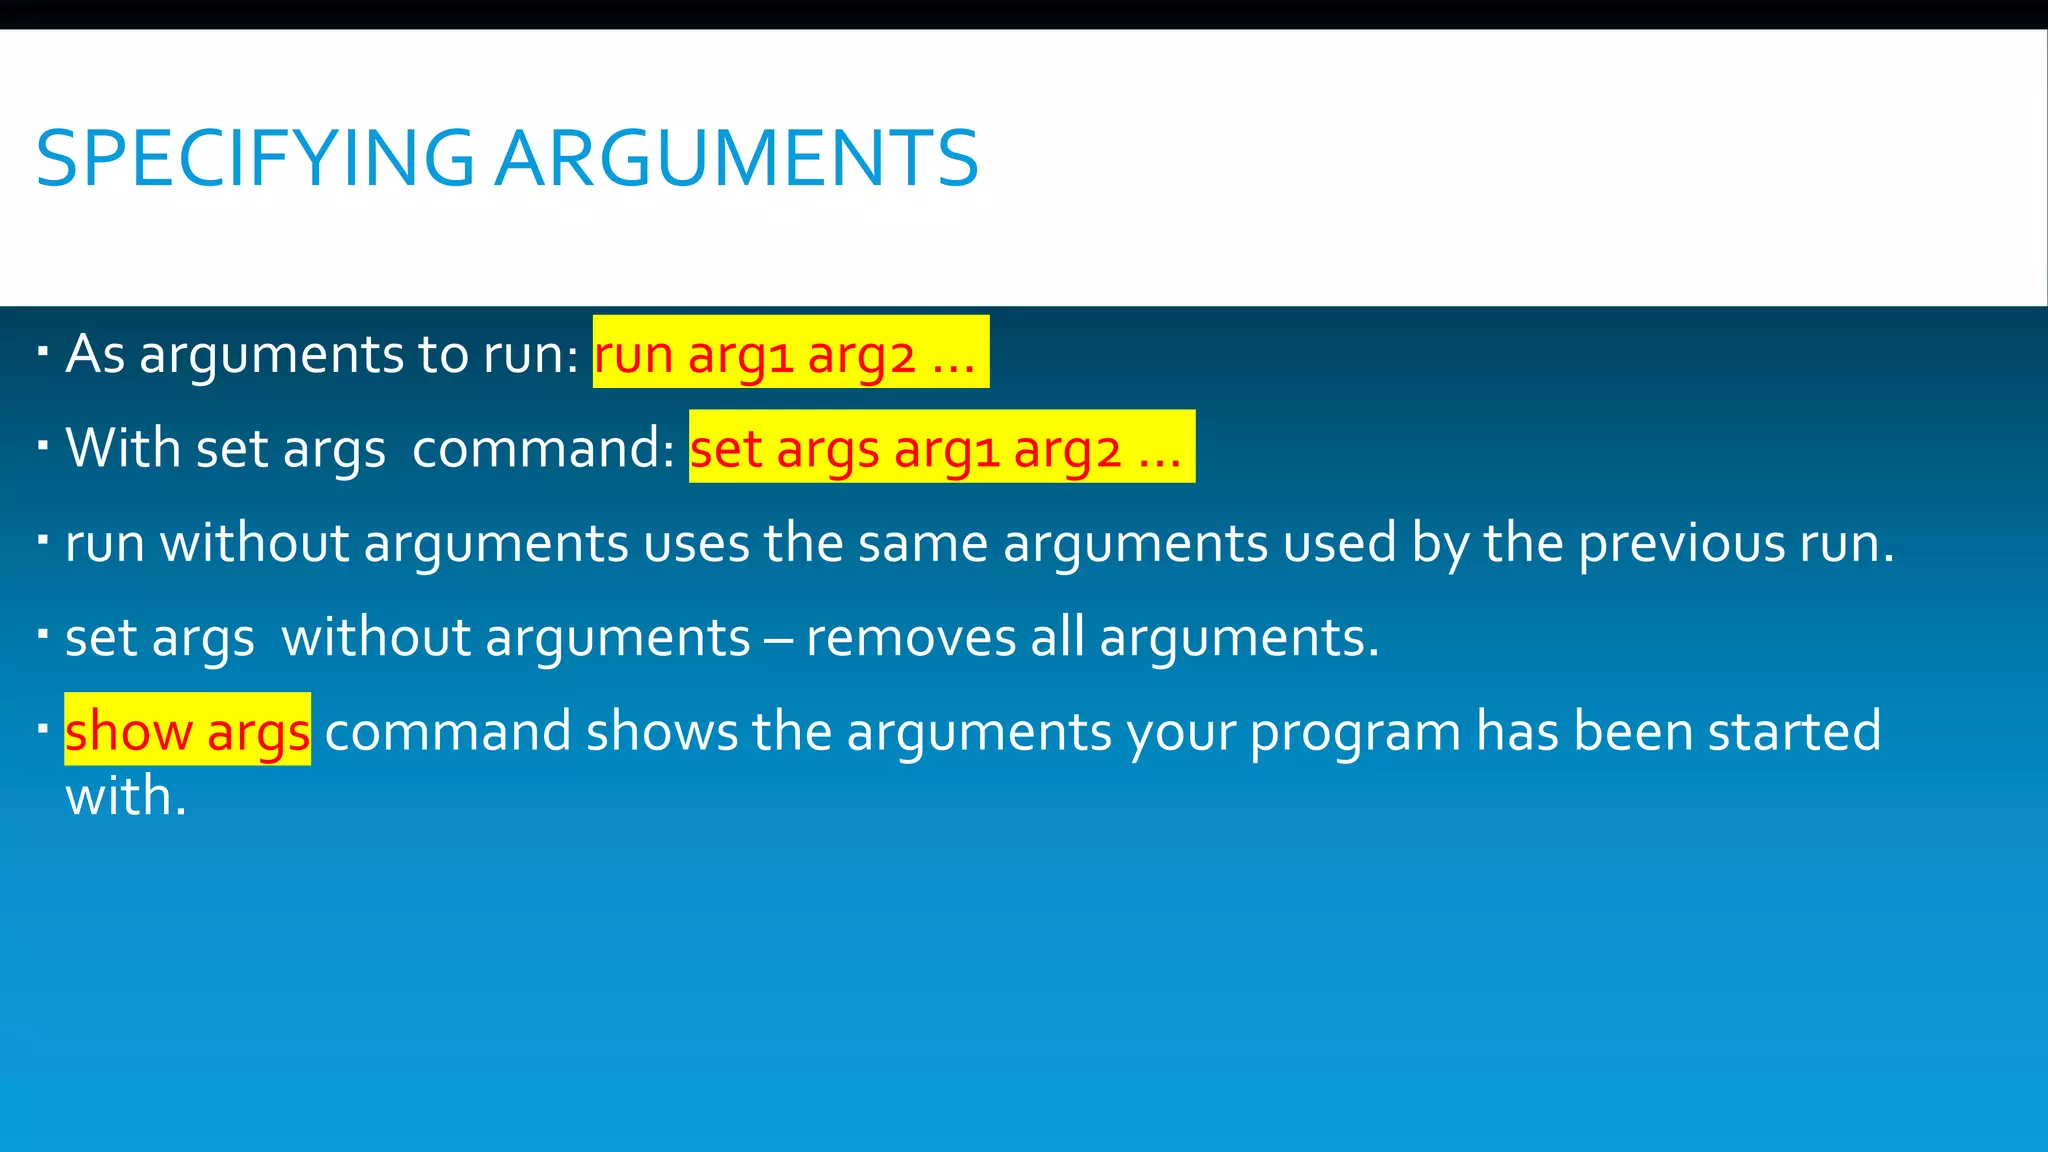
SPECIFYING ARGUMENTS  As arguments to run: run arg1 arg2 …  With set args command: set args arg1 arg2 …  run without arguments uses the same arguments used by the previous run.  set args without arguments – removes all arguments.  show args command shows the arguments your program has been started with.
DEBUGGING AN ALREADY-RUNNING PROCESS  From inside GDB: attach process-id  Tip: UNIX command ps can be used to obtain the process id  From outside GDB: gdb my_prog process-id  The first thing GDB does after arranging to debug the specified process is to stop it.  detach – detaches the currently attached process from the GDB control.  Detached process continues its own execution.
KILLINGTHE INFERIOR PROCESS  Kill - Kill the child process in which your program is running under gdb.  Useful if you wish to recompile and relink your program, since on many systems it is impossible to modify an executable file while it is running in a process.  In this case, when you next type run, gdb notices that the file has changed, and reads the symbol table again (while trying to preserve your current breakpoint settings).
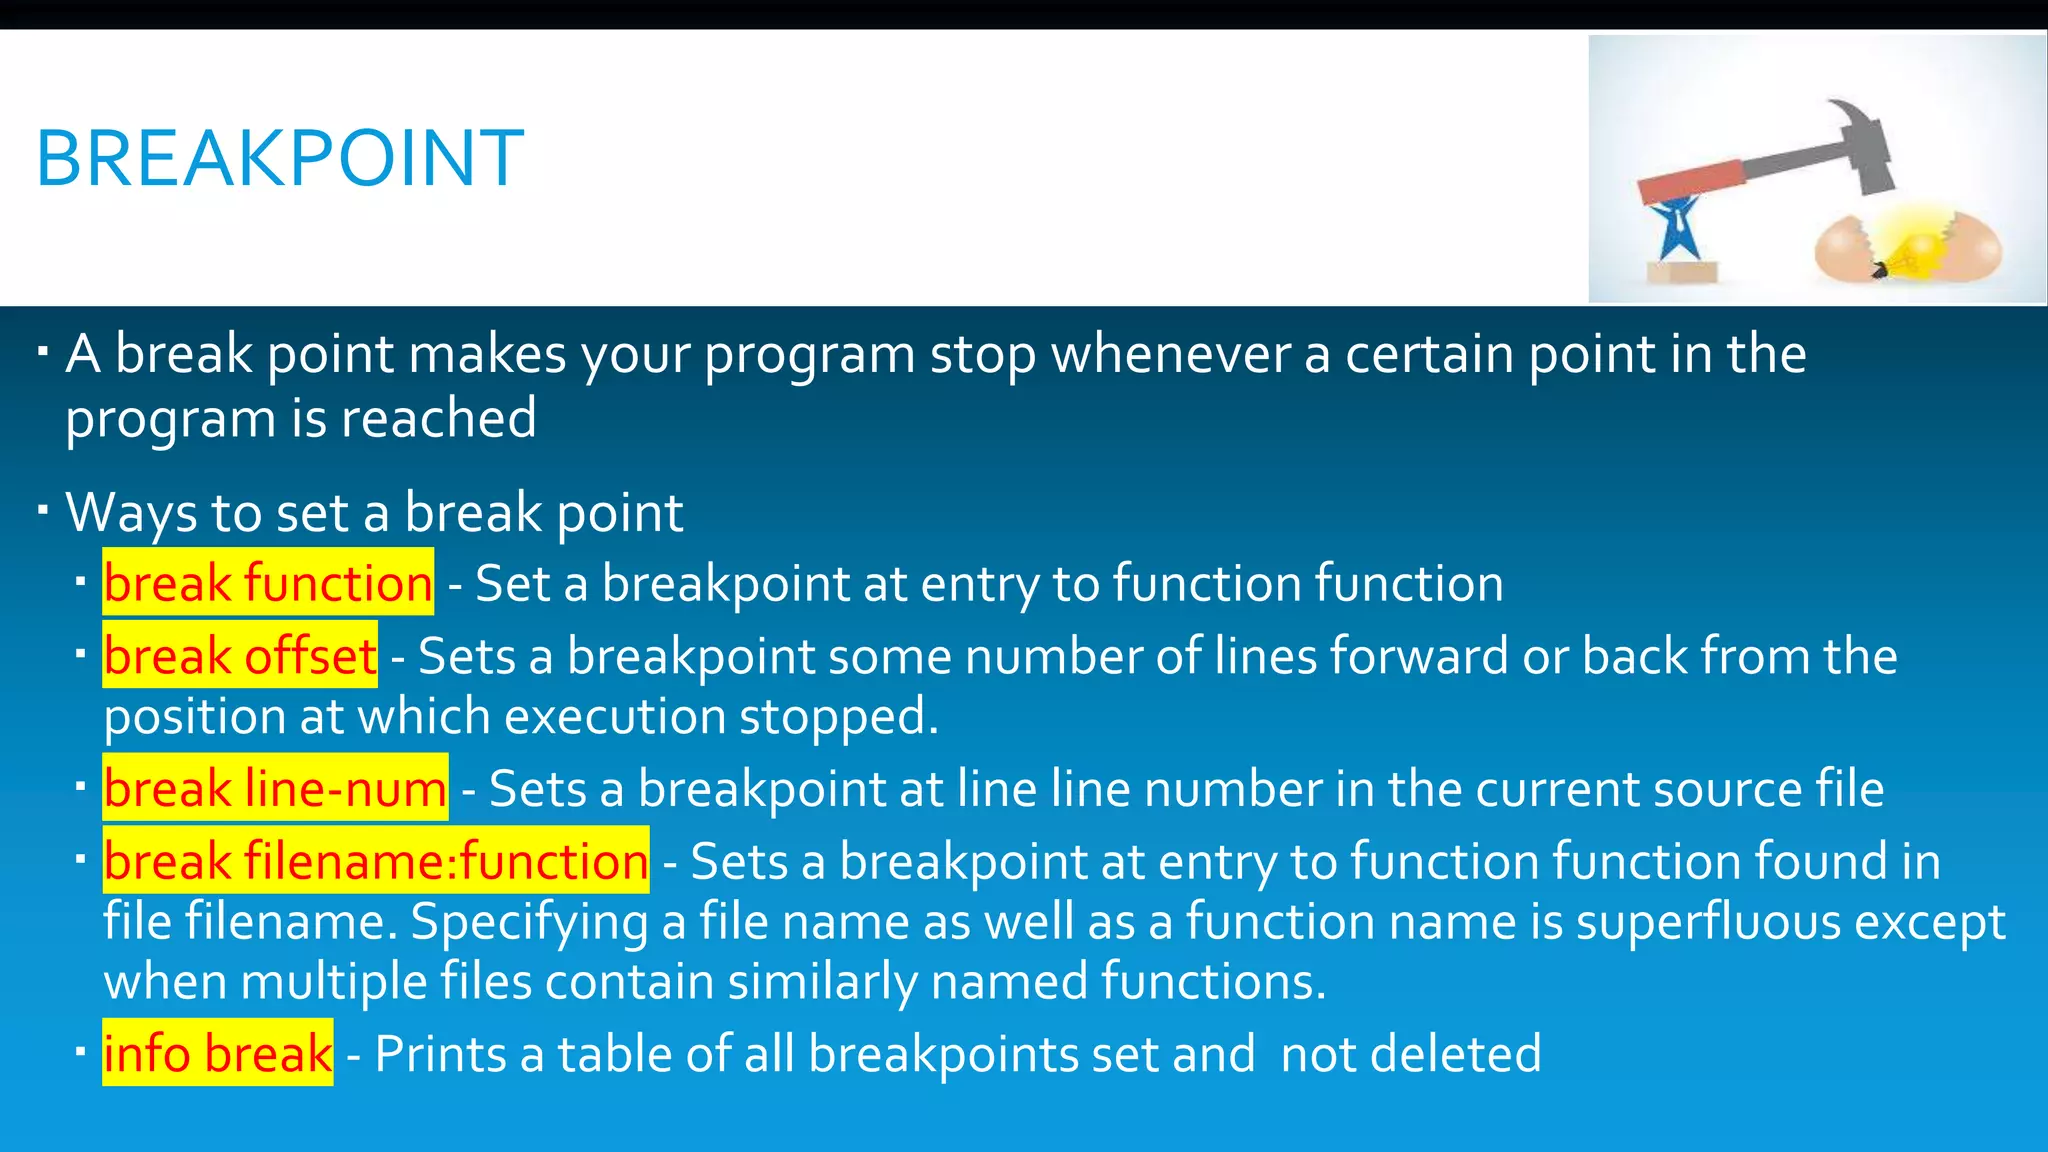
BREAKPOINT  A break point makes your program stop whenever a certain point in the program is reached  Ways to set a break point  break function - Set a breakpoint at entry to function function  break offset - Sets a breakpoint some number of lines forward or back from the position at which execution stopped.  break line-num - Sets a breakpoint at line line number in the current source file  break filename:function - Sets a breakpoint at entry to function function found in file filename. Specifying a file name as well as a function name is superfluous except when multiple files contain similarly named functions.  info break - Prints a table of all breakpoints set and not deleted
WATCHPOINT  A watch point is a special breakpoint that stops your program when the value of an expression changes  Ways to set a watch point  watch expr - Sets a watchpoint for an expression.  info watchpoints - Prints a table of all watch points set and not deleted
ELIMINATE - BREAKPOINTS ANDWATCHPOINTS  Eliminate a breakpoint or watchpoint once it has done its job and you no longer want your program to stop there.  Based on Location  clear - Delete any breakpoints at the next instruction to be executed in the selected stack frame.  clear function, clear filename:function - Delete any breakpoints set at entry to the function function.  clear linenum, clear filename:linenum - Delete any breakpoints set at or within the code of the specified line.  Based on number  delete [breakpoints] [range...] - Delete the breakpoints or watchpoints of the breakpoint ranges specified as arguments.  If no argument is specified, delete all breakpoints
EXAMININGVARIABLES  Global variables can be examined from every point in the source file.  Local variables – can be examined only in their scope or using:  var - file::variable or function::variable  The variable type: ptype var  Current value: print var  Automatic display:  display var - adds var to the automatic display list.  undisplay dnum - Removes var from the automatic display list.  Specifying the output format (x, o, d, u, t, a, f, and c) :  print /t var - prints the value of var in binary format
STEPPINGTHROUGHTHE PROGRAM  step [count] – program execution continue to next source line going into function calls.  next [count] – program execution continue to the next source line omitting function calls.  continue [ignore-count] – resume program execution  ignore-count allows you to specify a further number of times to ignore a breakpoint at this location  until – continue until the next source line in the current stack frame is reached.  useful to exit from loops count - times step into function; next statement
ALTERING EXECUTION  Returning from a function  finish - forced return  return [ret_value] – pops the current stack frame  Continuing at different address: jump line_num|*address  Altering the value of a variable: set <var> = <value>  Proceeding to a specified point: until [line_num|*address |function_name]  call <function(args)> – Invokes the function
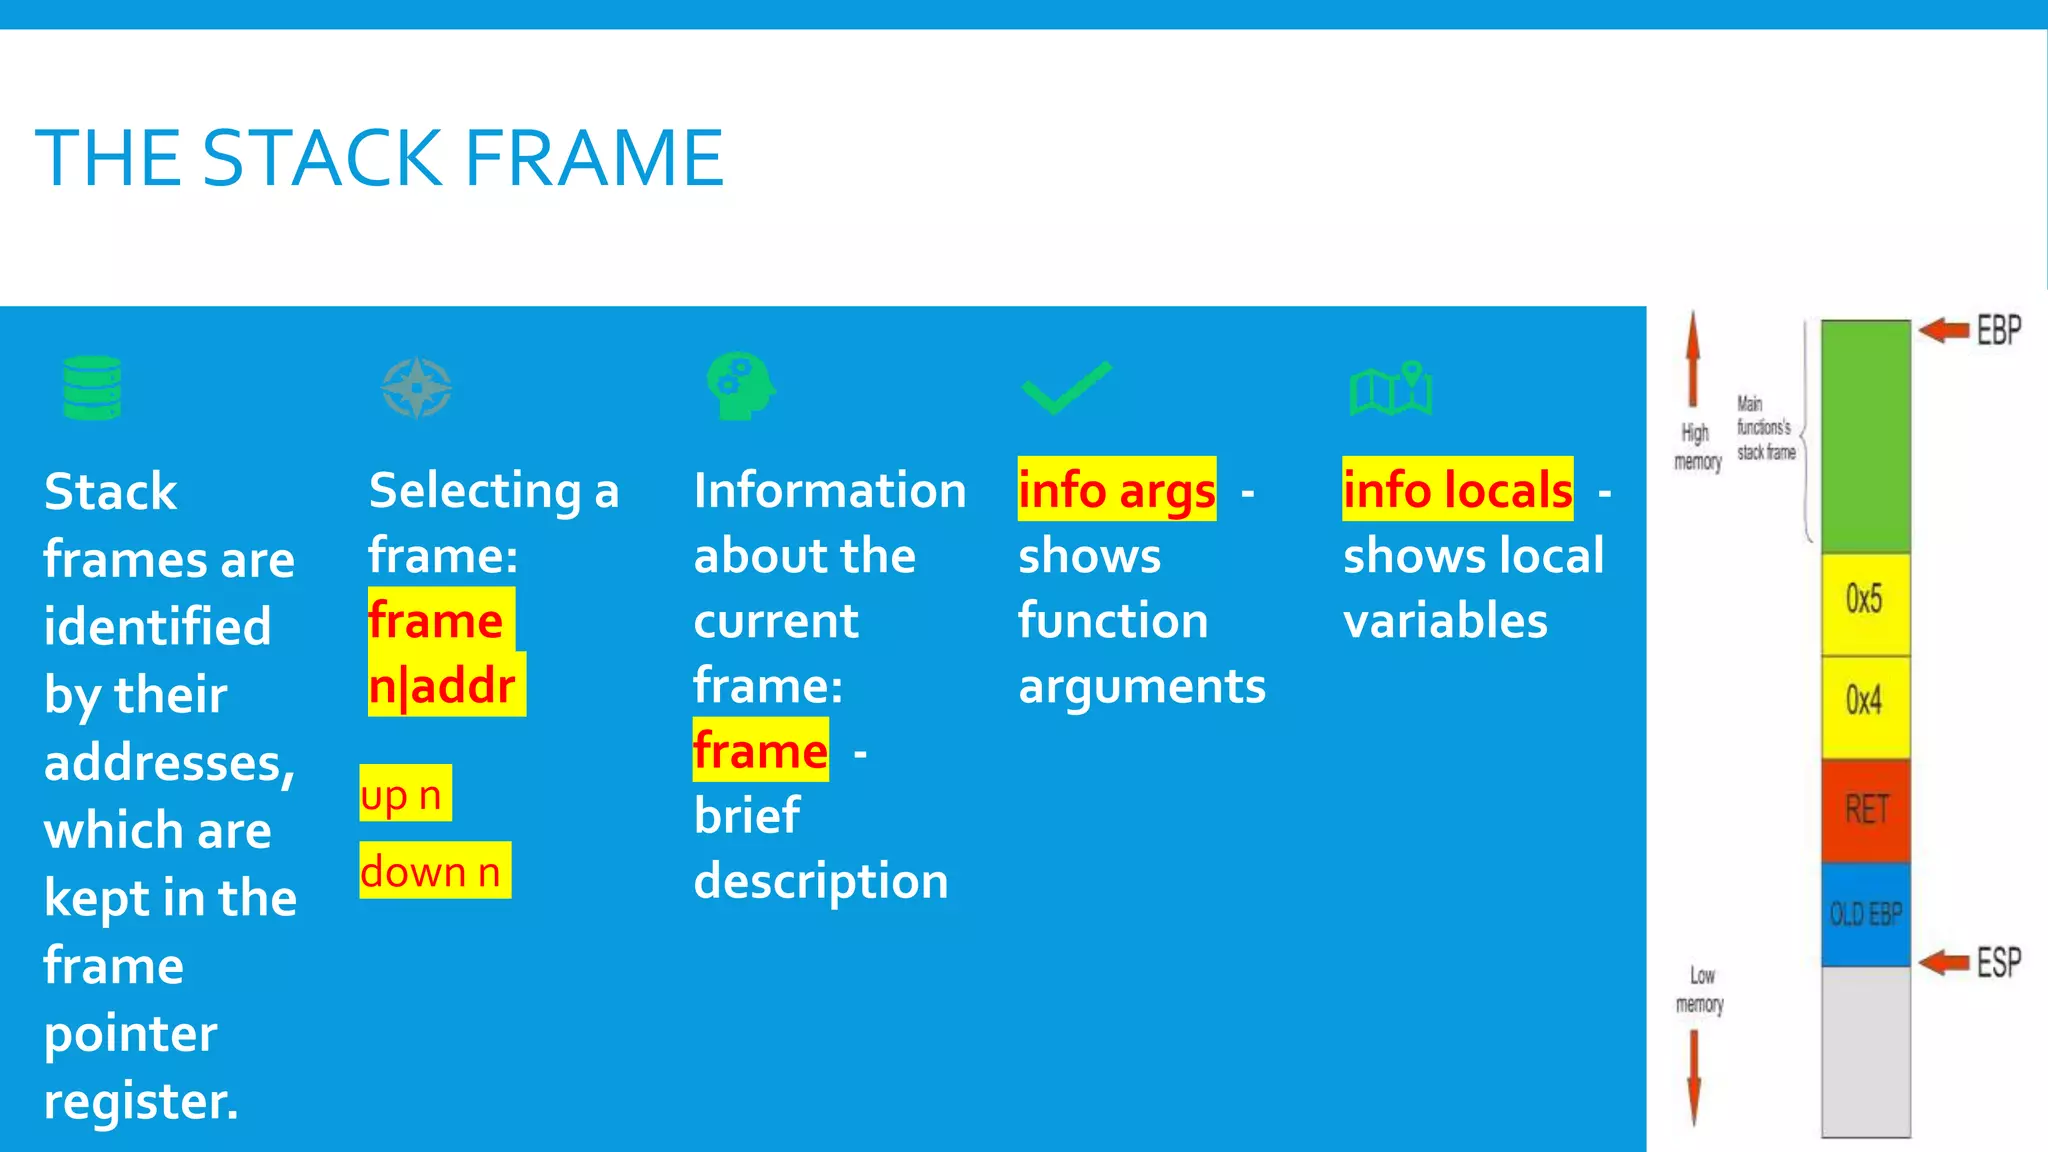
Stack frames are identified by their addresses, which are kept in the frame pointer register. Selecting a frame: frame n|addr up n down n Information about the current frame: frame - brief description info args - shows function arguments info locals - shows local variables THE STACK FRAME
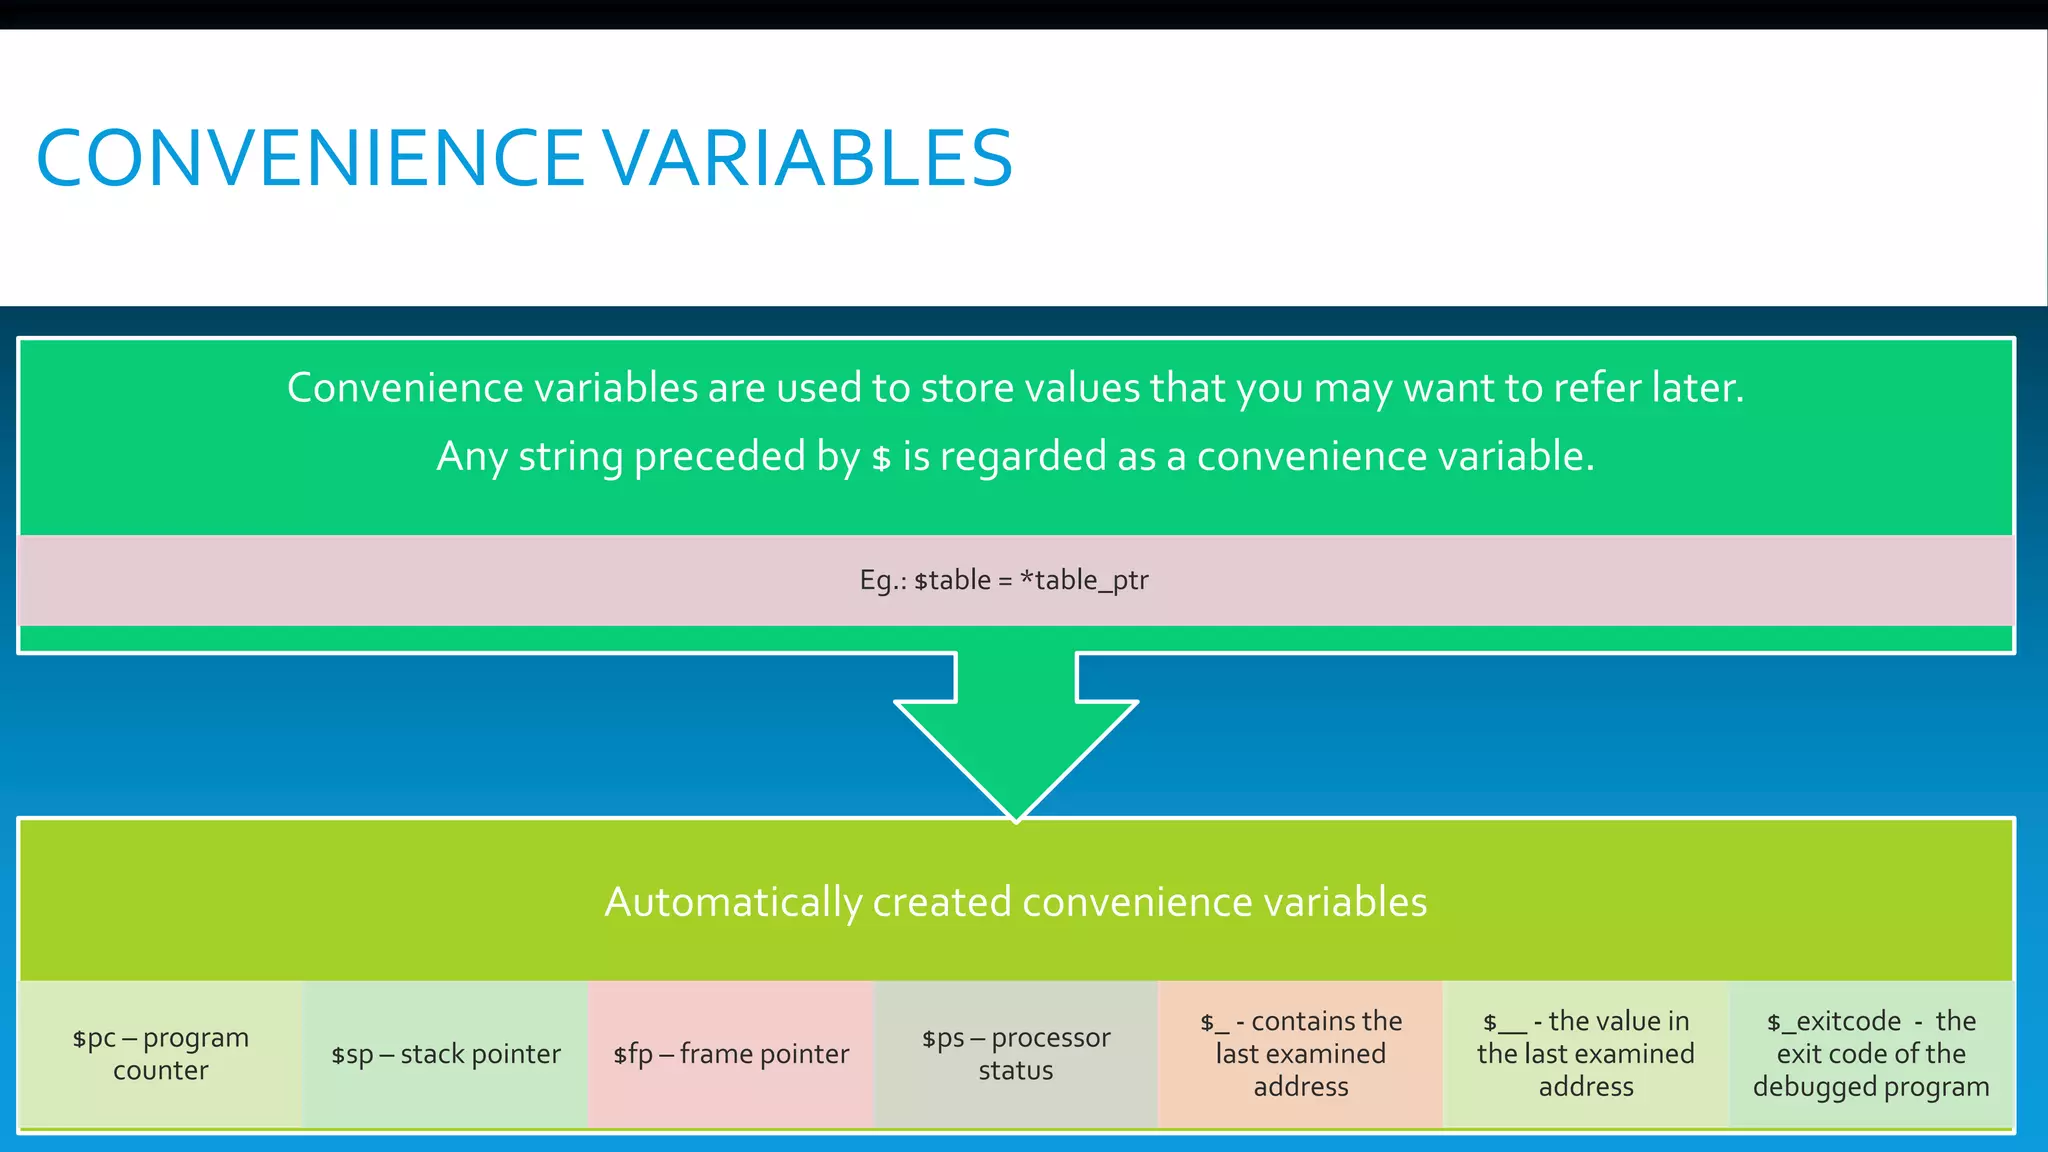
CONVENIENCEVARIABLES Automatically created convenience variables $pc – program counter $sp – stack pointer $fp – frame pointer $ps – processor status $_ - contains the last examined address $__ - the value in the last examined address $_exitcode - the exit code of the debugged program Convenience variables are used to store values that you may want to refer later. Any string preceded by $ is regarded as a convenience variable. Eg.: $table = *table_ptr
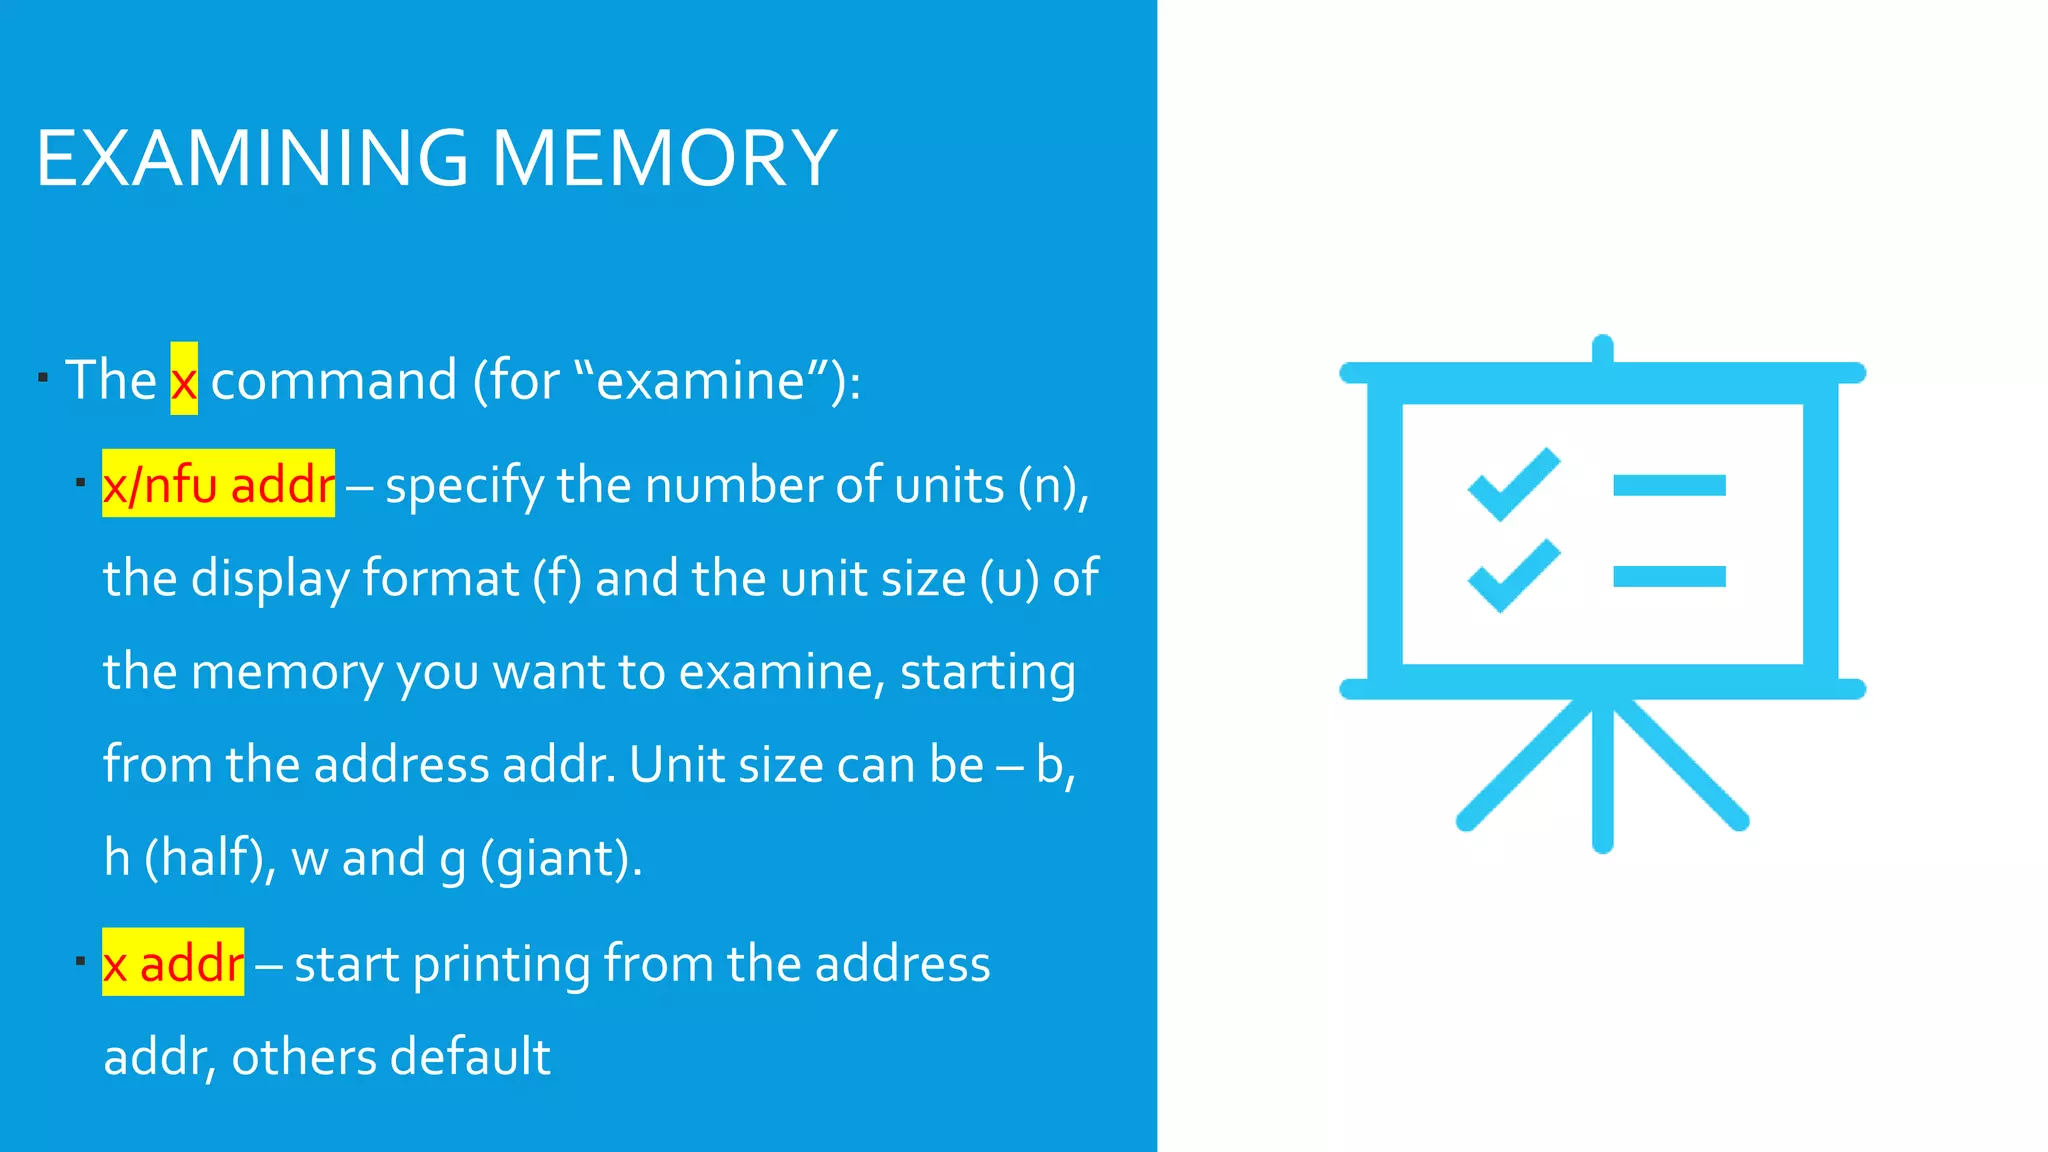
 The x command (for “examine”):  x/nfu addr – specify the number of units (n), the display format (f) and the unit size (u) of the memory you want to examine, starting from the address addr. Unit size can be – b, h (half), w and g (giant).  x addr – start printing from the address addr, others default EXAMINING MEMORY
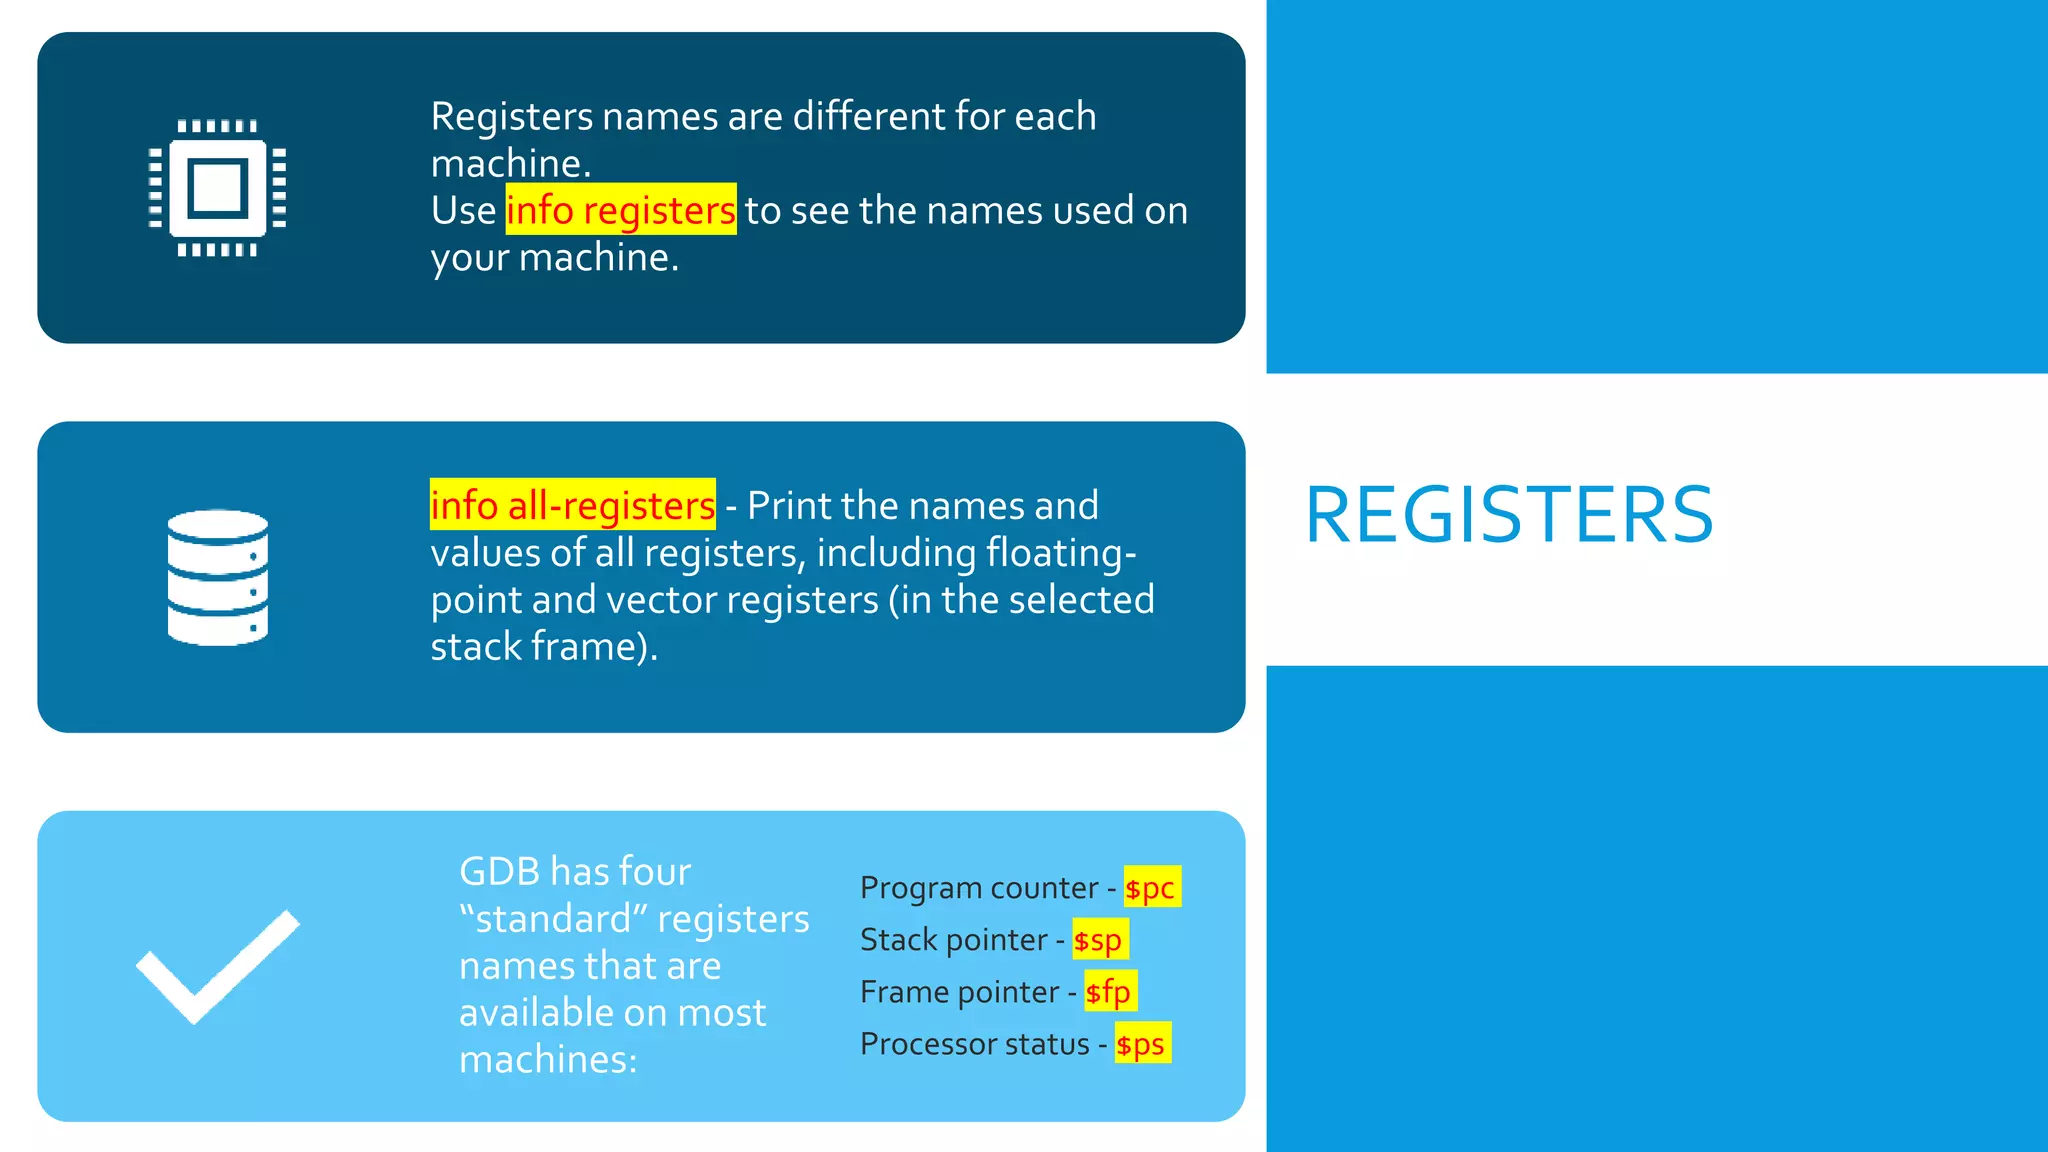
REGISTERS Registers names are different for each machine. Use info registers to see the names used on your machine. info all-registers - Print the names and values of all registers, including floating- point and vector registers (in the selected stack frame). GDB has four “standard” registers names that are available on most machines: Program counter - $pc Stack pointer - $sp Frame pointer - $fp Processor status - $ps
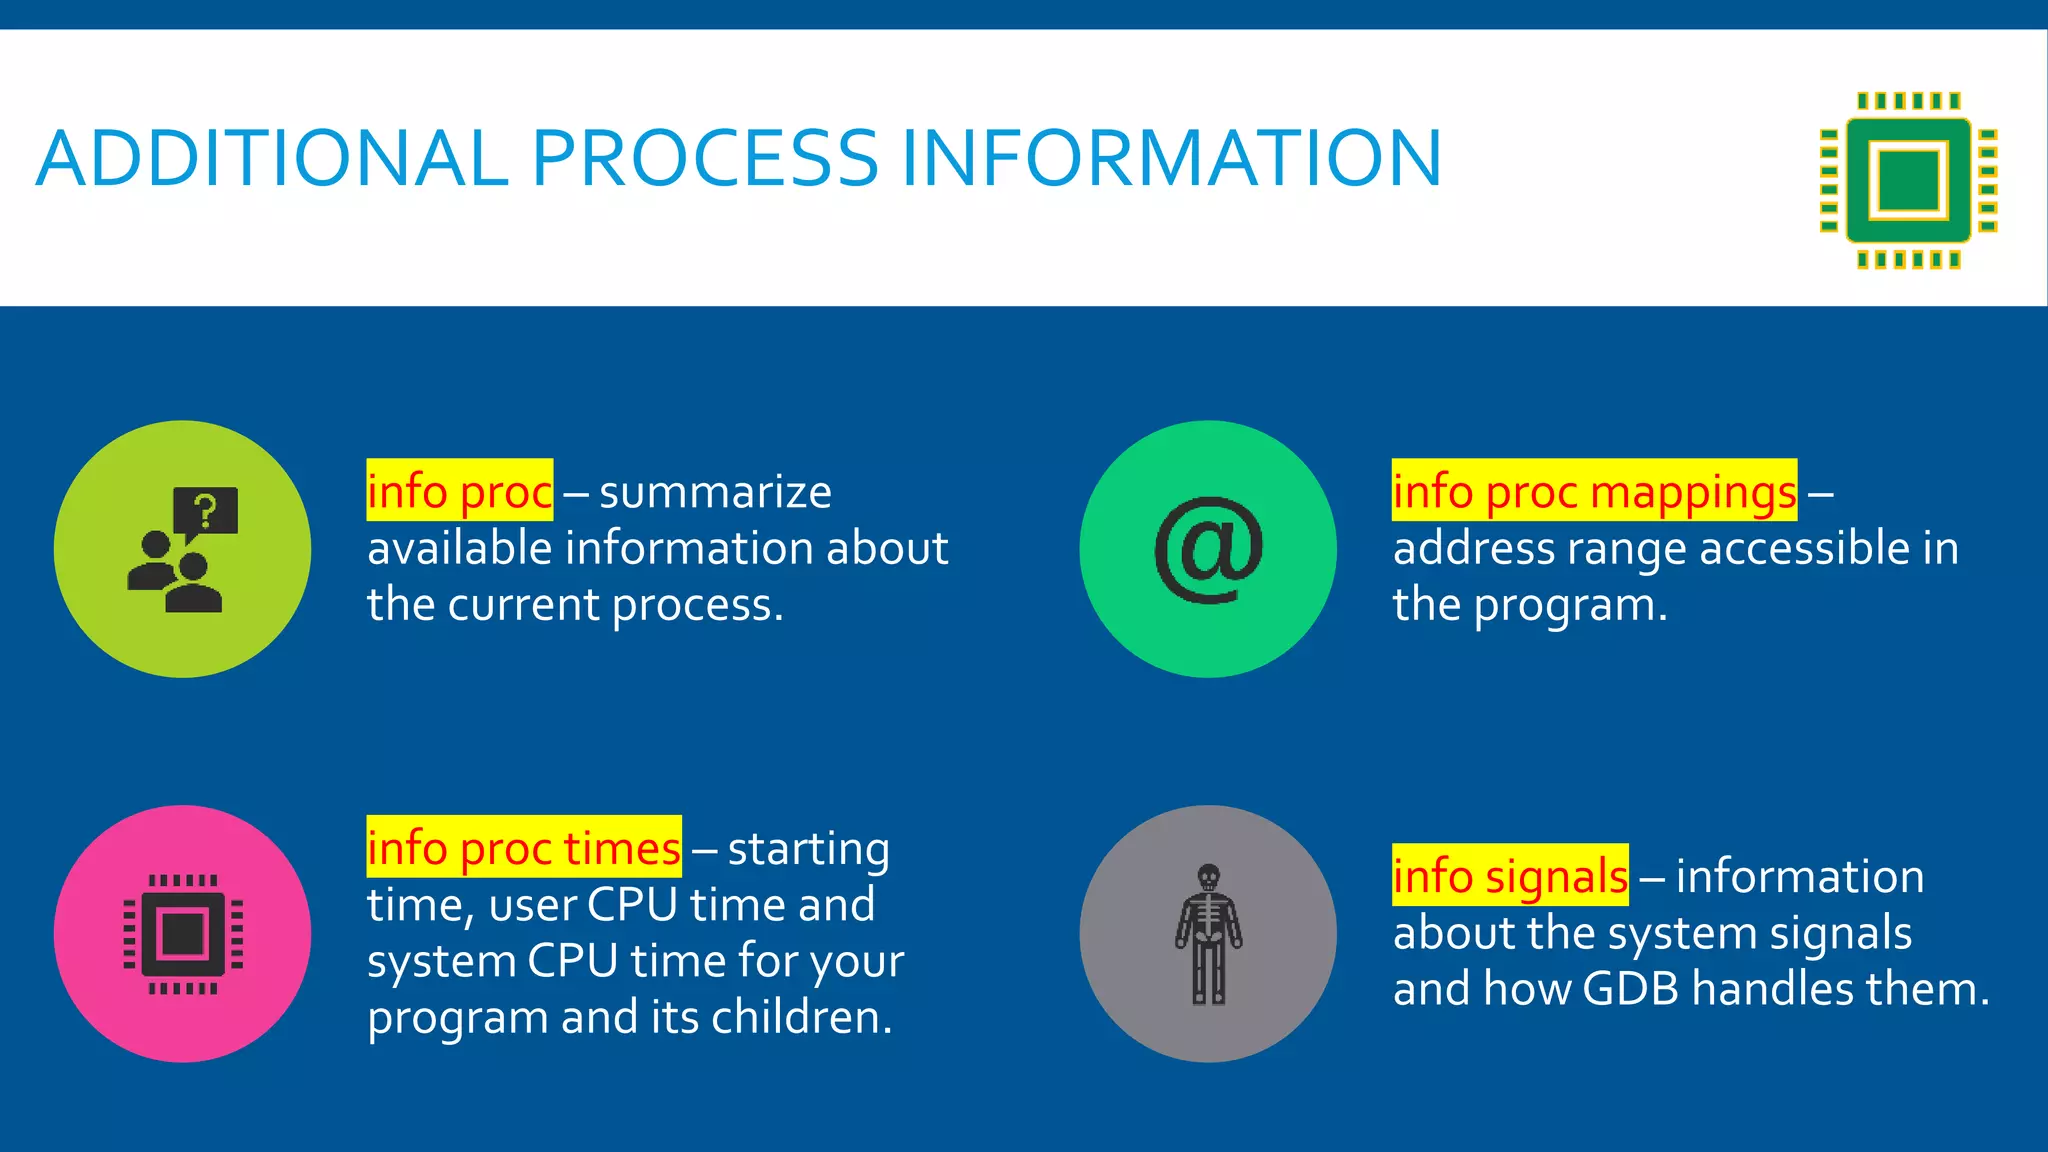
info proc – summarize available information about the current process. info proc mappings – address range accessible in the program. info proc times – starting time, user CPU time and system CPU time for your program and its children. info signals – information about the system signals and how GDB handles them. ADDITIONAL PROCESS INFORMATION
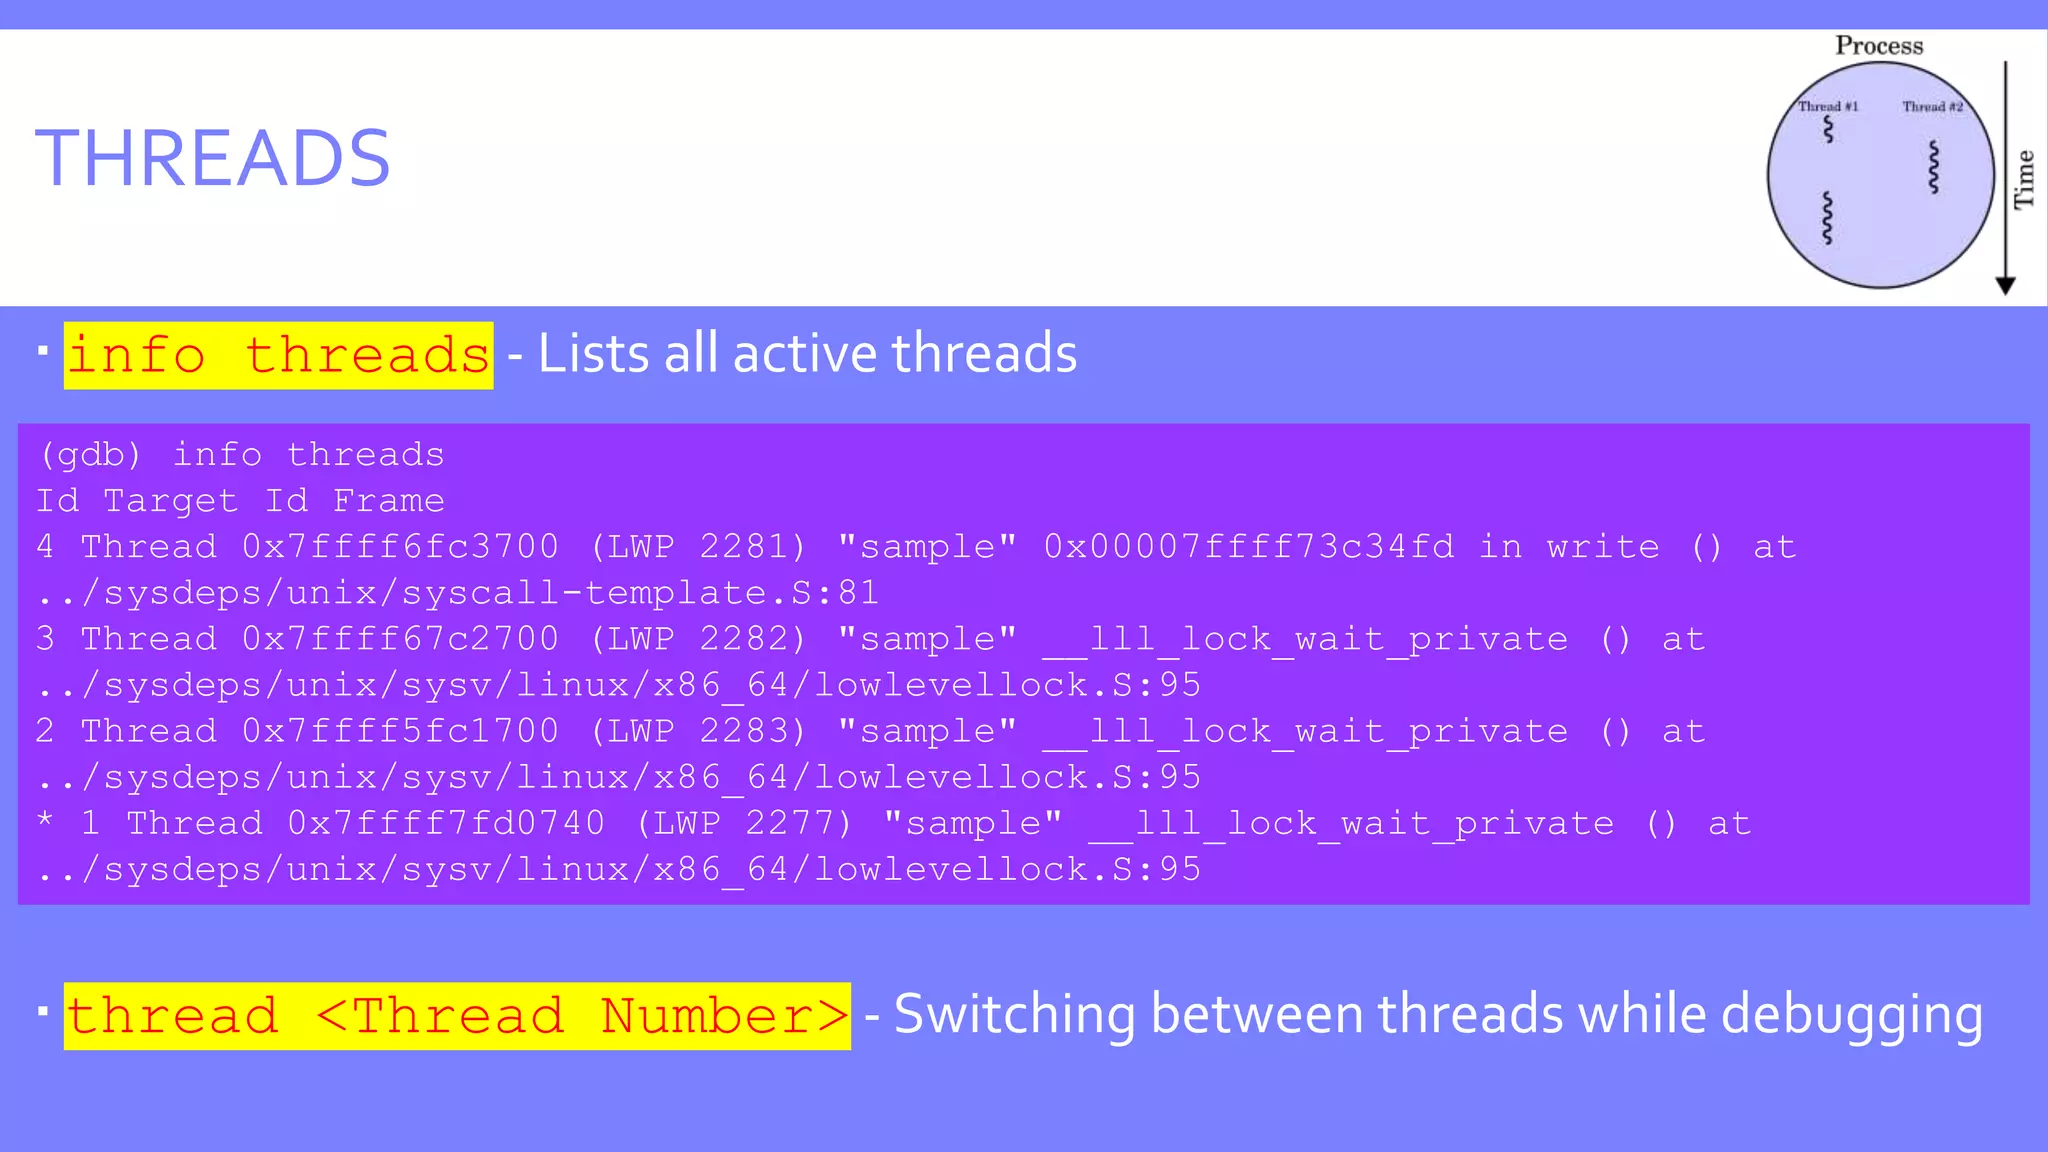
THREADS  info threads - Lists all active threads  thread <Thread Number> - Switching between threads while debugging (gdb) info threads Id Target Id Frame 4 Thread 0x7ffff6fc3700 (LWP 2281) "sample" 0x00007ffff73c34fd in write () at ../sysdeps/unix/syscall-template.S:81 3 Thread 0x7ffff67c2700 (LWP 2282) "sample" __lll_lock_wait_private () at ../sysdeps/unix/sysv/linux/x86_64/lowlevellock.S:95 2 Thread 0x7ffff5fc1700 (LWP 2283) "sample" __lll_lock_wait_private () at ../sysdeps/unix/sysv/linux/x86_64/lowlevellock.S:95 * 1 Thread 0x7ffff7fd0740 (LWP 2277) "sample" __lll_lock_wait_private () at ../sysdeps/unix/sysv/linux/x86_64/lowlevellock.S:95
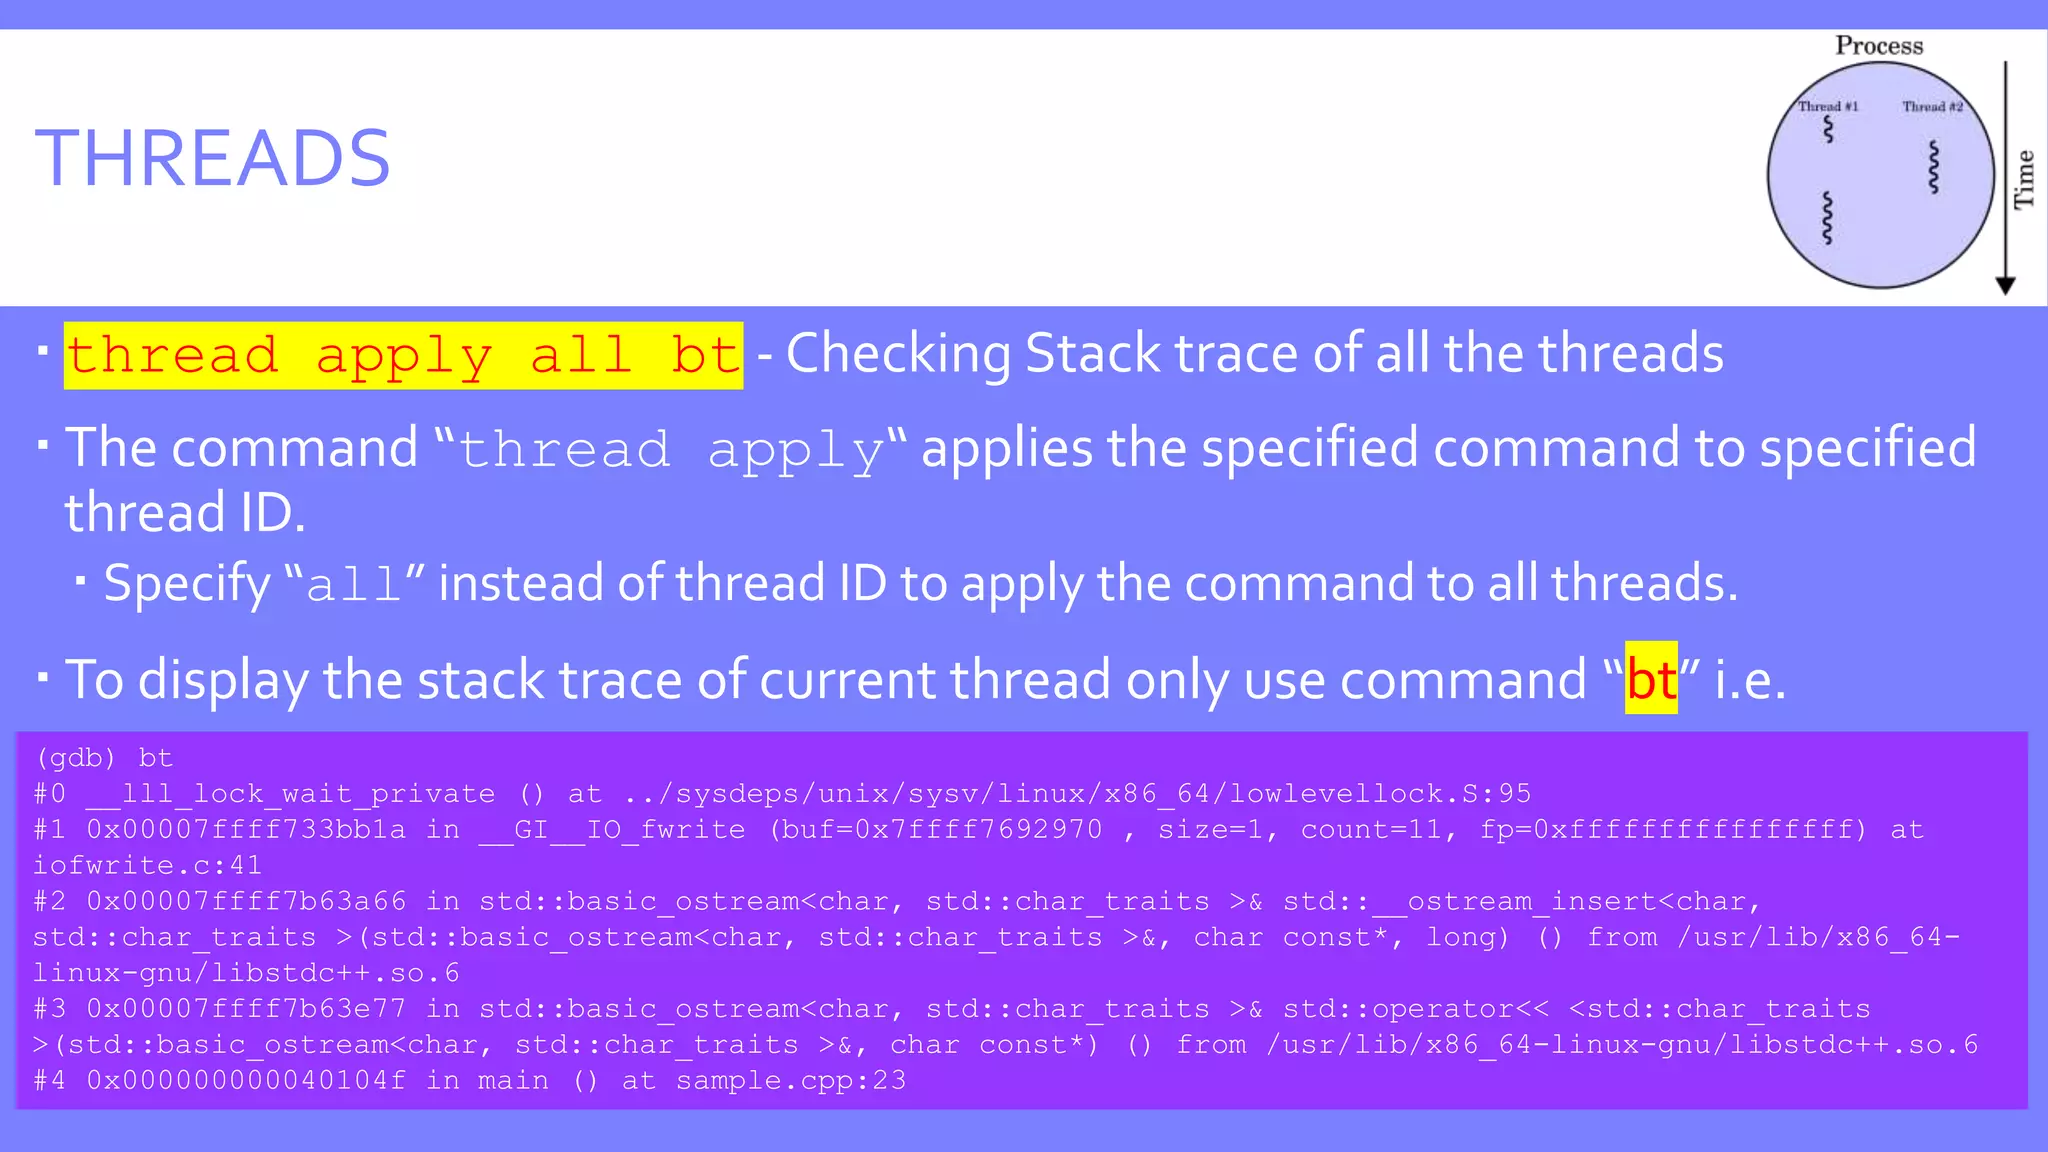
THREADS  thread apply all bt - Checking Stack trace of all the threads  The command “thread apply“ applies the specified command to specified thread ID.  Specify “all” instead of thread ID to apply the command to all threads.  To display the stack trace of current thread only use command “bt” i.e. (gdb) bt #0 __lll_lock_wait_private () at ../sysdeps/unix/sysv/linux/x86_64/lowlevellock.S:95 #1 0x00007ffff733bb1a in __GI__IO_fwrite (buf=0x7ffff7692970 , size=1, count=11, fp=0xffffffffffffffff) at iofwrite.c:41 #2 0x00007ffff7b63a66 in std::basic_ostream<char, std::char_traits >& std::__ostream_insert<char, std::char_traits >(std::basic_ostream<char, std::char_traits >&, char const*, long) () from /usr/lib/x86_64- linux-gnu/libstdc++.so.6 #3 0x00007ffff7b63e77 in std::basic_ostream<char, std::char_traits >& std::operator<< <std::char_traits >(std::basic_ostream<char, std::char_traits >&, char const*) () from /usr/lib/x86_64-linux-gnu/libstdc++.so.6 #4 0x000000000040104f in main () at sample.cpp:23
POSTMORTEM DEBUGGING – CORE  A core file or core dump is a file that records the memory image of a running process and its process status (register values etc.).  Its primary use is post-mortem debugging of a program that crashed while it ran outside a debugger.  A program that crashes automatically produces a core file, unless this feature is disabled by the user.  Occasionally, you may wish to produce a core file of the program you are debugging in order to preserve a snapshot of its state.  gdb has a special command for that generate-core-file.  gcore [file]  Produce a core dump of the inferior process.The optional argument file specifies  the file name where to put the core dump. If not specified, the file name defaults to ‘core.pid’, where pid is the inferior process ID.
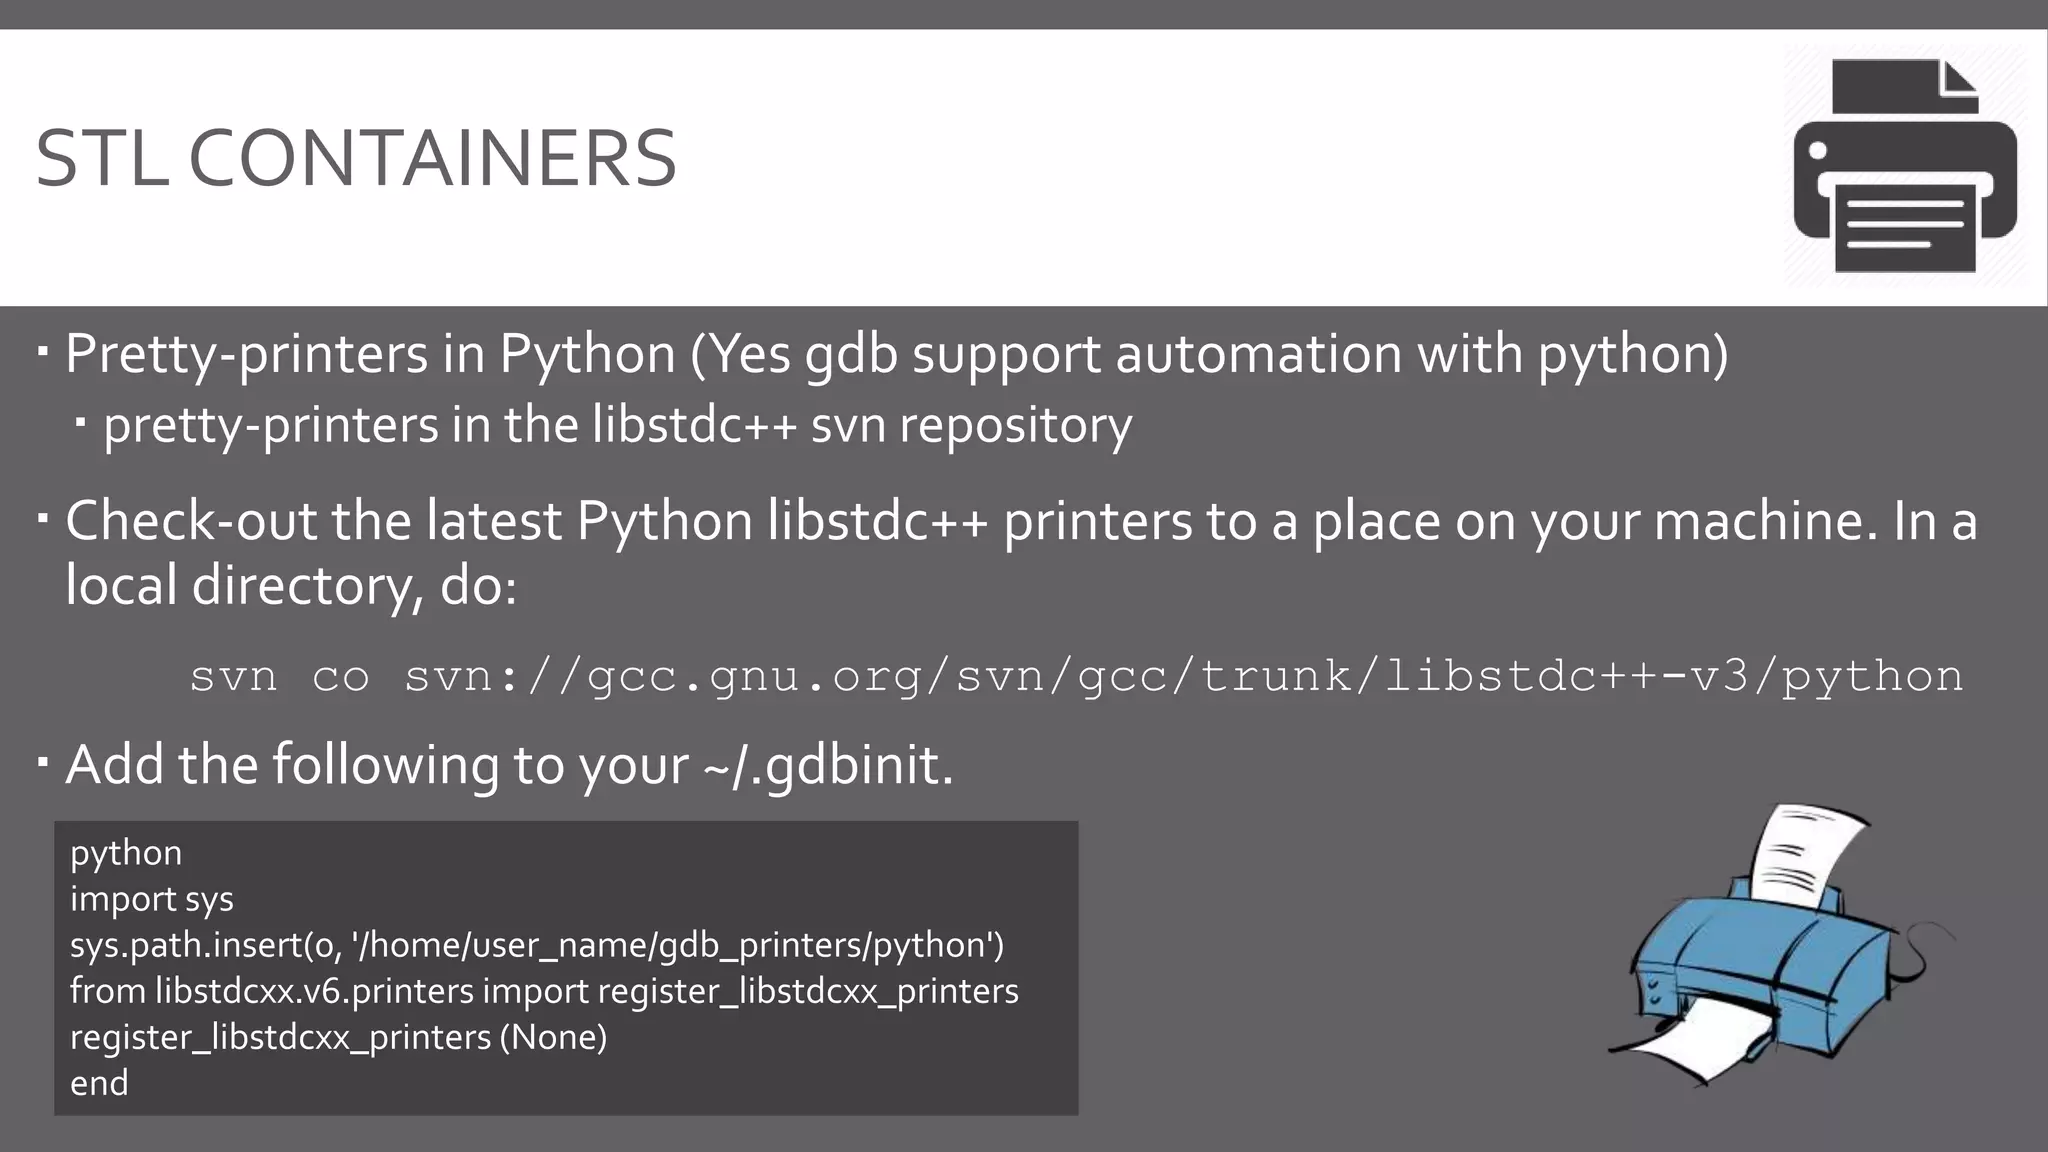
STL CONTAINERS  Pretty-printers in Python (Yes gdb support automation with python)  pretty-printers in the libstdc++ svn repository  Check-out the latest Python libstdc++ printers to a place on your machine. In a local directory, do: svn co svn://gcc.gnu.org/svn/gcc/trunk/libstdc++-v3/python  Add the following to your ~/.gdbinit. python import sys sys.path.insert(0, '/home/user_name/gdb_printers/python') from libstdcxx.v6.printers import register_libstdcxx_printers register_libstdcxx_printers (None) end
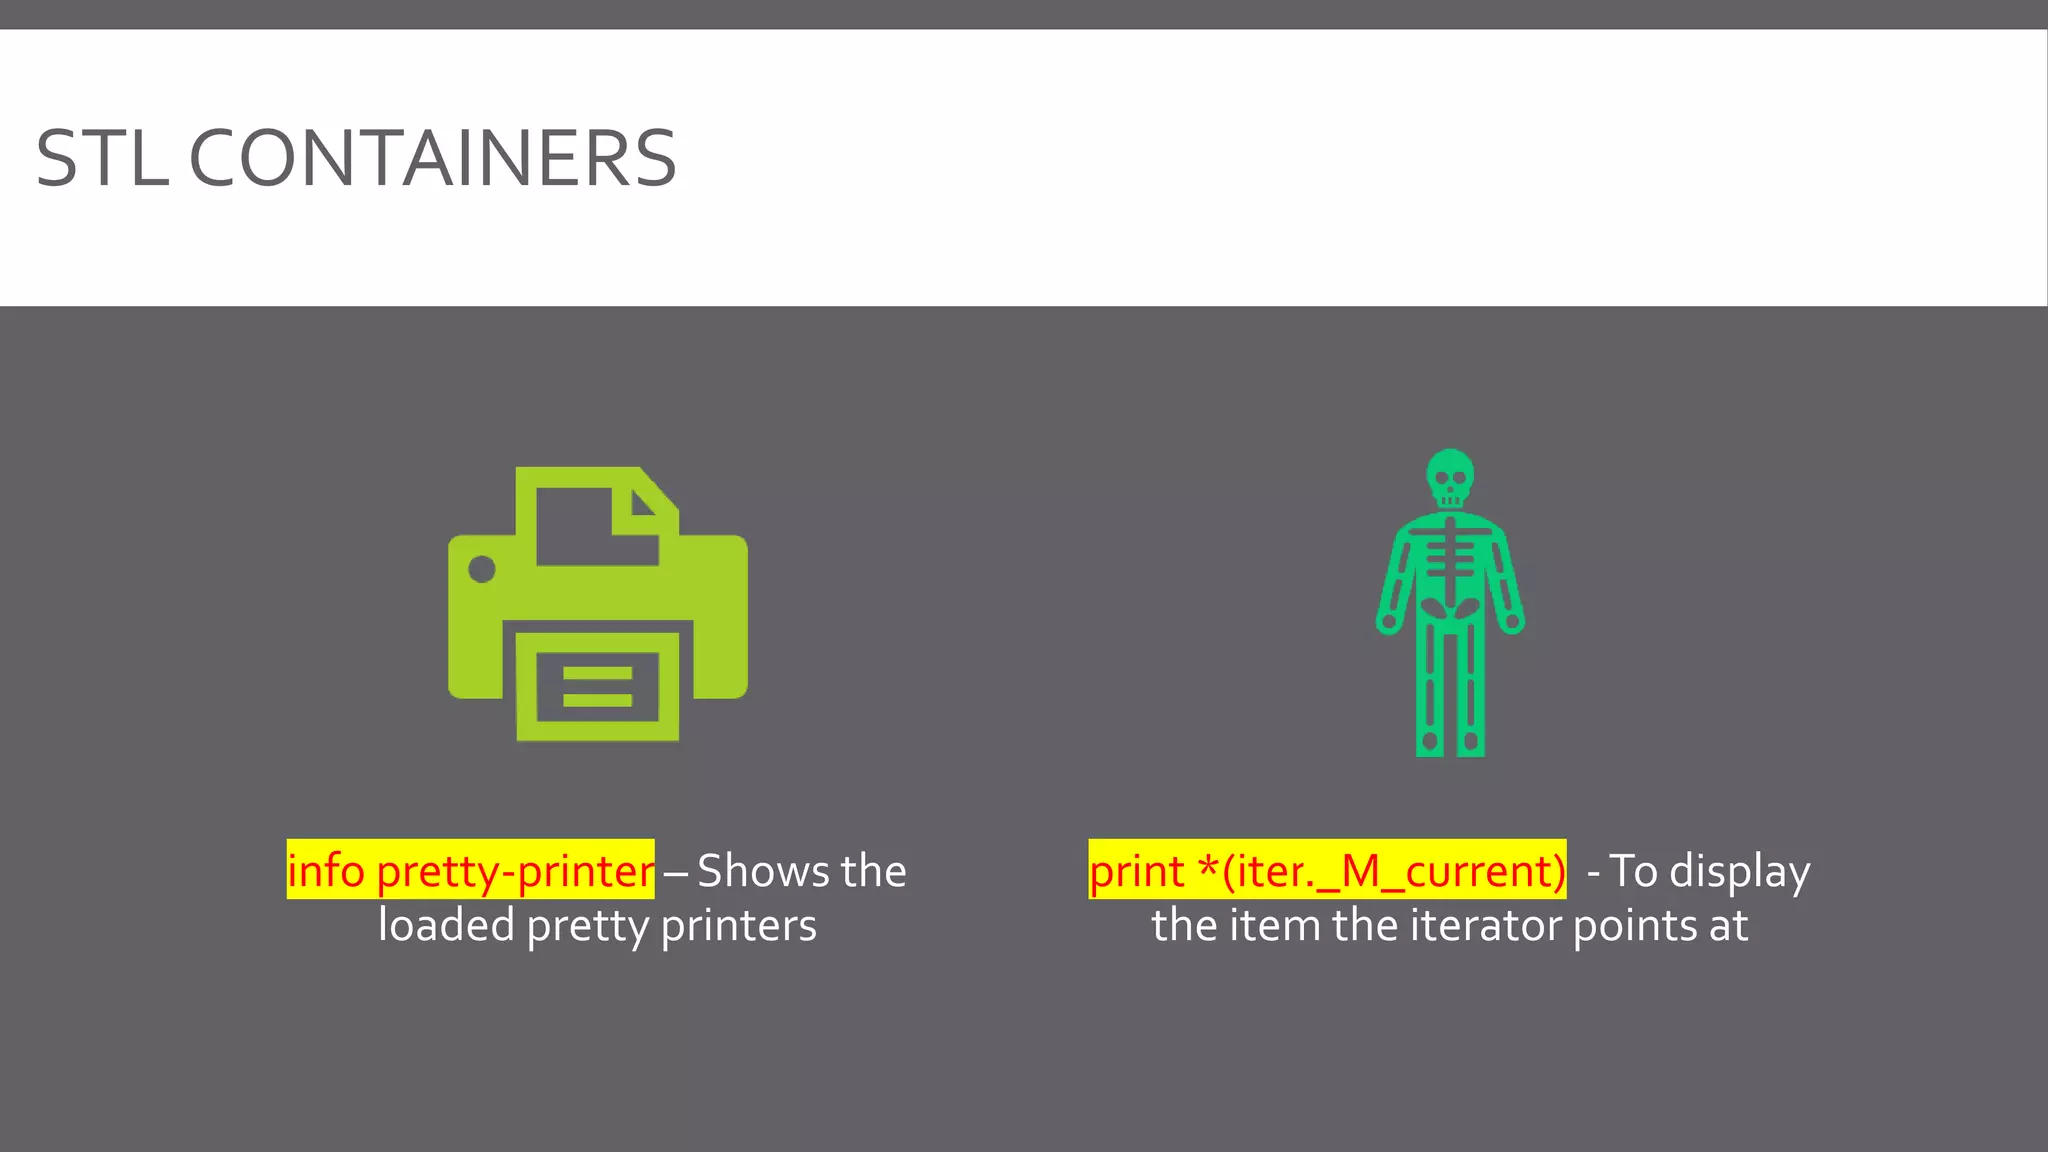
info pretty-printer – Shows the loaded pretty printers print *(iter._M_current) -To display the item the iterator points at STL CONTAINERS
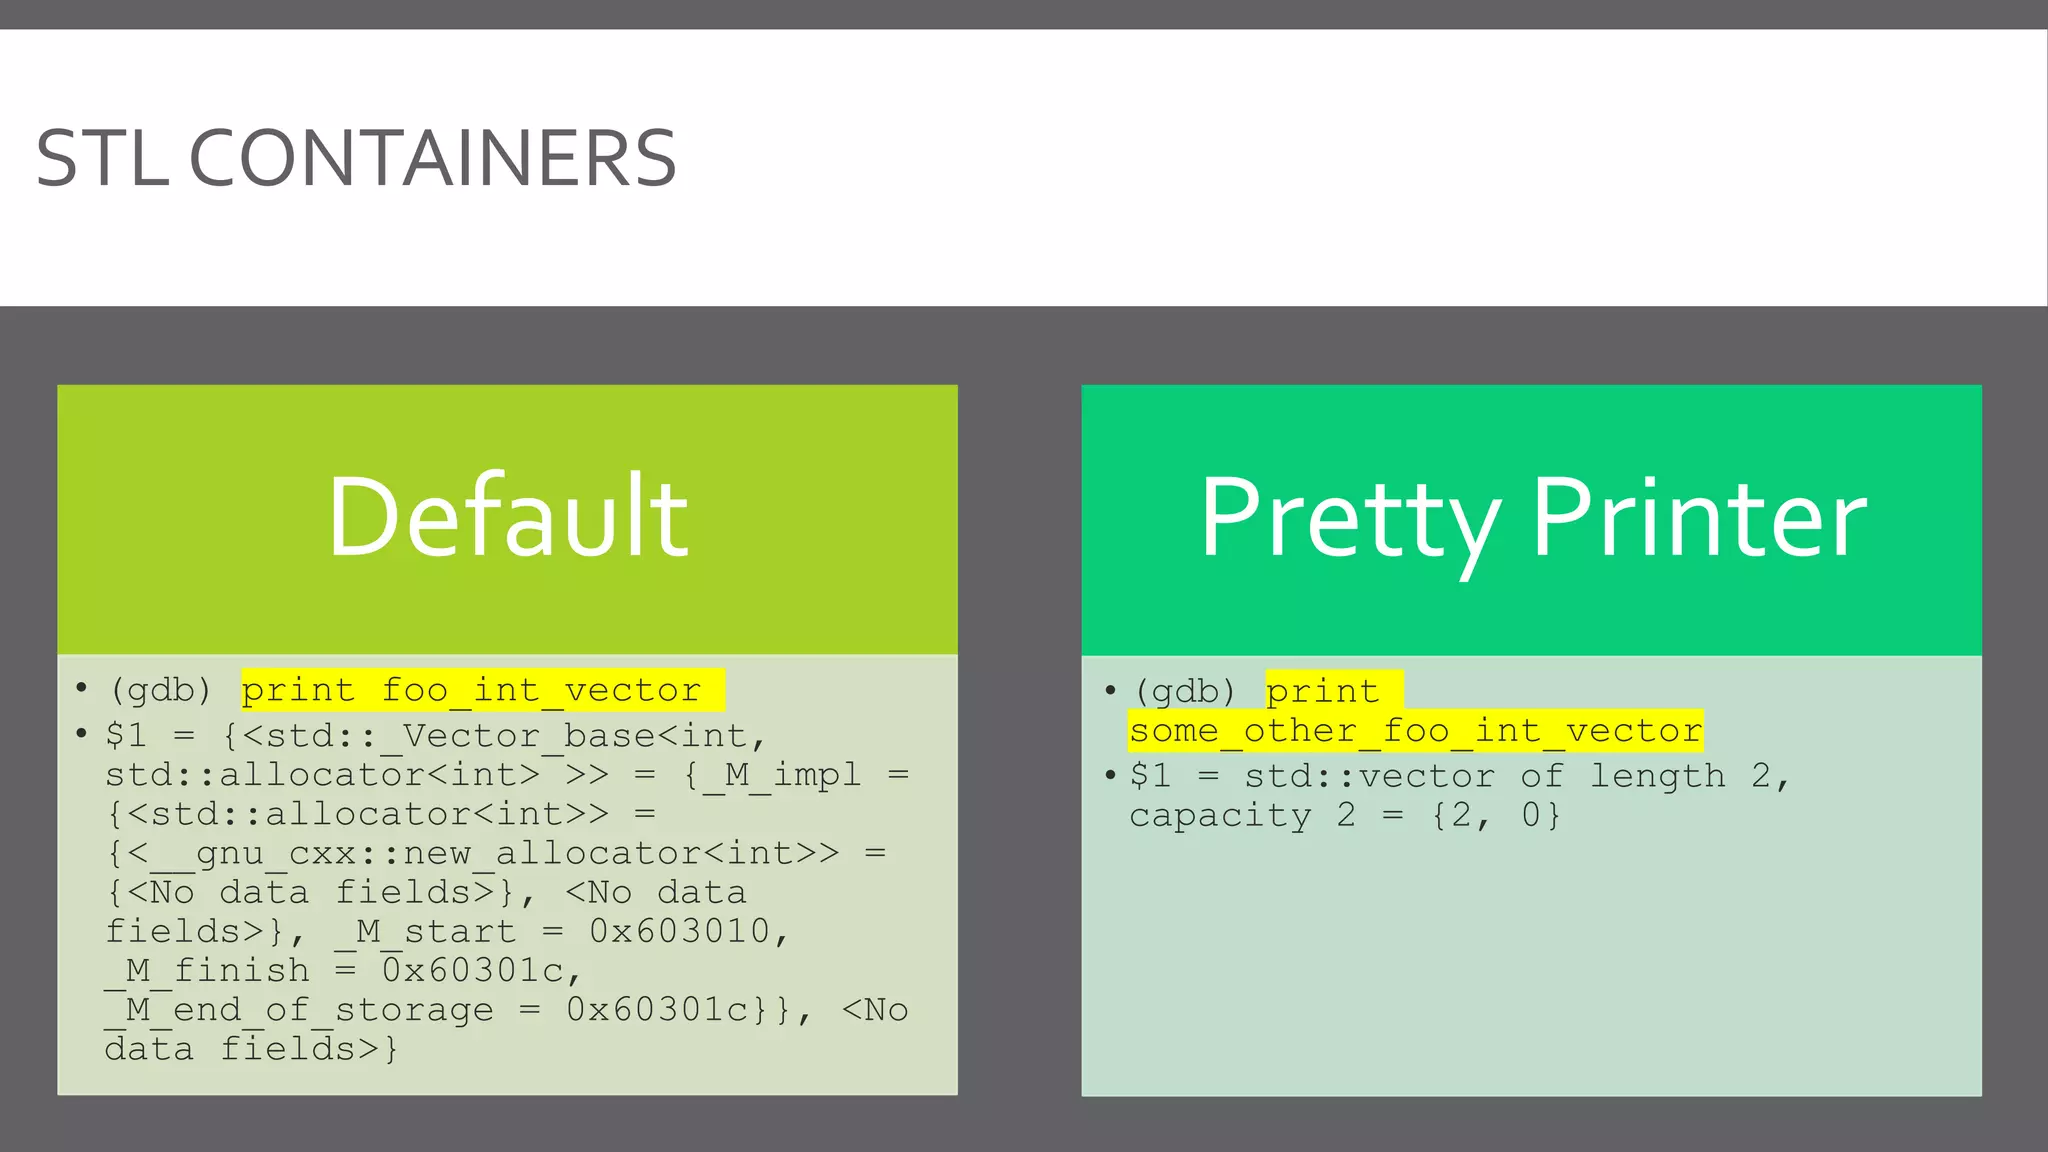
STL CONTAINERS Default • (gdb) print foo_int_vector • $1 = {<std::_Vector_base<int, std::allocator<int> >> = {_M_impl = {<std::allocator<int>> = {<__gnu_cxx::new_allocator<int>> = {<No data fields>}, <No data fields>}, _M_start = 0x603010, _M_finish = 0x60301c, _M_end_of_storage = 0x60301c}}, <No data fields>} Pretty Printer • (gdb) print some_other_foo_int_vector • $1 = std::vector of length 2, capacity 2 = {2, 0}
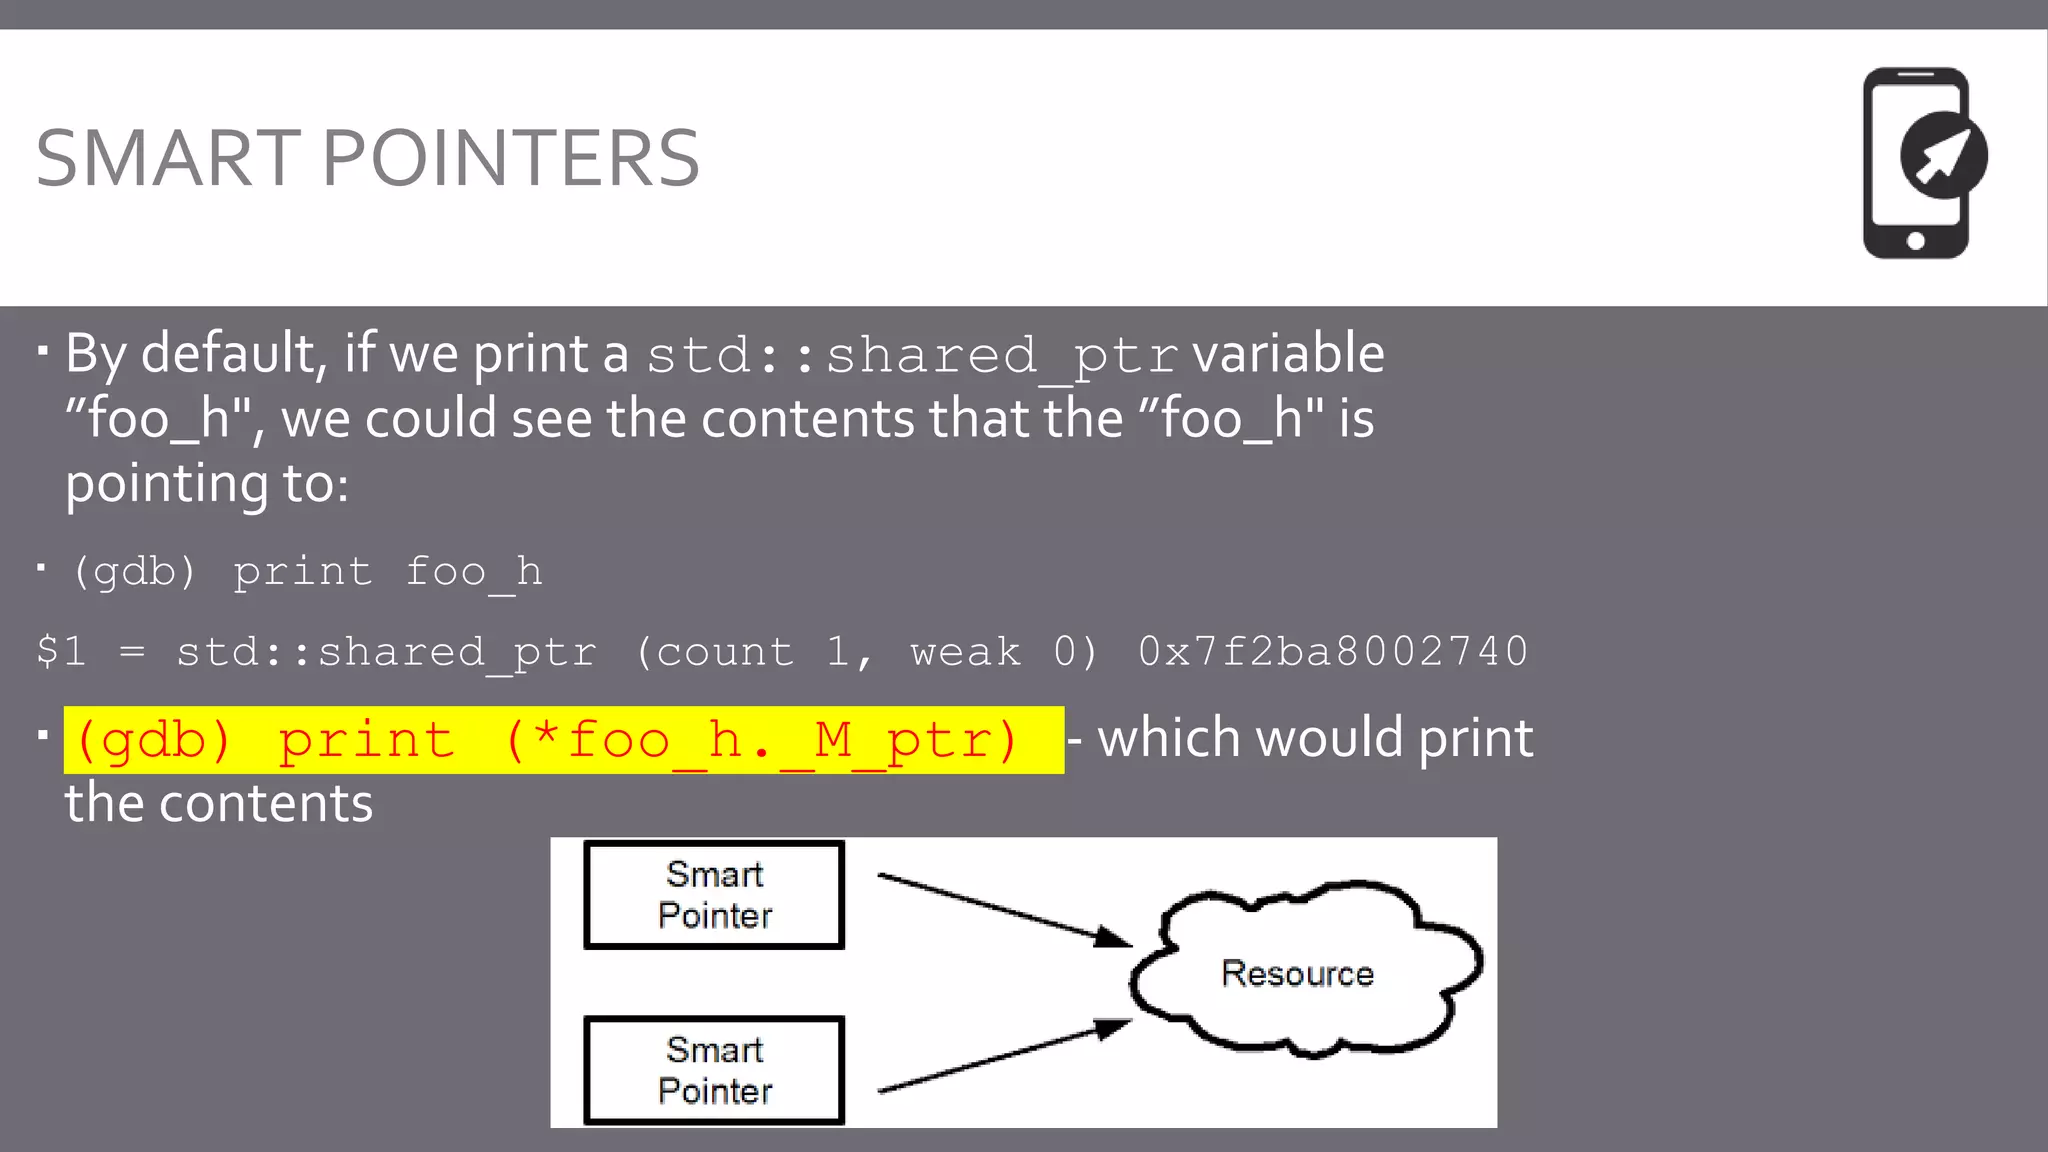
SMART POINTERS  By default, if we print a std::shared_ptr variable ”foo_h", we could see the contents that the ”foo_h" is pointing to:  (gdb) print foo_h $1 = std::shared_ptr (count 1, weak 0) 0x7f2ba8002740  (gdb) print (*foo_h._M_ptr) - which would print the contents
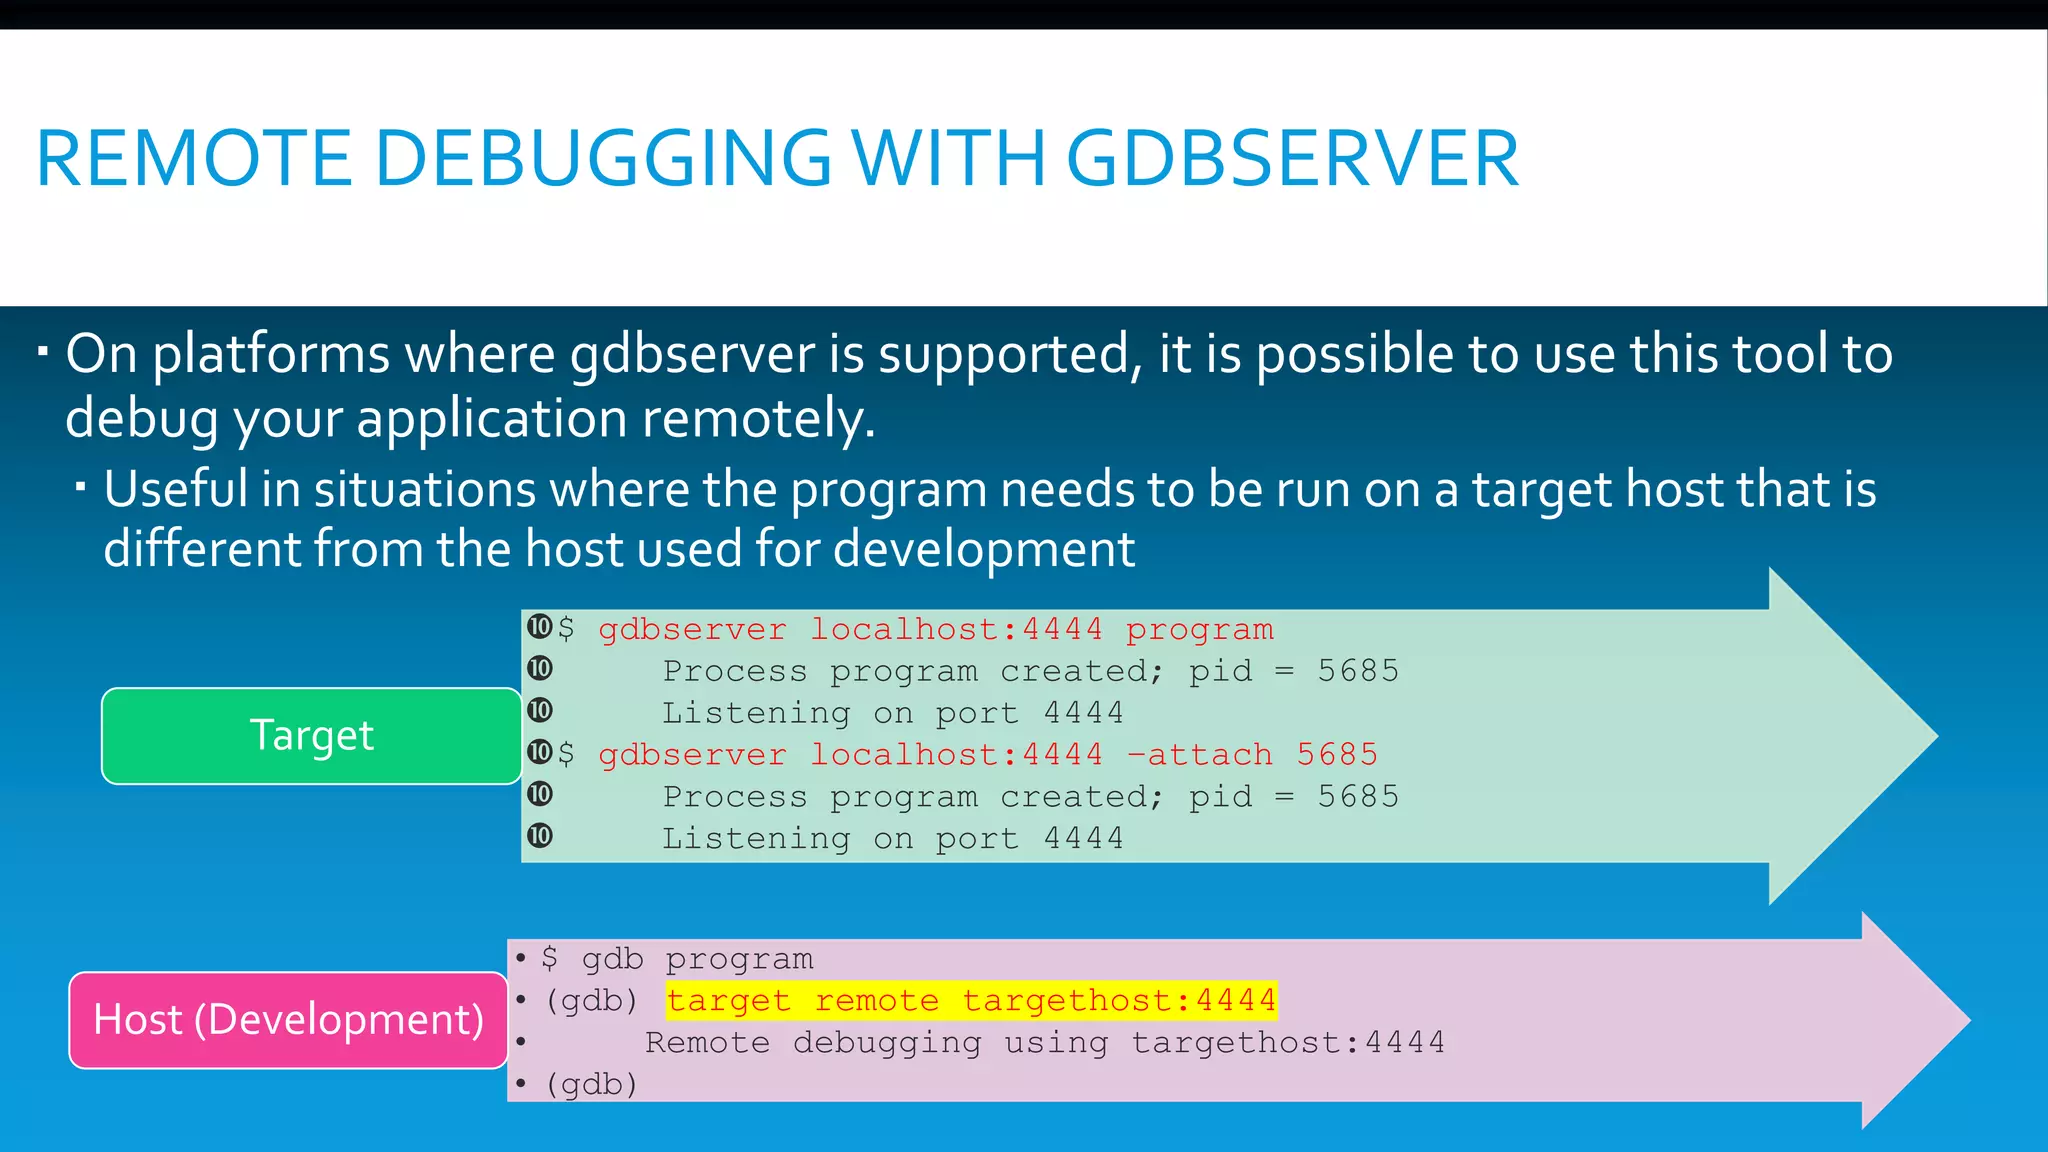
REMOTE DEBUGGING WITH GDBSERVER  On platforms where gdbserver is supported, it is possible to use this tool to debug your application remotely.  Useful in situations where the program needs to be run on a target host that is different from the host used for development $ gdbserver localhost:4444 program  Process program created; pid = 5685  Listening on port 4444 $ gdbserver localhost:4444 –attach 5685  Process program created; pid = 5685  Listening on port 4444 Target • $ gdb program • (gdb) target remote targethost:4444 • Remote debugging using targethost:4444 • (gdb) Host (Development)
GDB MACROS
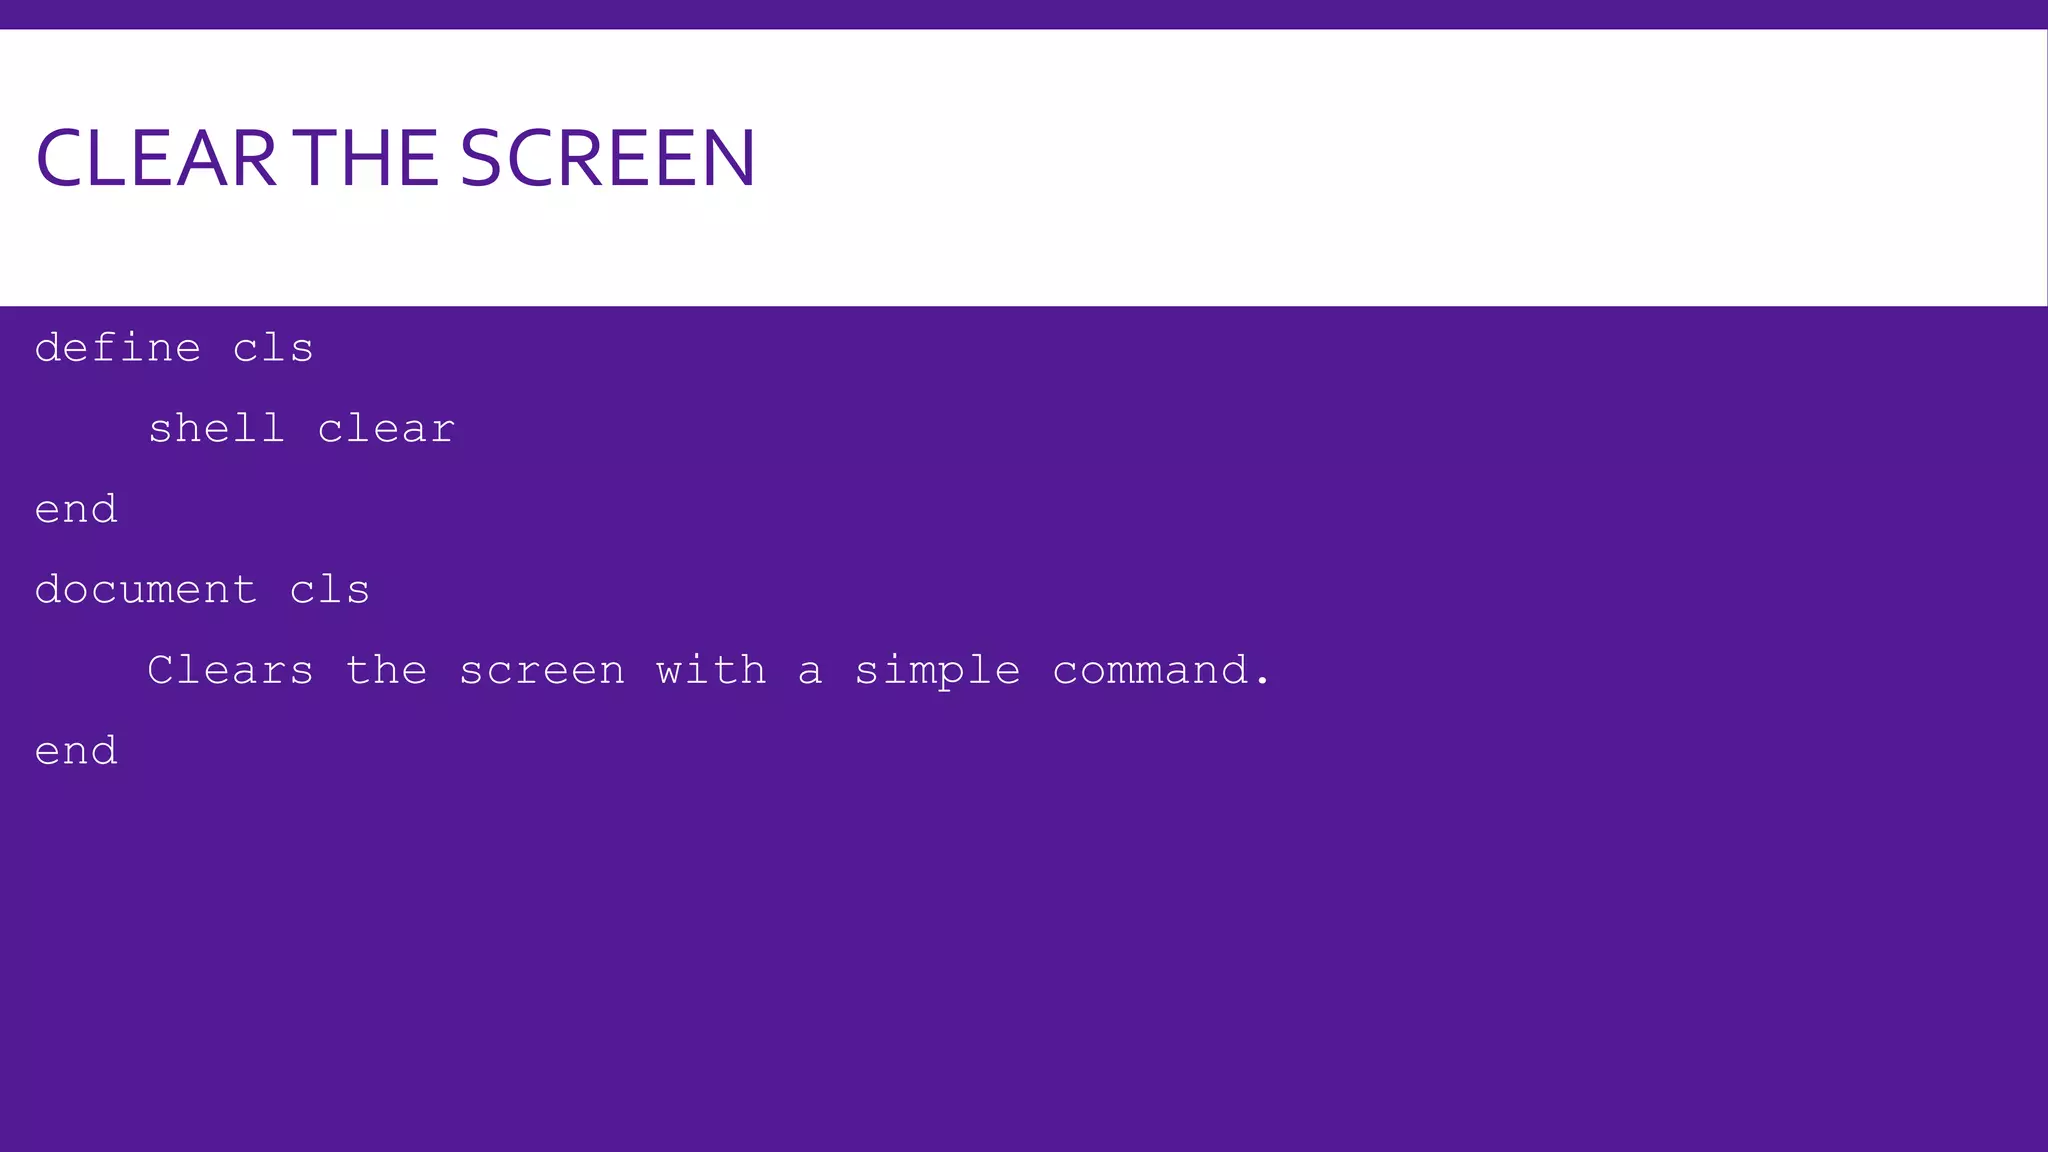
HELLO WORLD define hw print "Hello World" end document hw Prints Hello World end
BASIC FORMAT define <command> <code> end document <command> <help text> end
CLEARTHE SCREEN define cls shell clear end document cls Clears the screen with a simple command. end
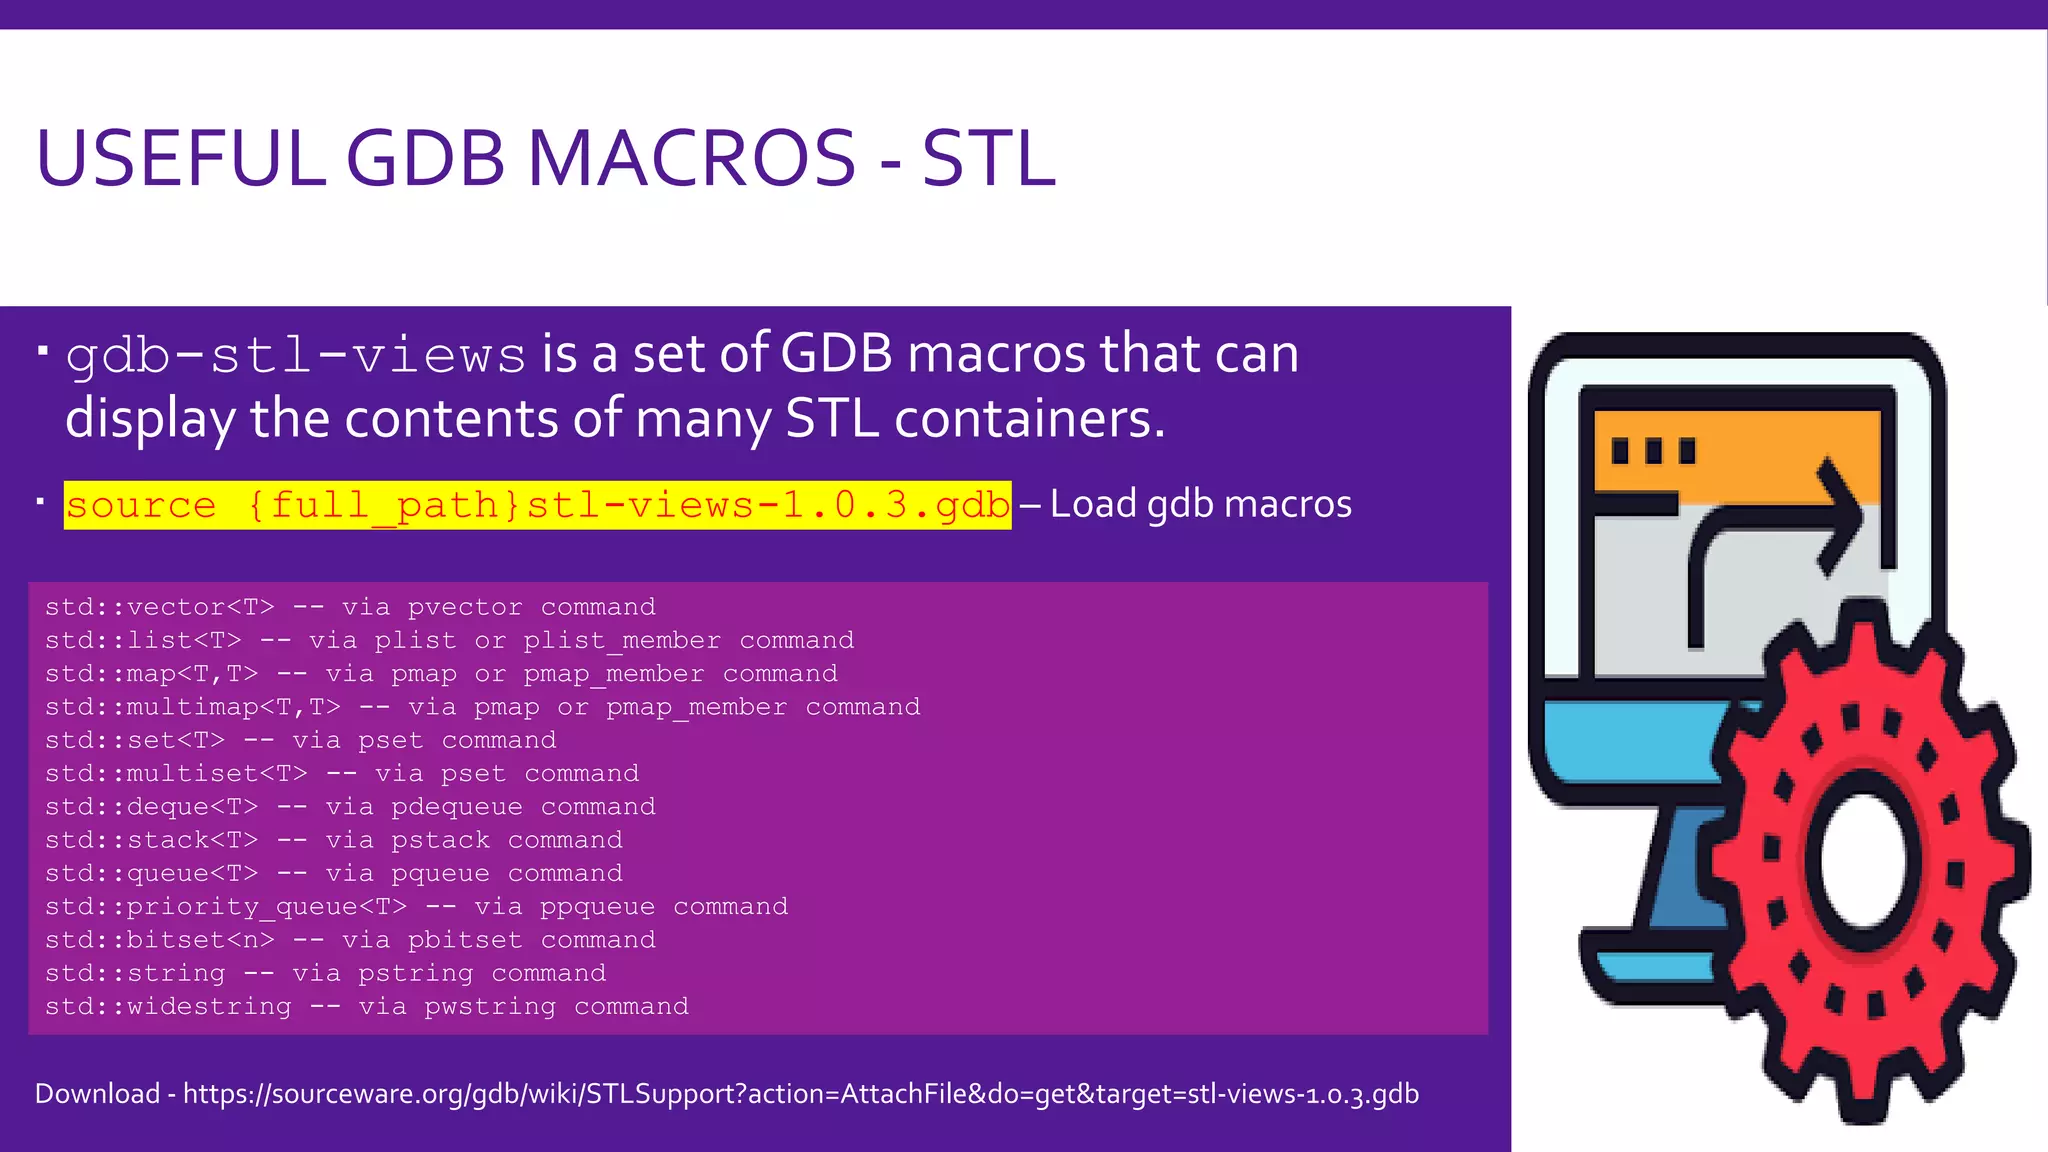
USEFUL GDB MACROS - STL  gdb-stl-views is a set of GDB macros that can display the contents of many STL containers.  source {full_path}stl-views-1.0.3.gdb – Load gdb macros std::vector<T> -- via pvector command std::list<T> -- via plist or plist_member command std::map<T,T> -- via pmap or pmap_member command std::multimap<T,T> -- via pmap or pmap_member command std::set<T> -- via pset command std::multiset<T> -- via pset command std::deque<T> -- via pdequeue command std::stack<T> -- via pstack command std::queue<T> -- via pqueue command std::priority_queue<T> -- via ppqueue command std::bitset<n> -- via pbitset command std::string -- via pstring command std::widestring -- via pwstring command Download - https://sourceware.org/gdb/wiki/STLSupport?action=AttachFile&do=get&target=stl-views-1.0.3.gdb
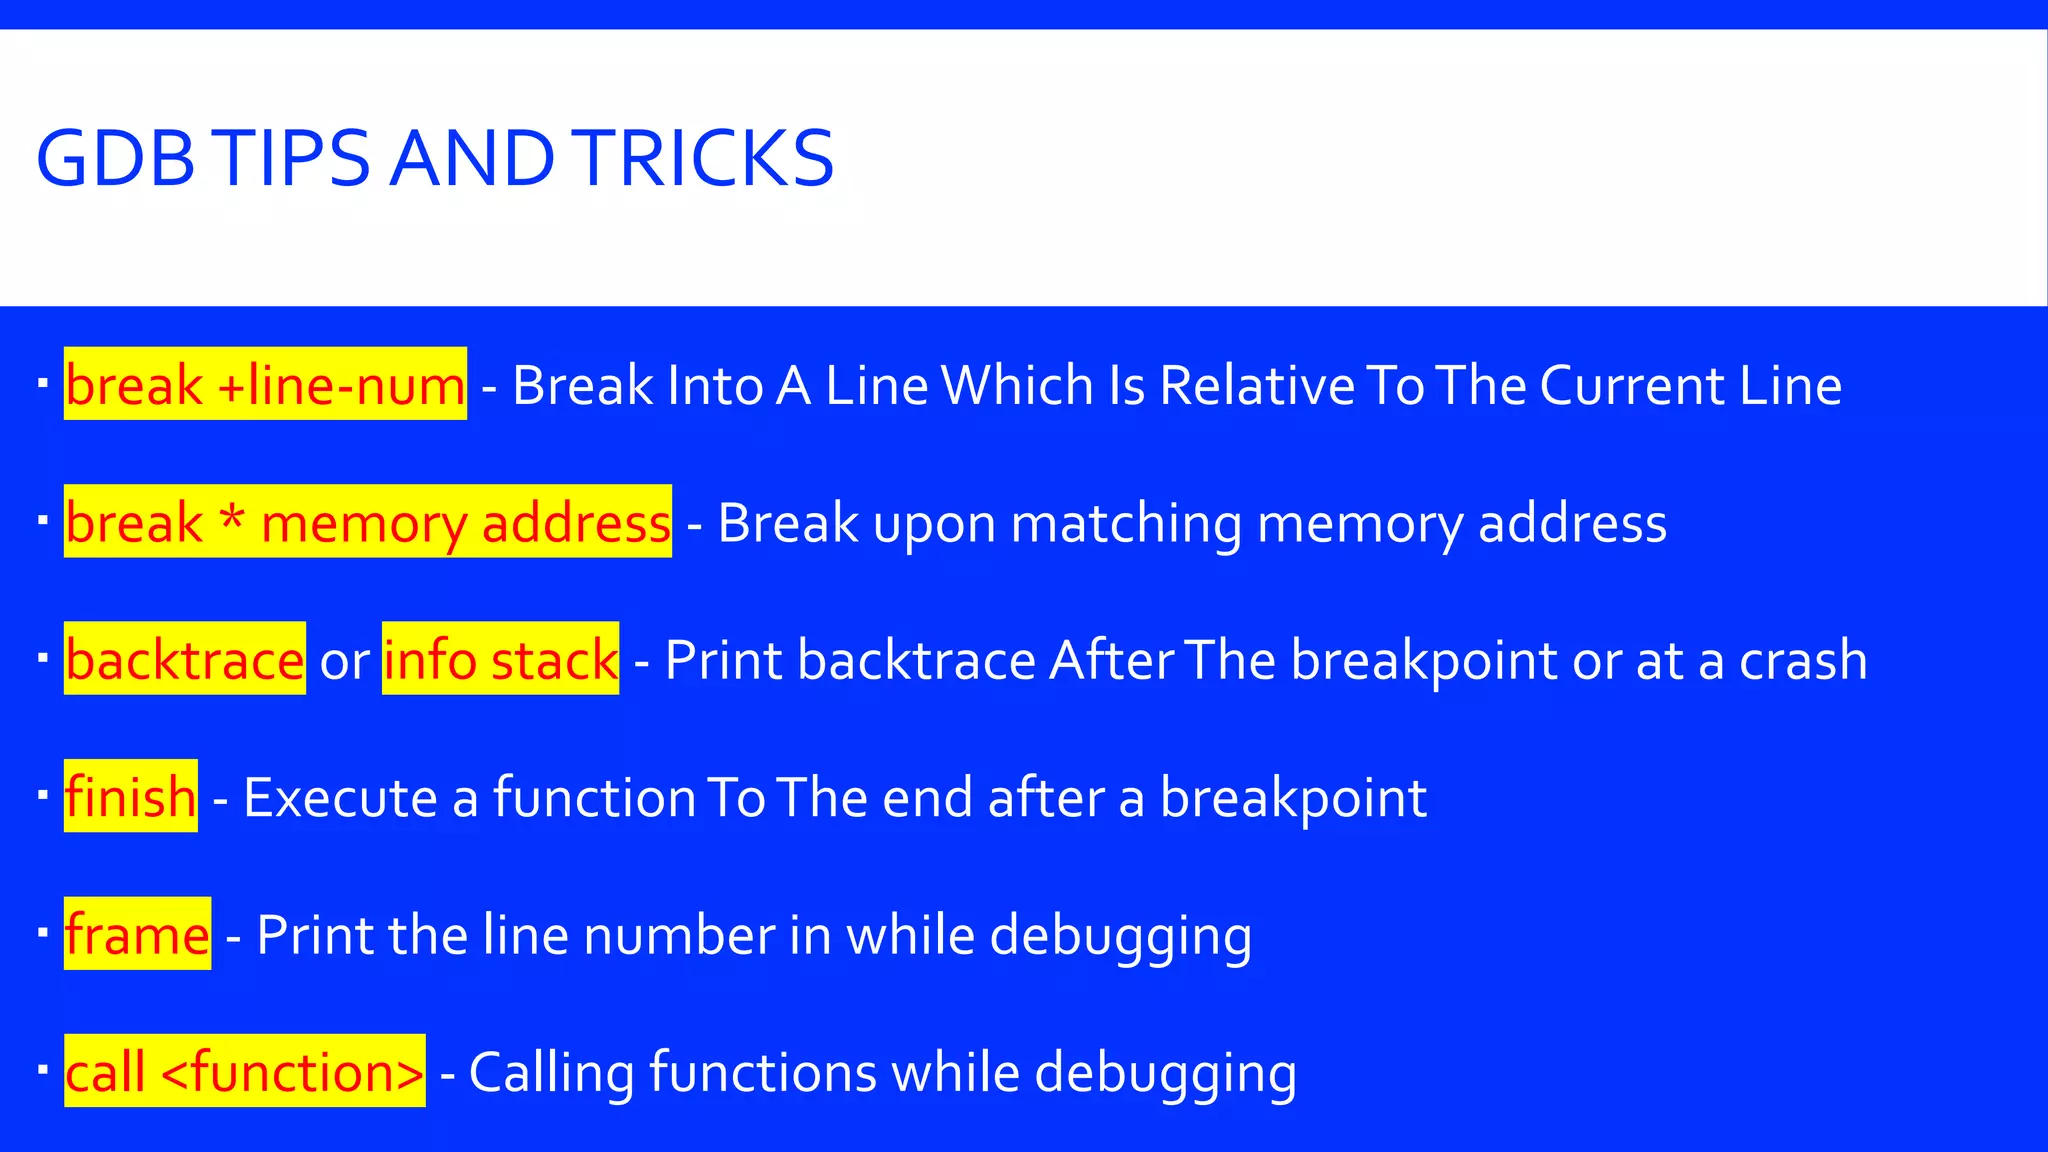
GDBTIPS ANDTRICKS  break +line-num - Break Into A Line Which Is RelativeToThe Current Line  break * memory address - Break upon matching memory address  backtrace or info stack - Print backtrace AfterThe breakpoint or at a crash  finish - Execute a functionToThe end after a breakpoint  frame - Print the line number in while debugging  call <function> - Calling functions while debugging
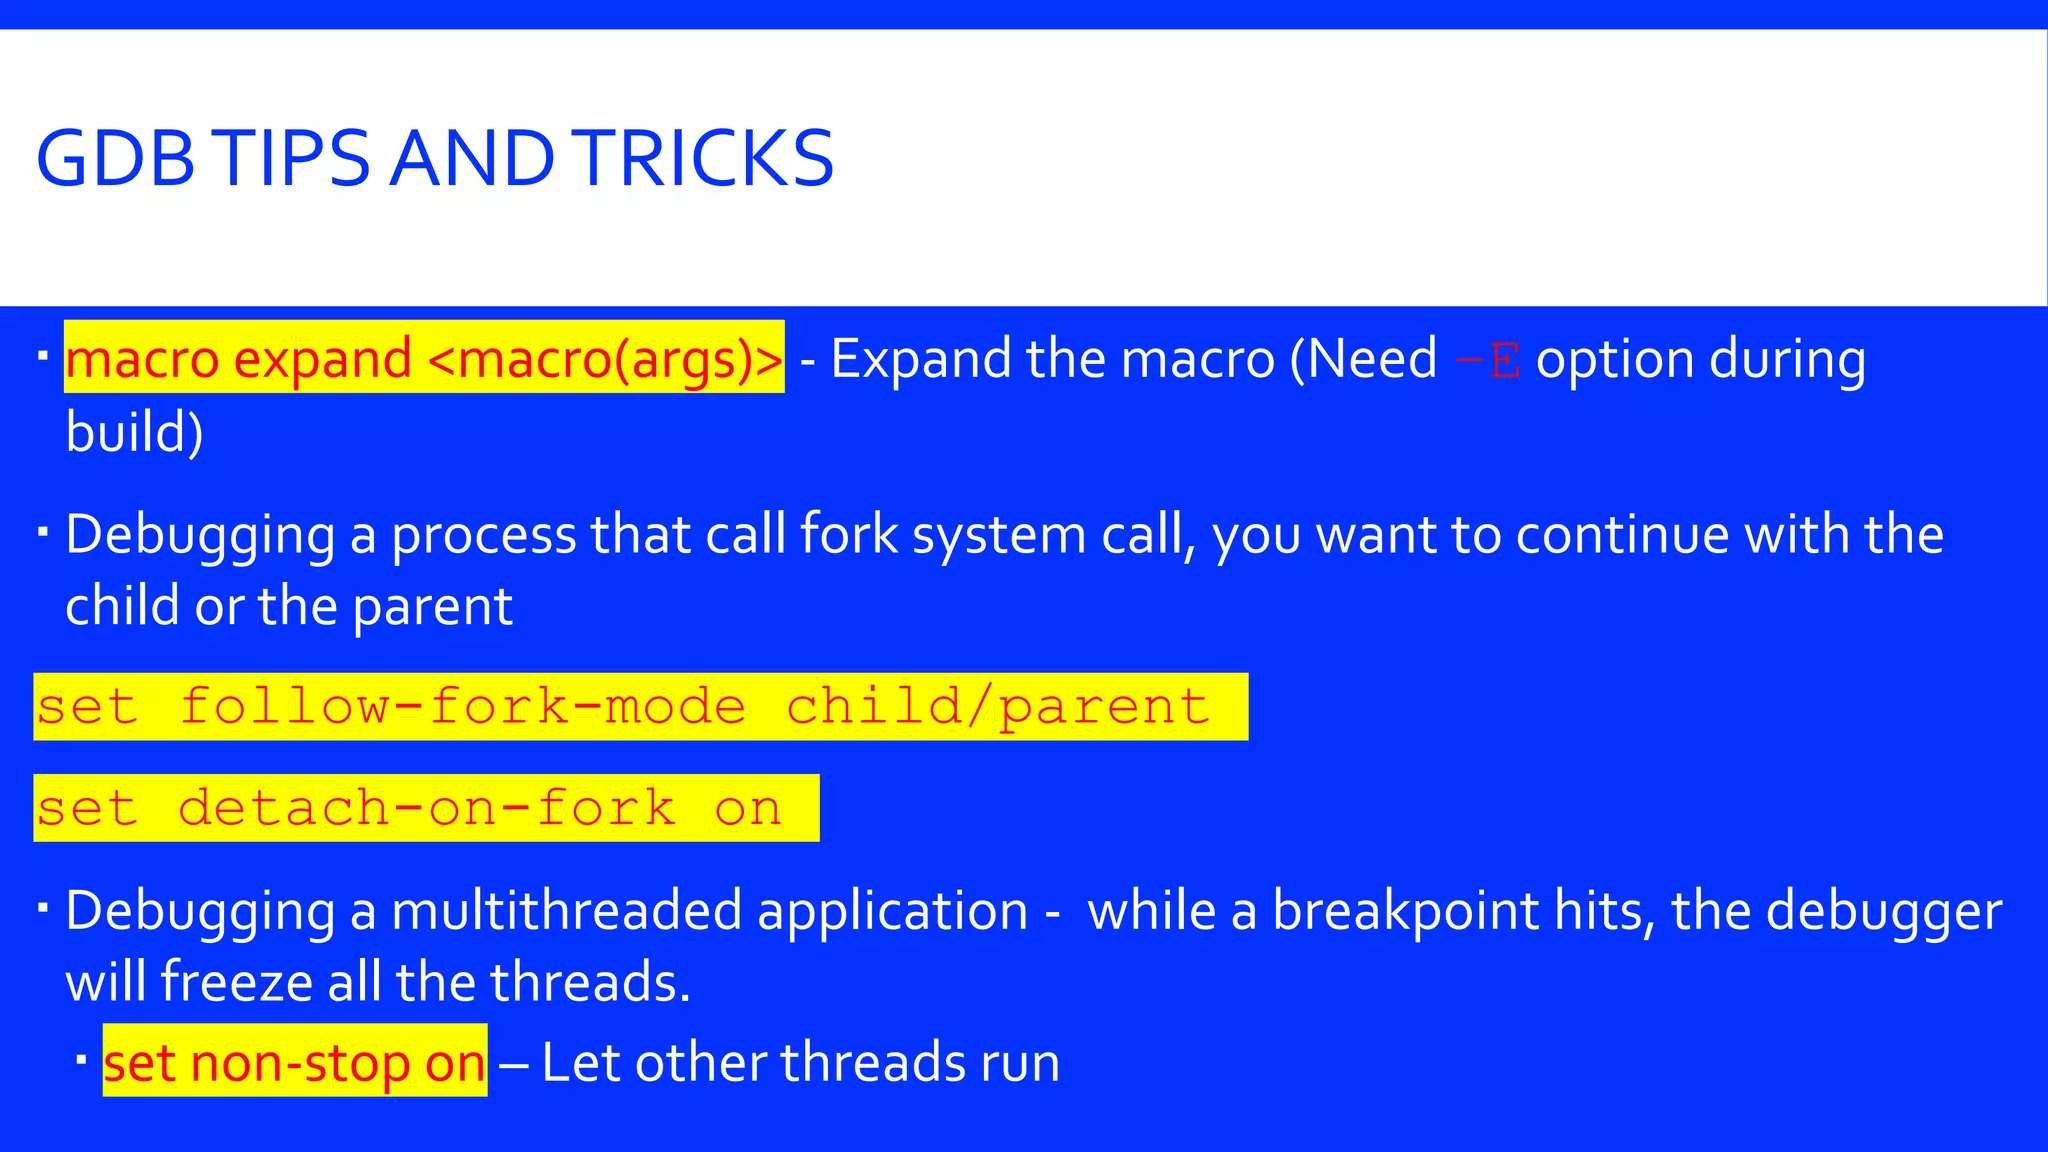
GDBTIPS ANDTRICKS  macro expand <macro(args)> - Expand the macro (Need –E option during build)  Debugging a process that call fork system call, you want to continue with the child or the parent set follow-fork-mode child/parent set detach-on-fork on  Debugging a multithreaded application - while a breakpoint hits, the debugger will freeze all the threads.  set non-stop on – Let other threads run
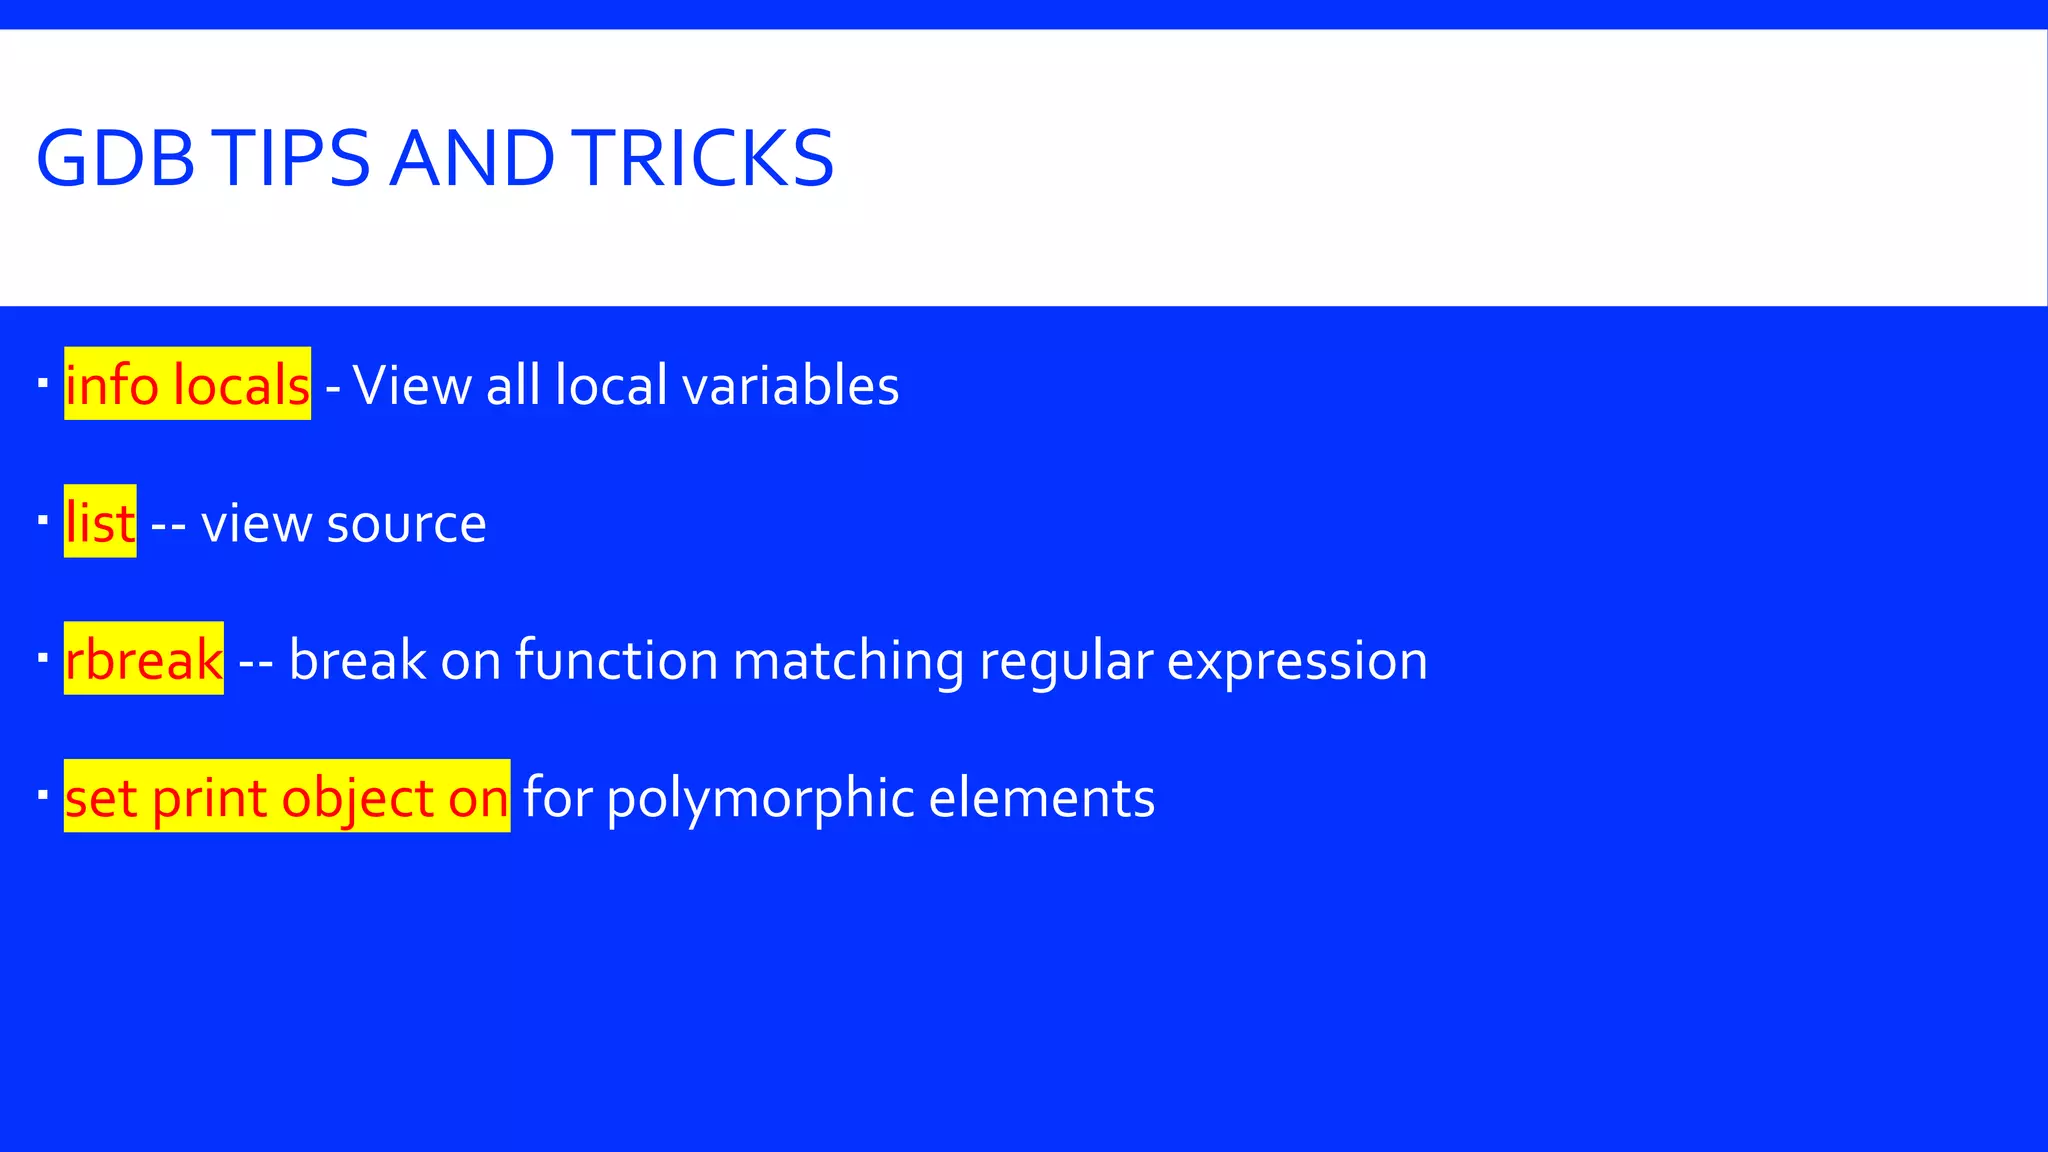
GDBTIPS ANDTRICKS  info locals -View all local variables  list -- view source  rbreak -- break on function matching regular expression  set print object on for polymorphic elements
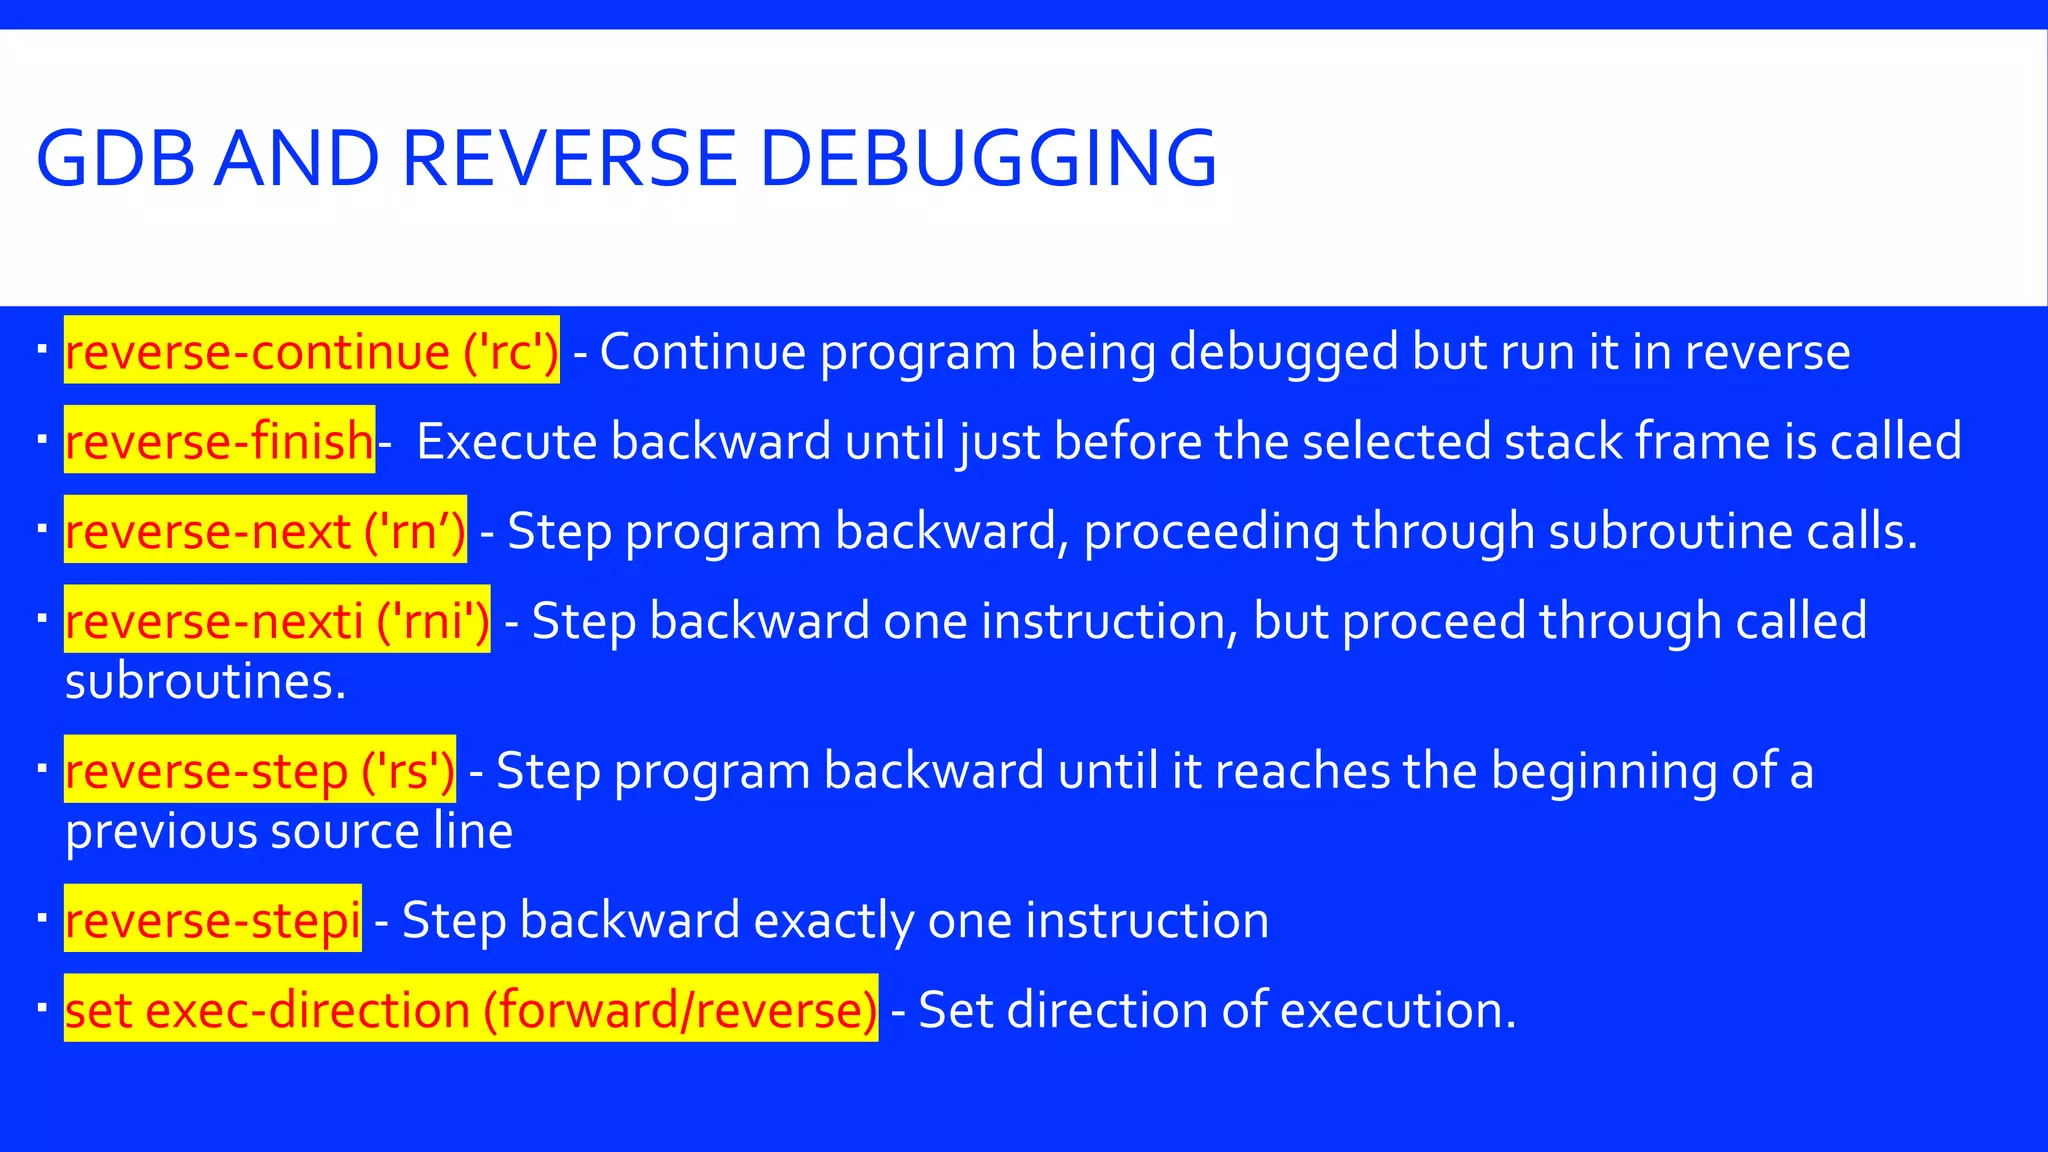
GDB AND REVERSE DEBUGGING  reverse-continue ('rc') - Continue program being debugged but run it in reverse  reverse-finish- Execute backward until just before the selected stack frame is called  reverse-next ('rn’) - Step program backward, proceeding through subroutine calls.  reverse-nexti ('rni') - Step backward one instruction, but proceed through called subroutines.  reverse-step ('rs') - Step program backward until it reaches the beginning of a previous source line  reverse-stepi - Step backward exactly one instruction  set exec-direction (forward/reverse) - Set direction of execution.
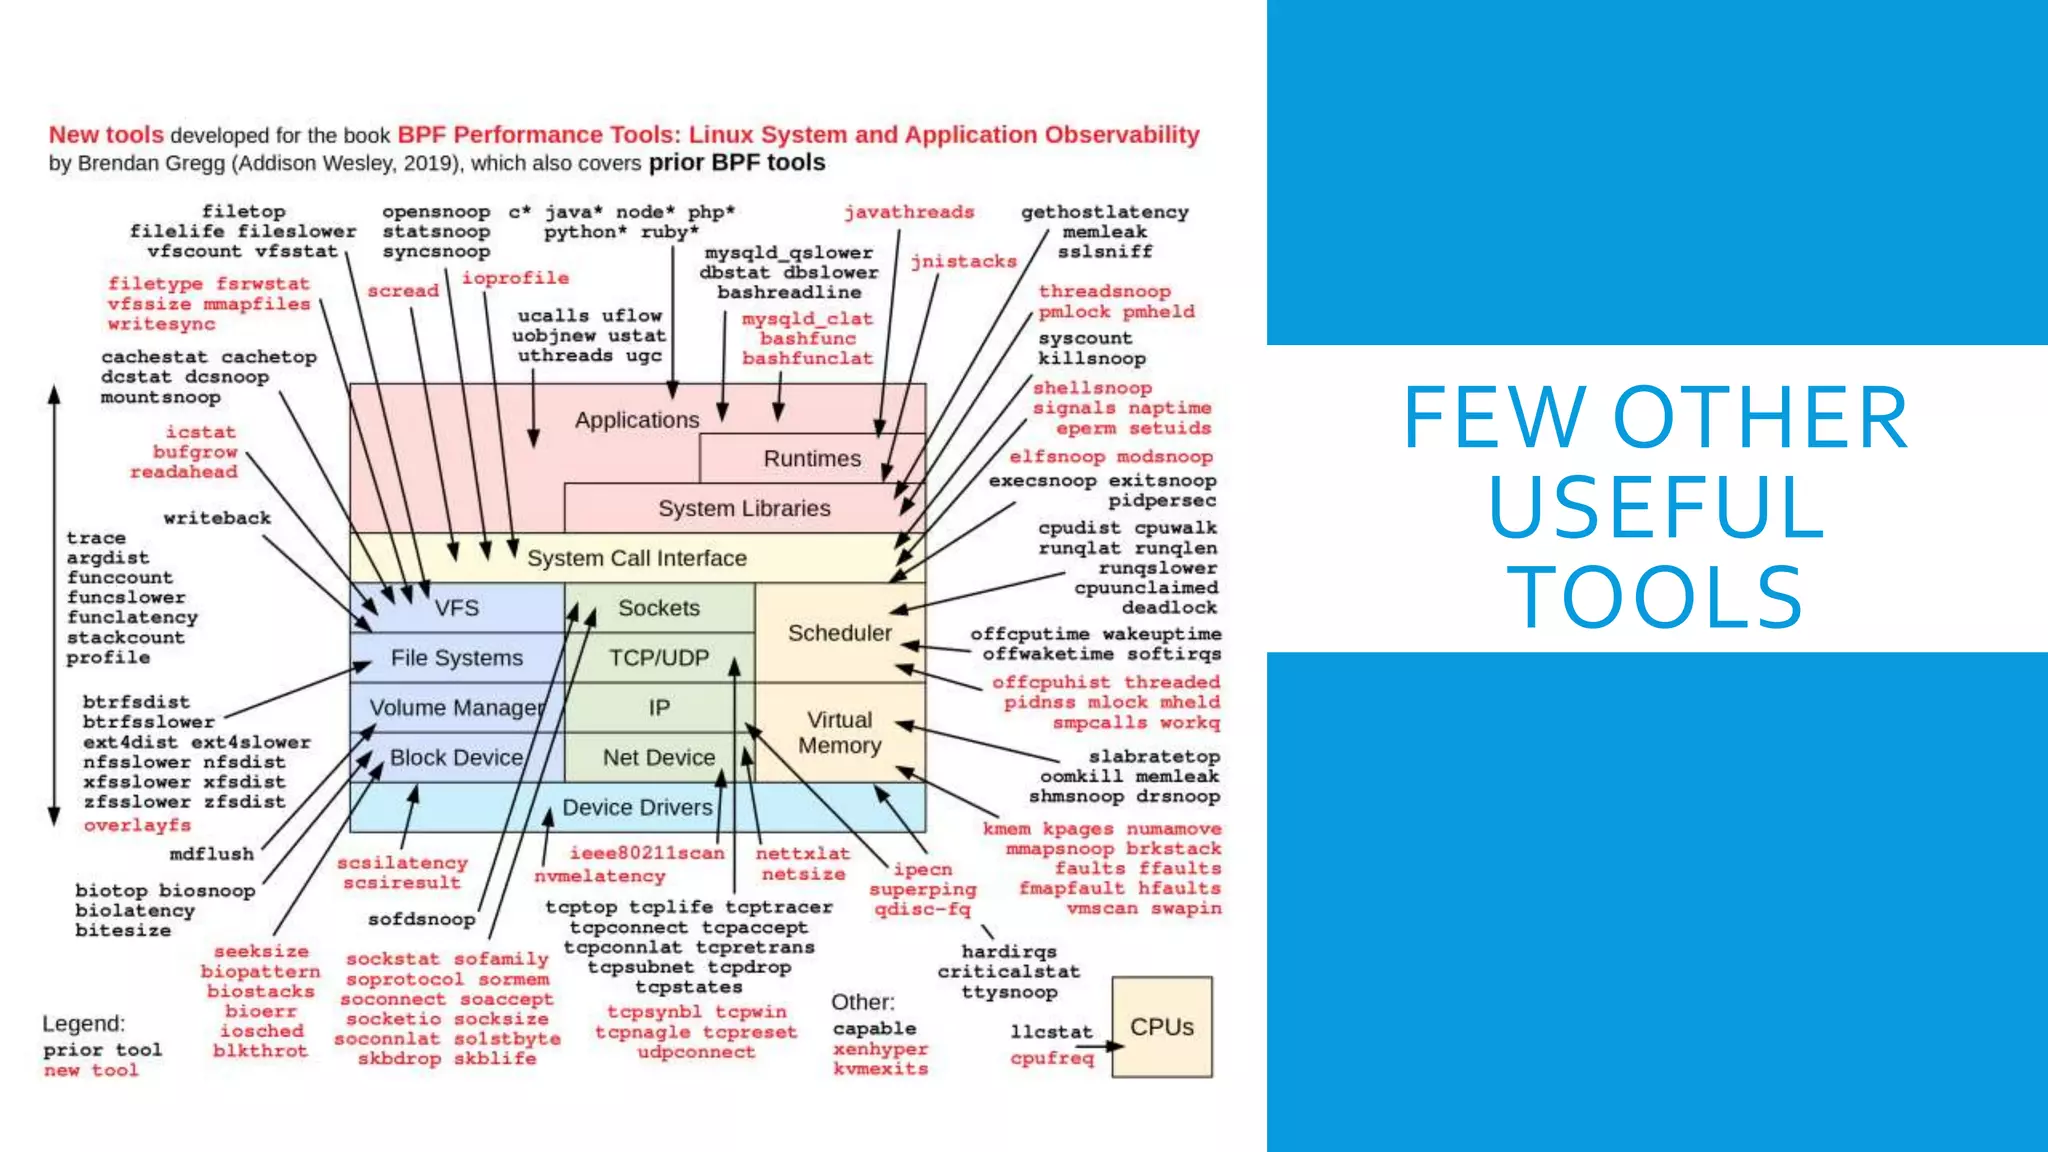
FEW OTHER USEFUL TOOLS
RECOMMENDED BOOKS
GDB QUICK REFEREN CE G D B Version 4 Essential Commands gdb program [core] debug program [using coredump core] b [file:]function run [arglist] bt p expr c n s set breakpoint at function [in file] start your program [with arglist] backtrace: display program stack display the value of an expression continue running your program next line, stepping over function calls next line, stepping into function calls Starting G DB gdb gdb program gdb program core gdb --help start GDB, with no debugging ftles begin debugging program debug coredump core produced by program describe command line options exit GDB; also q or EOF(eg C-d) Stopping G DB quit INTERRUPT (eg C-c) terminate current command, or send to running process Getting Help help help class help command list classes of commands one-line descriptions for commands in class describe command Executing your Program run arglist run run . . . <inf >outf k i l l start your program with arglist start your program with current argument list start your program with input, output redirected kill running program t t y dev s et args arglist s et args show args use dev as stdin and stdout for next run specify arglist for next run specify empty argument list display argument list show env show env var s et env var string unset env var show all environment variables show value of environment variable var set environment variable var remove var from environment Shell Commands cd dir pwd make . . . shell cmd change working directory to dir Print working directory call “make” execute arbitrary shell command string [ ] surround optional arguments . . . show one or more arguments §c1998 Free Software Foundation, Inc. Permissions on back Breakpoints and Watchpoints set breakpoint at line number [in file] eg: break main.c:37 set breakpoint at func [in file] set break at offset lines from current stop break [file:]line b [file:]line break [file:]func break +offset break -offset break *addr break break . . . i f expr cond n [expr] tbreak . . . rbreak regex watch expr catch event info break info watch set breakpoint at address addr set breakpoint at next instruction break conditionally on nonzero expr new conditional expression on breakpoint n; make unconditional if no expr temporary break; disable when reached break on all functions matching regex set a watchpoint for expression expr break at event, which may be catch, throw, exec, fork, vfork, load, or unload. show deftned breakpoints show deftned watchpoints clear clear [file:]fun clear [file:]line delete [n] disable [n] enable [n] enable once [n] enable del [n] ignore n count delete breakpoints at next instruction delete breakpoints at entry to fun() delete breakpoints on source line delete breakpoints [or breakpoint n] disable breakpoints [or breakpoint n] enable breakpoints [or breakpoint n] enable breakpoints [or breakpoint n]; disable again when reached enable breakpoints [or breakpoint n]; delete when reached ignore breakpoint n, count times commands n [silent] command-list execute GDB command-list every time end breakpoint n is reached. [silent suppresses default display] end of command-list print trace of all frames in stack; or of n frames—innermost if n>0, outermost if n<0 select frame number n or frame at address n; if no n, display current frame select frame n frames up select frame n frames down describe selected frame, or frame at addr arguments of selected frame Program Stack backtrace [n] bt [n] frame [n] up n down n info frame [addr] info args info locals info reg [rn]. .. info all-r eg [rn] local variables of selected frame register values [for regs rn] in selected frame; all-r eg includes floating point Execution Control continue running; if count specifted, ignore this breakpoint next count times execute until another line reached; repeat count times if specifted step by machine instructions rather than source lines execute next line, including any function calls next machine instruction rather than source line run until next instruction (or location) run until selected stack frame returns continue [count] c [count] step [count] s [count] stepi [count] s i [count] next [count] n [count] nexti [count] ni [count] u n til [location] finish return [expr] pop selected stack frame without signal num jump line jump *address s et var=expr executing [setting return value] resume execution with signal s (none if 0) resume execution at specifted line number or address evaluate expr without displaying it; use for altering program variables Display print [/f ] [expr] p [/f ][expr] x d u o t a c f c a ll [/f ] expr x [/Nuf ] expr N u f disassem [addr] show value of expr [or last value $] according to format f: hexadecimal signed decimal unsigned decimal octal binary address, absolute and relative character floating point like print but does not display void examine memory at address expr; optional format spec follows slash count of how many units to display unit size; one of b individual bytes h halfwords (two bytes) wwords (four bytes) g giant words (eight bytes) printing format. Any print format, or s null-terminated string i machine instructions display memory as machine instructions Automatic Display display [/f ] expr show value of expr each time program stops [according to format f ] display undisplay n disable disp n enable disp n info display display all enabled expressions on list remove number(s) n from list of automatically displayed expressions disable display for expression(s) number n enable display for expression(s) number n numbered list of display expressions
Expressions expr addr@len file: : nm {type}addr $ $n $$ $$n $ $ $var an expression in C, C + + , or Modula-2 (including function calls), or: an array of len elements beginning at addr a variable or function nm deftned in file read memory at addr as specifted type most recent displayed value nth displayed value displayed value previous to $ nth displayed value back from $ last address examined with x value at address $ convenience variable; assign any value show values [n] show conv show last 10 values [or surrounding $n] display all convenience variables Symbol Table info address s info func [regex] info var [regex] whatis [expr] ptype [expr] ptype type show where symbol s is stored show names, types of deftned functions (all, or matching regex) show names, types of global variables (all, or matching regex) show data type of expr [or $] without evaluating; ptype gives more detail describe type, struct, union, or enum GDB Scripts source script read, execute GDB commands from ftle script define cmd command-list end document cmd help-text end create new GDB command cmd; execute script deftned by command-list end of command-list create online documentation for new GDB command cmd end of help-text Signals handle signal act print noprint stop nostop pass nopass info signals specify GDB actions for signal: announce signal be silent for signal halt execution on signal do not halt execution allow your program to handle signal do not allow your program to see signal show table of signals, GDB action for each Debugging Targets target type param connect to target machine, process, or ftle help target attach param detach display available targets connect to another process release target from GDB control Controlling G DB s et param value show param set one of GDB’s internal parameters display current setting of parameter Parameters understood by s et and show: complaint limit confirm on/off editing on/off height lpp language lang li s t s i z e n prompt str radix base verbose on/off width cpl write on/off number of messages on unusual symbols enable or disable cautionary queries control readline command-line editing number of lines before pause in display Language for GDB expressions (auto, c or modula-2) number of lines shown by l i s t use str as GDB prompt octal, decimal, or hex number representation control messages when loading symbols number of characters before line folded Allow or forbid patching binary, core ftles (when reopened with exec or core) groups with the following options:history . .. h . .. h exp off/on h f i l e filename h size size h save off/on print . .. p . .. disable/enable readline history expansion ftle for recording GDB command history number of commands kept in history list control use of external ftle for command history groups with the following options: p address on/off print memory addresses in stacks, values p array off/on compact or attractive format for arrays p demangl on/off source (demangled) or internal form for C + + symbols p asm-dem on/off demangle C + + symbols in machine- instruction output p elements limit number of array elements to display p object on/off p pretty off/on p union on/off p vtbl off/on print C + + derived types for objects struct display: compact or indented display of union members display of C + + virtual function tables show commands show commands n show commands + show last 10 commands show 10 commands around number n show next 10 commands Working Files f i l e [file] core [file] exec [file] symbol [file] load file add-sym file addr info f i le s path dirs show path info share use file for both symbols and executable; with no arg, discard both read file as coredump; or discard use file as executable only; or discard use symbol table from file; or discard dynamically link file and add its symbols read additional symbols from file, dynamically loaded at addr display working ftles and targets in use add dirs to front of path searched for executable and symbol ftles display executable and symbol ftle path list names of shared libraries currently loaded Source Files d ir names d ir show d ir add directory names to front of source path clear source path show current source path l i s t l i s t - l i s t lines [file:]num [file: ]function +off -off *address l i s t f,l info line num info source info sources forw regex rev regex show next ten lines of source show previous ten lines display source surrounding lines, specifted as: line number [in named ftle] beginning of function [in named ftle] off lines after last printed off lines previous to last printed line containing address from line f to line l show starting, ending addresses of compiled code for source line num show name of current source ftle list all source ftles in use search following source lines for regex search preceding source lines for regex G DB under GNU Emacs M-x gdb C-h m M-s M-n M-i C-c C-f M-c M-u M-d C-x & C-x SPC run GDB under Emacs describe GDB mode step one line (step) next line (next) step one instruction (stepi) ftnish current stack frame (finish) continue (cont) up arg frames (up) down arg frames (down) copy number from point, insert at end (in source ftle) set break at point G DB License show copying show warranty Display GNU General Public License There is NO W ARRANTY for GDB. Display full no-warranty statement. Copyright §c 1991, ’92, ’93, ’98 Free Software Foundation, Inc. Rol a nd H. Pesch The author assumes no responsibility for any errors on this card. This card ma y b e freely distribut ed under t he t er ms of t he G N U General Public License. Please contribute t o development of this card by annotating it. Improvements can b e sent t o bug-gdb@gnu.org. G D B itself is free software; you are welcome t o distribute copies of it under t he t er ms of t he G N U General Public License. There is absolutely no warranty for G D B.
QUESTIONS::COMMENTS::SUGGESTIONS
ITS ALLYOURS!! Thank you… Enjoy the Journey as importantly as the Destination itself!! SenthilKumar Selvaraj senkumar@juniper.net https://www.linkedin.com/in/tiruppursenthil http://randomstufforganized.wordpress.com/

Debugging Modern C++ Application with Gdb

  • 2.
    GDB (GNU DEBUGGER) senkumar@juniper.net DebuggingModern C++ Application with For a fish, the archer fish is known to shoot down bugs from low hanging plants by spitting water at them. Debugging is twice as hard as writing the code in the first place. Therefore, if you write the code as cleverly as possible, you are, by definition, not smart enough to debug it. - Brian Kernighan
  • 3.
    DISCLAIMER The opinions expressedin this presentation and on the following slides are solely those of the presenter. Neither the presenter guarantee the accuracy or reliability of the information provided herein. May you do good and not evil. May you find forgiveness for yourself and forgive others. May you share freely, never taking more than you give!
  • 4.
  • 5.
  • 6.
  • 7.
  • 8.
    WHAT IS? Bug, Debug,Debugging, … Coder: code will produce output X … Computer: code will produce Z….
  • 9.
    WHAT IS -BUG, DEBUG, DEBUGGING, …  Debugging is the process of finding and resolving defects or problems within a computer program that prevent correct operation of computer software or a system.  The terms "bug" and "debugging" are popularly attributed to Admiral Grace Hopper in the 1940s.  On a Mark II computer at Harvard University, a moth stuck in a relay and thereby impeding operation, whereupon she remarked that they were "debugging" the system.  The term "bug", in the sense of "technical error", dates back at least to 1878 andThomas Edison (see software bug for a full discussion).
  • 11.
  • 12.
    THE PRINCIPLES OFDEBUGGING  Debugging is an art rather than a science  There are definite principles that guide its practice.  The Essence of Debugging:The Principle of Confirmation  The Fundamental Principle of Confirmation  Fixing a buggy program is a process of confirming, one by one, that the many things believed to be true about the code are actually true.  When one of the assumptions is not true, we have found a clue to the location (if not the exact nature) of a bug.
  • 13.
    THE PRINCIPLES OF DEBUGGING SmartSmall Use a top-down approach Use a debugging tool to determine the location of a segmentation fault Determine the location of an infinite loop by issuing an interrupt Use binary search
  • 14.
    WHY TO USEA TOOL TO DEBUG? What is the value of a DebuggingTool for the Principle of Confirmation?
  • 15.
    WHYTO USE ATOOLTODEBUG -TO AVOID… AddTracing code Recompile Run Analyze the trace output Fix issue Remove Tracing code Whatisthevalueofa DebuggingToolforthe PrincipleofConfirmation?
  • 16.
    WHAT TO EXPECT OUTOF A DEBUG TOOL? What is the value of a DebuggingTool for the Principle of Confirmation?
  • 17.
    WHATTO EXPECT? SteppingThrough theSource Code InspectingVariables Inspection of changes to aVariable Moving Up and Down the Call Stack
  • 18.
    WHATTO EXPECT? SteppingThrough theSource Code Breakpoints Single-stepping Resume
  • 19.
     Debuggers areprograms which allow you to execute your program in a controlled manner, so you can look inside your program to find a bug.  Tools that can examine the state of a running program.  Debuggers allow for more fine-tuned control, and don’t force you to repeatedly re-compile your code every time you want to test something new  Common debuggers: adb, dbx, gdb, kdb, wdb, xdb, pdb, ... DEBUGGERS It’s not a tool to remove bugs!
  • 20.
    WHAT IS GDB? GDB is the GNU Project debugger  Richard Stallman was the original author of gdb  GDB can be used to debug programs written in C, C++.  gdb is a reasonably sophisticated text-based debugger.  Start your program, specifying anything that might affect its behavior.  Make your program stop on specified conditions.  Examine what has happened, when your program has stopped.  Change things in your program, so you can experiment with correcting the effects of one bug and go on to learn about another.
  • 21.
    WHYTO LEARN GDB? Despiteits age, gdb remains an amazingly versatile and flexible tool Mastering it can save you huge amounts of time when trying to debug problems in your code.
  • 22.
    USAGE  Usage gdb [prog][core | procID]  GDB is invoked by running the program gdb.  Once the debugger is started, GDB reads command until you tell it to exit.  To exit gdb: quit  GDB can be started with variety of arguments and options.  gdb program – one argument, which is an executable file more than one arguments can be provided  gdb program core – two arguments, one executable and one core file  gdb program 1234 – specify process id as second argument
  • 23.
    Help from thecompiler Dwarf debug info: type system and calling conventions Help from the CPU watchpoint and instruction-level step- by-step Help from the OS ... the rest (access to the memory/registers + scheduler) BEHINDTHE SCENE
  • 24.
    COMPILING FOR DEBUGGING In order to debug a program effectively, you need to generate debugging information when you compile it.  Debugging information is stored in the object file; it describes the data type of each variable or function and the correspondence between source line numbers and addresses in the executable code.  With gcc and g++, this is accomplished using the -g option.  This option tells the compiler to insert more information about data types, etc., so the debugger gets a better understanding of it.
  • 25.
     The .gdinitfile is the initialization file for gdb.  Contain GDB commands to automatically execute during GDB startup  ~/.gdbinit - User initialization file.  It is executed unless user specifiedGDB options - nx, -n or -nh.  ./.gdbinit - Initialization file for current directory.  It may need to be enabled with GDB security command set auto-load local-gdbinit. .GDBINIT
  • 26.
    STARTING GDB…  StartingGDB: gdb  Loading the symbol table: file my_prog  my_prog is executable file name!  Exit GDB: quit  Executing shell commands: shell command args  Compiling within gdb  Make is a special case: make args Start GDB and load the symbol table in one step: gdb my_prog
  • 27.
    GDB COMMAND SHORT-HANDS Command names may be truncated if the abbreviation is unambiguous: s (for step), r (for run)  UNIX styleTAB completion for the command names.  Alternative way: complete chars. Eg.: complete h results in: handle hbreak help  Getting help:  help (or h) – lists all classes of commands.  h command - displays a short description of the command
  • 28.
    RUNNING A PROGRAM When gdb starts, the program is not actually running. It won't run until it is instructed.  run (or r) -- creates an inferior process that runs your program.  If there are no execution errors the program will finish and results will be displayed  In case of error, the GDB will show:  The line the program has stopped on and  A short description of what it believes has caused the error  Redirecting output: run > outfile direct the output to the file outfile.  "Inferior" is a general term to mean "something that you are using gdb to debug" -- generally a process or perhaps a kernel running on an emulator or on some other piece of hardware connected on a serial line.
  • 29.
    SPECIFYING ARGUMENTS  Asarguments to run: run arg1 arg2 …  With set args command: set args arg1 arg2 …  run without arguments uses the same arguments used by the previous run.  set args without arguments – removes all arguments.  show args command shows the arguments your program has been started with.
  • 30.
    DEBUGGING AN ALREADY-RUNNINGPROCESS  From inside GDB: attach process-id  Tip: UNIX command ps can be used to obtain the process id  From outside GDB: gdb my_prog process-id  The first thing GDB does after arranging to debug the specified process is to stop it.  detach – detaches the currently attached process from the GDB control.  Detached process continues its own execution.
  • 31.
    KILLINGTHE INFERIOR PROCESS Kill - Kill the child process in which your program is running under gdb.  Useful if you wish to recompile and relink your program, since on many systems it is impossible to modify an executable file while it is running in a process.  In this case, when you next type run, gdb notices that the file has changed, and reads the symbol table again (while trying to preserve your current breakpoint settings).
  • 32.
    BREAKPOINT  A breakpoint makes your program stop whenever a certain point in the program is reached  Ways to set a break point  break function - Set a breakpoint at entry to function function  break offset - Sets a breakpoint some number of lines forward or back from the position at which execution stopped.  break line-num - Sets a breakpoint at line line number in the current source file  break filename:function - Sets a breakpoint at entry to function function found in file filename. Specifying a file name as well as a function name is superfluous except when multiple files contain similarly named functions.  info break - Prints a table of all breakpoints set and not deleted
  • 33.
    WATCHPOINT  A watchpoint is a special breakpoint that stops your program when the value of an expression changes  Ways to set a watch point  watch expr - Sets a watchpoint for an expression.  info watchpoints - Prints a table of all watch points set and not deleted
  • 34.
    ELIMINATE - BREAKPOINTSANDWATCHPOINTS  Eliminate a breakpoint or watchpoint once it has done its job and you no longer want your program to stop there.  Based on Location  clear - Delete any breakpoints at the next instruction to be executed in the selected stack frame.  clear function, clear filename:function - Delete any breakpoints set at entry to the function function.  clear linenum, clear filename:linenum - Delete any breakpoints set at or within the code of the specified line.  Based on number  delete [breakpoints] [range...] - Delete the breakpoints or watchpoints of the breakpoint ranges specified as arguments.  If no argument is specified, delete all breakpoints
  • 35.
    EXAMININGVARIABLES  Global variablescan be examined from every point in the source file.  Local variables – can be examined only in their scope or using:  var - file::variable or function::variable  The variable type: ptype var  Current value: print var  Automatic display:  display var - adds var to the automatic display list.  undisplay dnum - Removes var from the automatic display list.  Specifying the output format (x, o, d, u, t, a, f, and c) :  print /t var - prints the value of var in binary format
  • 36.
    STEPPINGTHROUGHTHE PROGRAM  step[count] – program execution continue to next source line going into function calls.  next [count] – program execution continue to the next source line omitting function calls.  continue [ignore-count] – resume program execution  ignore-count allows you to specify a further number of times to ignore a breakpoint at this location  until – continue until the next source line in the current stack frame is reached.  useful to exit from loops count - times step into function; next statement
  • 38.
    ALTERING EXECUTION  Returningfrom a function  finish - forced return  return [ret_value] – pops the current stack frame  Continuing at different address: jump line_num|*address  Altering the value of a variable: set <var> = <value>  Proceeding to a specified point: until [line_num|*address |function_name]  call <function(args)> – Invokes the function
  • 39.
    Stack frames are identified by their addresses, whichare kept in the frame pointer register. Selecting a frame: frame n|addr up n down n Information about the current frame: frame - brief description info args - shows function arguments info locals - shows local variables THE STACK FRAME
  • 40.
    CONVENIENCEVARIABLES Automatically created conveniencevariables $pc – program counter $sp – stack pointer $fp – frame pointer $ps – processor status $_ - contains the last examined address $__ - the value in the last examined address $_exitcode - the exit code of the debugged program Convenience variables are used to store values that you may want to refer later. Any string preceded by $ is regarded as a convenience variable. Eg.: $table = *table_ptr
  • 41.
     The xcommand (for “examine”):  x/nfu addr – specify the number of units (n), the display format (f) and the unit size (u) of the memory you want to examine, starting from the address addr. Unit size can be – b, h (half), w and g (giant).  x addr – start printing from the address addr, others default EXAMINING MEMORY
  • 42.
    REGISTERS Registers names aredifferent for each machine. Use info registers to see the names used on your machine. info all-registers - Print the names and values of all registers, including floating- point and vector registers (in the selected stack frame). GDB has four “standard” registers names that are available on most machines: Program counter - $pc Stack pointer - $sp Frame pointer - $fp Processor status - $ps
  • 43.
    info proc –summarize available information about the current process. info proc mappings – address range accessible in the program. info proc times – starting time, user CPU time and system CPU time for your program and its children. info signals – information about the system signals and how GDB handles them. ADDITIONAL PROCESS INFORMATION
  • 44.
    THREADS  info threads- Lists all active threads  thread <Thread Number> - Switching between threads while debugging (gdb) info threads Id Target Id Frame 4 Thread 0x7ffff6fc3700 (LWP 2281) "sample" 0x00007ffff73c34fd in write () at ../sysdeps/unix/syscall-template.S:81 3 Thread 0x7ffff67c2700 (LWP 2282) "sample" __lll_lock_wait_private () at ../sysdeps/unix/sysv/linux/x86_64/lowlevellock.S:95 2 Thread 0x7ffff5fc1700 (LWP 2283) "sample" __lll_lock_wait_private () at ../sysdeps/unix/sysv/linux/x86_64/lowlevellock.S:95 * 1 Thread 0x7ffff7fd0740 (LWP 2277) "sample" __lll_lock_wait_private () at ../sysdeps/unix/sysv/linux/x86_64/lowlevellock.S:95
  • 45.
    THREADS  thread applyall bt - Checking Stack trace of all the threads  The command “thread apply“ applies the specified command to specified thread ID.  Specify “all” instead of thread ID to apply the command to all threads.  To display the stack trace of current thread only use command “bt” i.e. (gdb) bt #0 __lll_lock_wait_private () at ../sysdeps/unix/sysv/linux/x86_64/lowlevellock.S:95 #1 0x00007ffff733bb1a in __GI__IO_fwrite (buf=0x7ffff7692970 , size=1, count=11, fp=0xffffffffffffffff) at iofwrite.c:41 #2 0x00007ffff7b63a66 in std::basic_ostream<char, std::char_traits >& std::__ostream_insert<char, std::char_traits >(std::basic_ostream<char, std::char_traits >&, char const*, long) () from /usr/lib/x86_64- linux-gnu/libstdc++.so.6 #3 0x00007ffff7b63e77 in std::basic_ostream<char, std::char_traits >& std::operator<< <std::char_traits >(std::basic_ostream<char, std::char_traits >&, char const*) () from /usr/lib/x86_64-linux-gnu/libstdc++.so.6 #4 0x000000000040104f in main () at sample.cpp:23
  • 46.
    POSTMORTEM DEBUGGING –CORE  A core file or core dump is a file that records the memory image of a running process and its process status (register values etc.).  Its primary use is post-mortem debugging of a program that crashed while it ran outside a debugger.  A program that crashes automatically produces a core file, unless this feature is disabled by the user.  Occasionally, you may wish to produce a core file of the program you are debugging in order to preserve a snapshot of its state.  gdb has a special command for that generate-core-file.  gcore [file]  Produce a core dump of the inferior process.The optional argument file specifies  the file name where to put the core dump. If not specified, the file name defaults to ‘core.pid’, where pid is the inferior process ID.
  • 47.
    STL CONTAINERS  Pretty-printersin Python (Yes gdb support automation with python)  pretty-printers in the libstdc++ svn repository  Check-out the latest Python libstdc++ printers to a place on your machine. In a local directory, do: svn co svn://gcc.gnu.org/svn/gcc/trunk/libstdc++-v3/python  Add the following to your ~/.gdbinit. python import sys sys.path.insert(0, '/home/user_name/gdb_printers/python') from libstdcxx.v6.printers import register_libstdcxx_printers register_libstdcxx_printers (None) end
  • 48.
    info pretty-printer –Shows the loaded pretty printers print *(iter._M_current) -To display the item the iterator points at STL CONTAINERS
  • 49.
    STL CONTAINERS Default • (gdb)print foo_int_vector • $1 = {<std::_Vector_base<int, std::allocator<int> >> = {_M_impl = {<std::allocator<int>> = {<__gnu_cxx::new_allocator<int>> = {<No data fields>}, <No data fields>}, _M_start = 0x603010, _M_finish = 0x60301c, _M_end_of_storage = 0x60301c}}, <No data fields>} Pretty Printer • (gdb) print some_other_foo_int_vector • $1 = std::vector of length 2, capacity 2 = {2, 0}
  • 50.
    SMART POINTERS  Bydefault, if we print a std::shared_ptr variable ”foo_h", we could see the contents that the ”foo_h" is pointing to:  (gdb) print foo_h $1 = std::shared_ptr (count 1, weak 0) 0x7f2ba8002740  (gdb) print (*foo_h._M_ptr) - which would print the contents
  • 51.
    REMOTE DEBUGGING WITHGDBSERVER  On platforms where gdbserver is supported, it is possible to use this tool to debug your application remotely.  Useful in situations where the program needs to be run on a target host that is different from the host used for development $ gdbserver localhost:4444 program  Process program created; pid = 5685  Listening on port 4444 $ gdbserver localhost:4444 –attach 5685  Process program created; pid = 5685  Listening on port 4444 Target • $ gdb program • (gdb) target remote targethost:4444 • Remote debugging using targethost:4444 • (gdb) Host (Development)
  • 52.
  • 53.
    HELLO WORLD define hw print"Hello World" end document hw Prints Hello World end
  • 54.
  • 55.
    CLEARTHE SCREEN define cls shellclear end document cls Clears the screen with a simple command. end
  • 56.
    USEFUL GDB MACROS- STL  gdb-stl-views is a set of GDB macros that can display the contents of many STL containers.  source {full_path}stl-views-1.0.3.gdb – Load gdb macros std::vector<T> -- via pvector command std::list<T> -- via plist or plist_member command std::map<T,T> -- via pmap or pmap_member command std::multimap<T,T> -- via pmap or pmap_member command std::set<T> -- via pset command std::multiset<T> -- via pset command std::deque<T> -- via pdequeue command std::stack<T> -- via pstack command std::queue<T> -- via pqueue command std::priority_queue<T> -- via ppqueue command std::bitset<n> -- via pbitset command std::string -- via pstring command std::widestring -- via pwstring command Download - https://sourceware.org/gdb/wiki/STLSupport?action=AttachFile&do=get&target=stl-views-1.0.3.gdb
  • 57.
    GDBTIPS ANDTRICKS  break+line-num - Break Into A Line Which Is RelativeToThe Current Line  break * memory address - Break upon matching memory address  backtrace or info stack - Print backtrace AfterThe breakpoint or at a crash  finish - Execute a functionToThe end after a breakpoint  frame - Print the line number in while debugging  call <function> - Calling functions while debugging
  • 58.
    GDBTIPS ANDTRICKS  macroexpand <macro(args)> - Expand the macro (Need –E option during build)  Debugging a process that call fork system call, you want to continue with the child or the parent set follow-fork-mode child/parent set detach-on-fork on  Debugging a multithreaded application - while a breakpoint hits, the debugger will freeze all the threads.  set non-stop on – Let other threads run
  • 59.
    GDBTIPS ANDTRICKS  infolocals -View all local variables  list -- view source  rbreak -- break on function matching regular expression  set print object on for polymorphic elements
  • 60.
    GDB AND REVERSEDEBUGGING  reverse-continue ('rc') - Continue program being debugged but run it in reverse  reverse-finish- Execute backward until just before the selected stack frame is called  reverse-next ('rn’) - Step program backward, proceeding through subroutine calls.  reverse-nexti ('rni') - Step backward one instruction, but proceed through called subroutines.  reverse-step ('rs') - Step program backward until it reaches the beginning of a previous source line  reverse-stepi - Step backward exactly one instruction  set exec-direction (forward/reverse) - Set direction of execution.
  • 61.
  • 62.
  • 63.
    GDB QUICK REFERENCE G D B Version 4 Essential Commands gdb program [core] debug program [using coredump core] b [file:]function run [arglist] bt p expr c n s set breakpoint at function [in file] start your program [with arglist] backtrace: display program stack display the value of an expression continue running your program next line, stepping over function calls next line, stepping into function calls Starting G DB gdb gdb program gdb program core gdb --help start GDB, with no debugging ftles begin debugging program debug coredump core produced by program describe command line options exit GDB; also q or EOF(eg C-d) Stopping G DB quit INTERRUPT (eg C-c) terminate current command, or send to running process Getting Help help help class help command list classes of commands one-line descriptions for commands in class describe command Executing your Program run arglist run run . . . <inf >outf k i l l start your program with arglist start your program with current argument list start your program with input, output redirected kill running program t t y dev s et args arglist s et args show args use dev as stdin and stdout for next run specify arglist for next run specify empty argument list display argument list show env show env var s et env var string unset env var show all environment variables show value of environment variable var set environment variable var remove var from environment Shell Commands cd dir pwd make . . . shell cmd change working directory to dir Print working directory call “make” execute arbitrary shell command string [ ] surround optional arguments . . . show one or more arguments §c1998 Free Software Foundation, Inc. Permissions on back Breakpoints and Watchpoints set breakpoint at line number [in file] eg: break main.c:37 set breakpoint at func [in file] set break at offset lines from current stop break [file:]line b [file:]line break [file:]func break +offset break -offset break *addr break break . . . i f expr cond n [expr] tbreak . . . rbreak regex watch expr catch event info break info watch set breakpoint at address addr set breakpoint at next instruction break conditionally on nonzero expr new conditional expression on breakpoint n; make unconditional if no expr temporary break; disable when reached break on all functions matching regex set a watchpoint for expression expr break at event, which may be catch, throw, exec, fork, vfork, load, or unload. show deftned breakpoints show deftned watchpoints clear clear [file:]fun clear [file:]line delete [n] disable [n] enable [n] enable once [n] enable del [n] ignore n count delete breakpoints at next instruction delete breakpoints at entry to fun() delete breakpoints on source line delete breakpoints [or breakpoint n] disable breakpoints [or breakpoint n] enable breakpoints [or breakpoint n] enable breakpoints [or breakpoint n]; disable again when reached enable breakpoints [or breakpoint n]; delete when reached ignore breakpoint n, count times commands n [silent] command-list execute GDB command-list every time end breakpoint n is reached. [silent suppresses default display] end of command-list print trace of all frames in stack; or of n frames—innermost if n>0, outermost if n<0 select frame number n or frame at address n; if no n, display current frame select frame n frames up select frame n frames down describe selected frame, or frame at addr arguments of selected frame Program Stack backtrace [n] bt [n] frame [n] up n down n info frame [addr] info args info locals info reg [rn]. .. info all-r eg [rn] local variables of selected frame register values [for regs rn] in selected frame; all-r eg includes floating point Execution Control continue running; if count specifted, ignore this breakpoint next count times execute until another line reached; repeat count times if specifted step by machine instructions rather than source lines execute next line, including any function calls next machine instruction rather than source line run until next instruction (or location) run until selected stack frame returns continue [count] c [count] step [count] s [count] stepi [count] s i [count] next [count] n [count] nexti [count] ni [count] u n til [location] finish return [expr] pop selected stack frame without signal num jump line jump *address s et var=expr executing [setting return value] resume execution with signal s (none if 0) resume execution at specifted line number or address evaluate expr without displaying it; use for altering program variables Display print [/f ] [expr] p [/f ][expr] x d u o t a c f c a ll [/f ] expr x [/Nuf ] expr N u f disassem [addr] show value of expr [or last value $] according to format f: hexadecimal signed decimal unsigned decimal octal binary address, absolute and relative character floating point like print but does not display void examine memory at address expr; optional format spec follows slash count of how many units to display unit size; one of b individual bytes h halfwords (two bytes) wwords (four bytes) g giant words (eight bytes) printing format. Any print format, or s null-terminated string i machine instructions display memory as machine instructions Automatic Display display [/f ] expr show value of expr each time program stops [according to format f ] display undisplay n disable disp n enable disp n info display display all enabled expressions on list remove number(s) n from list of automatically displayed expressions disable display for expression(s) number n enable display for expression(s) number n numbered list of display expressions
  • 64.
    Expressions expr addr@len file: : nm {type}addr $ $n $$ $$n $ $ $var anexpression in C, C + + , or Modula-2 (including function calls), or: an array of len elements beginning at addr a variable or function nm deftned in file read memory at addr as specifted type most recent displayed value nth displayed value displayed value previous to $ nth displayed value back from $ last address examined with x value at address $ convenience variable; assign any value show values [n] show conv show last 10 values [or surrounding $n] display all convenience variables Symbol Table info address s info func [regex] info var [regex] whatis [expr] ptype [expr] ptype type show where symbol s is stored show names, types of deftned functions (all, or matching regex) show names, types of global variables (all, or matching regex) show data type of expr [or $] without evaluating; ptype gives more detail describe type, struct, union, or enum GDB Scripts source script read, execute GDB commands from ftle script define cmd command-list end document cmd help-text end create new GDB command cmd; execute script deftned by command-list end of command-list create online documentation for new GDB command cmd end of help-text Signals handle signal act print noprint stop nostop pass nopass info signals specify GDB actions for signal: announce signal be silent for signal halt execution on signal do not halt execution allow your program to handle signal do not allow your program to see signal show table of signals, GDB action for each Debugging Targets target type param connect to target machine, process, or ftle help target attach param detach display available targets connect to another process release target from GDB control Controlling G DB s et param value show param set one of GDB’s internal parameters display current setting of parameter Parameters understood by s et and show: complaint limit confirm on/off editing on/off height lpp language lang li s t s i z e n prompt str radix base verbose on/off width cpl write on/off number of messages on unusual symbols enable or disable cautionary queries control readline command-line editing number of lines before pause in display Language for GDB expressions (auto, c or modula-2) number of lines shown by l i s t use str as GDB prompt octal, decimal, or hex number representation control messages when loading symbols number of characters before line folded Allow or forbid patching binary, core ftles (when reopened with exec or core) groups with the following options:history . .. h . .. h exp off/on h f i l e filename h size size h save off/on print . .. p . .. disable/enable readline history expansion ftle for recording GDB command history number of commands kept in history list control use of external ftle for command history groups with the following options: p address on/off print memory addresses in stacks, values p array off/on compact or attractive format for arrays p demangl on/off source (demangled) or internal form for C + + symbols p asm-dem on/off demangle C + + symbols in machine- instruction output p elements limit number of array elements to display p object on/off p pretty off/on p union on/off p vtbl off/on print C + + derived types for objects struct display: compact or indented display of union members display of C + + virtual function tables show commands show commands n show commands + show last 10 commands show 10 commands around number n show next 10 commands Working Files f i l e [file] core [file] exec [file] symbol [file] load file add-sym file addr info f i le s path dirs show path info share use file for both symbols and executable; with no arg, discard both read file as coredump; or discard use file as executable only; or discard use symbol table from file; or discard dynamically link file and add its symbols read additional symbols from file, dynamically loaded at addr display working ftles and targets in use add dirs to front of path searched for executable and symbol ftles display executable and symbol ftle path list names of shared libraries currently loaded Source Files d ir names d ir show d ir add directory names to front of source path clear source path show current source path l i s t l i s t - l i s t lines [file:]num [file: ]function +off -off *address l i s t f,l info line num info source info sources forw regex rev regex show next ten lines of source show previous ten lines display source surrounding lines, specifted as: line number [in named ftle] beginning of function [in named ftle] off lines after last printed off lines previous to last printed line containing address from line f to line l show starting, ending addresses of compiled code for source line num show name of current source ftle list all source ftles in use search following source lines for regex search preceding source lines for regex G DB under GNU Emacs M-x gdb C-h m M-s M-n M-i C-c C-f M-c M-u M-d C-x & C-x SPC run GDB under Emacs describe GDB mode step one line (step) next line (next) step one instruction (stepi) ftnish current stack frame (finish) continue (cont) up arg frames (up) down arg frames (down) copy number from point, insert at end (in source ftle) set break at point G DB License show copying show warranty Display GNU General Public License There is NO W ARRANTY for GDB. Display full no-warranty statement. Copyright §c 1991, ’92, ’93, ’98 Free Software Foundation, Inc. Rol a nd H. Pesch The author assumes no responsibility for any errors on this card. This card ma y b e freely distribut ed under t he t er ms of t he G N U General Public License. Please contribute t o development of this card by annotating it. Improvements can b e sent t o bug-gdb@gnu.org. G D B itself is free software; you are welcome t o distribute copies of it under t he t er ms of t he G N U General Public License. There is absolutely no warranty for G D B.
  • 65.
  • 66.
    ITS ALLYOURS!! Thank you… Enjoythe Journey as importantly as the Destination itself!! SenthilKumar Selvaraj senkumar@juniper.net https://www.linkedin.com/in/tiruppursenthil http://randomstufforganized.wordpress.com/