Downloaded 197 times


![Exploratory data visualization Data analysis approaches: Classical: Problem > Data > Model > Analysis > Conclusions EDA: [Exploratory Data Analysis] Problem > Data > Analysis > Model > Conclusions Bayesian: Problem > Data > Model > Prior distribution > Analysis > Conclusions EDA = approach, not a set of techniques](https://image.slidesharecdn.com/dataviz-v2-150716094946-lva1-app6891/75/Data-Visualization-in-Data-Science-9-2048.jpg)

![Visual encoding of data Bandwidth of our senses: [Tor Norretranders]](https://image.slidesharecdn.com/dataviz-v2-150716094946-lva1-app6891/75/Data-Visualization-in-Data-Science-19-2048.jpg)


The document discusses the importance of data visualization in data science, highlighting its role at various stages of the data science process and how it aids in understanding data and engaging audiences. It covers visual encoding techniques, biases in visualization, and the tools available for creating effective visualizations. Additionally, it outlines design principles and narrative structures essential for conveying insights through data.
Introduction to Data Visualization, its importance, and speaker profile.
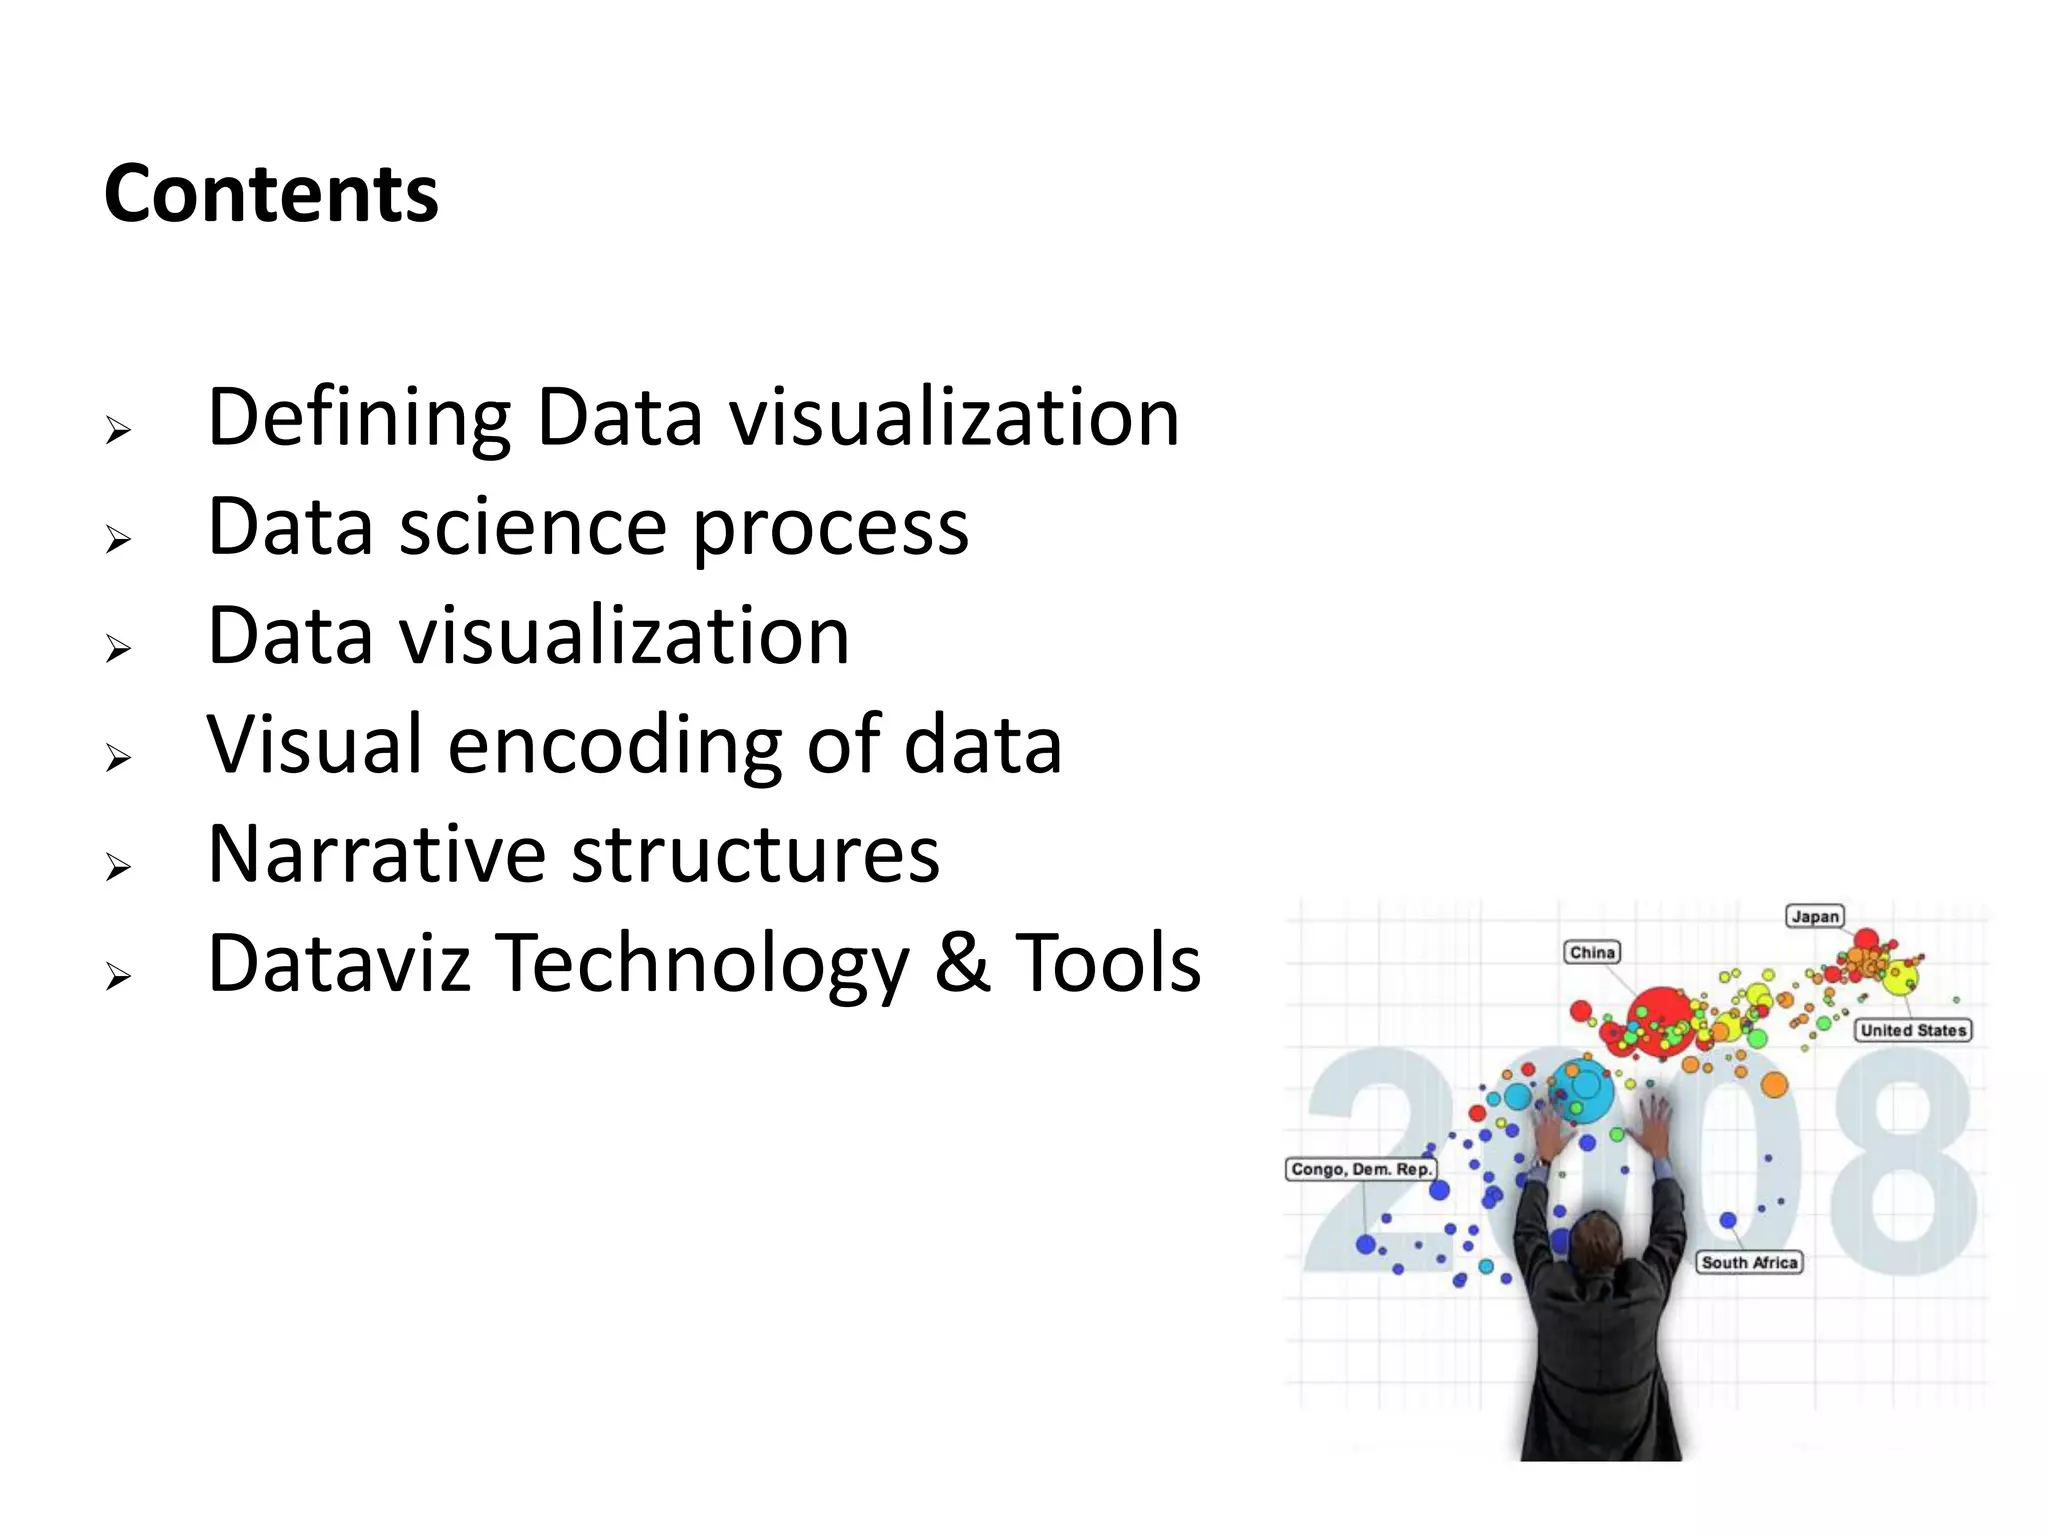
Outline of topics: defining data visualization, data science process, visual encoding, narrative structures and tools.
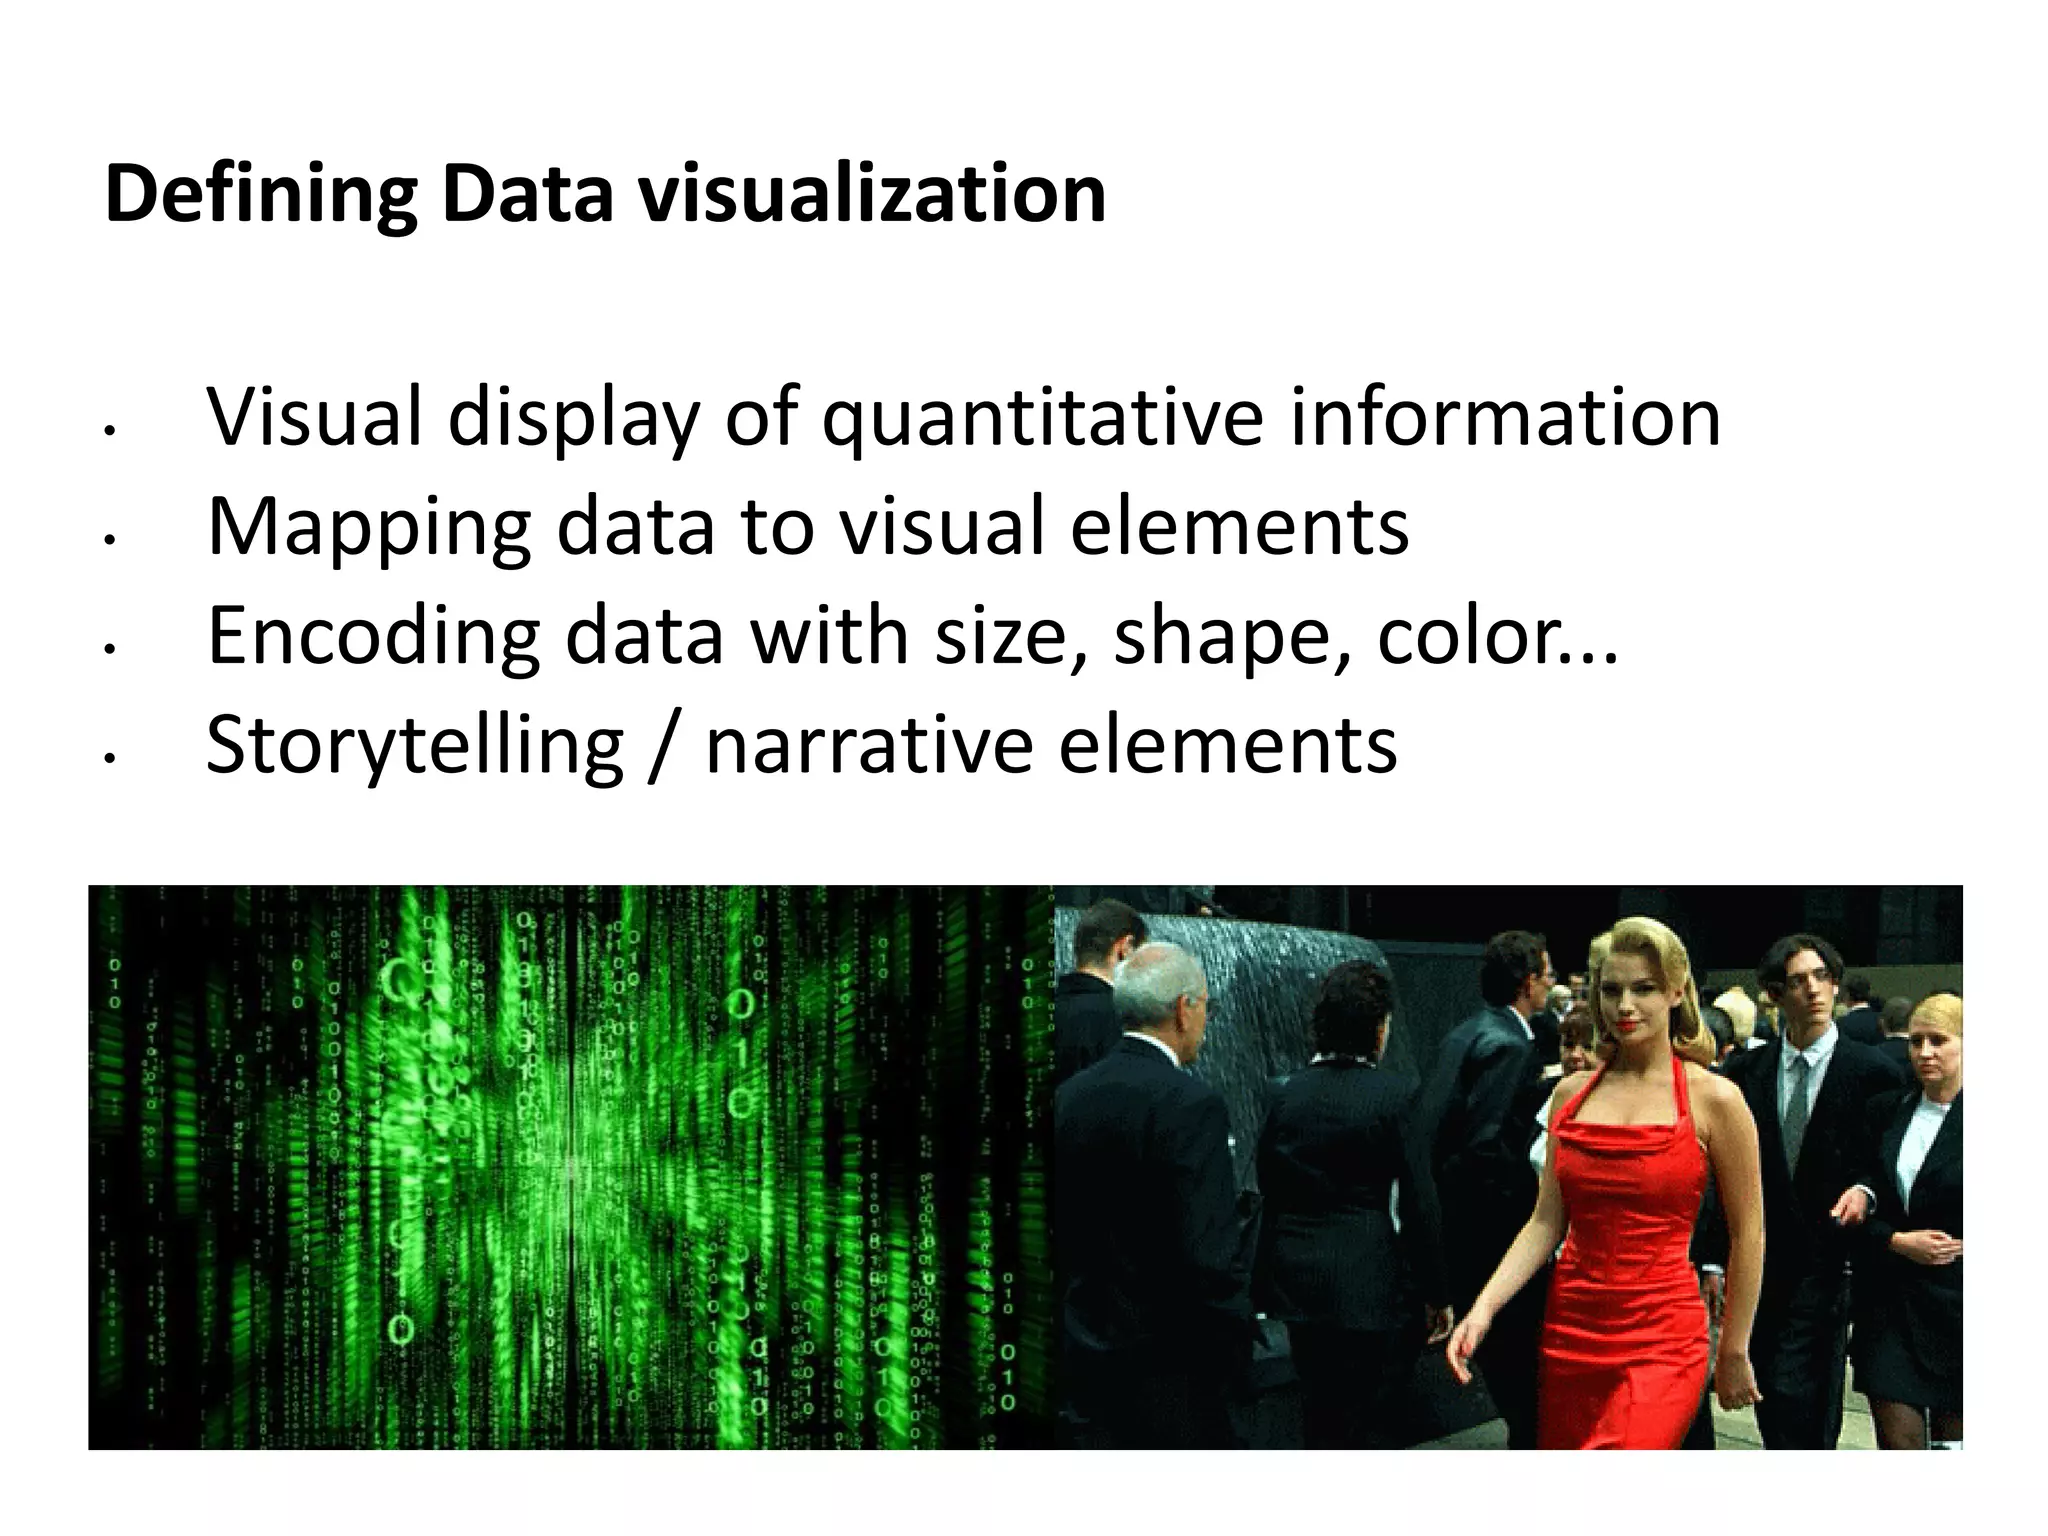
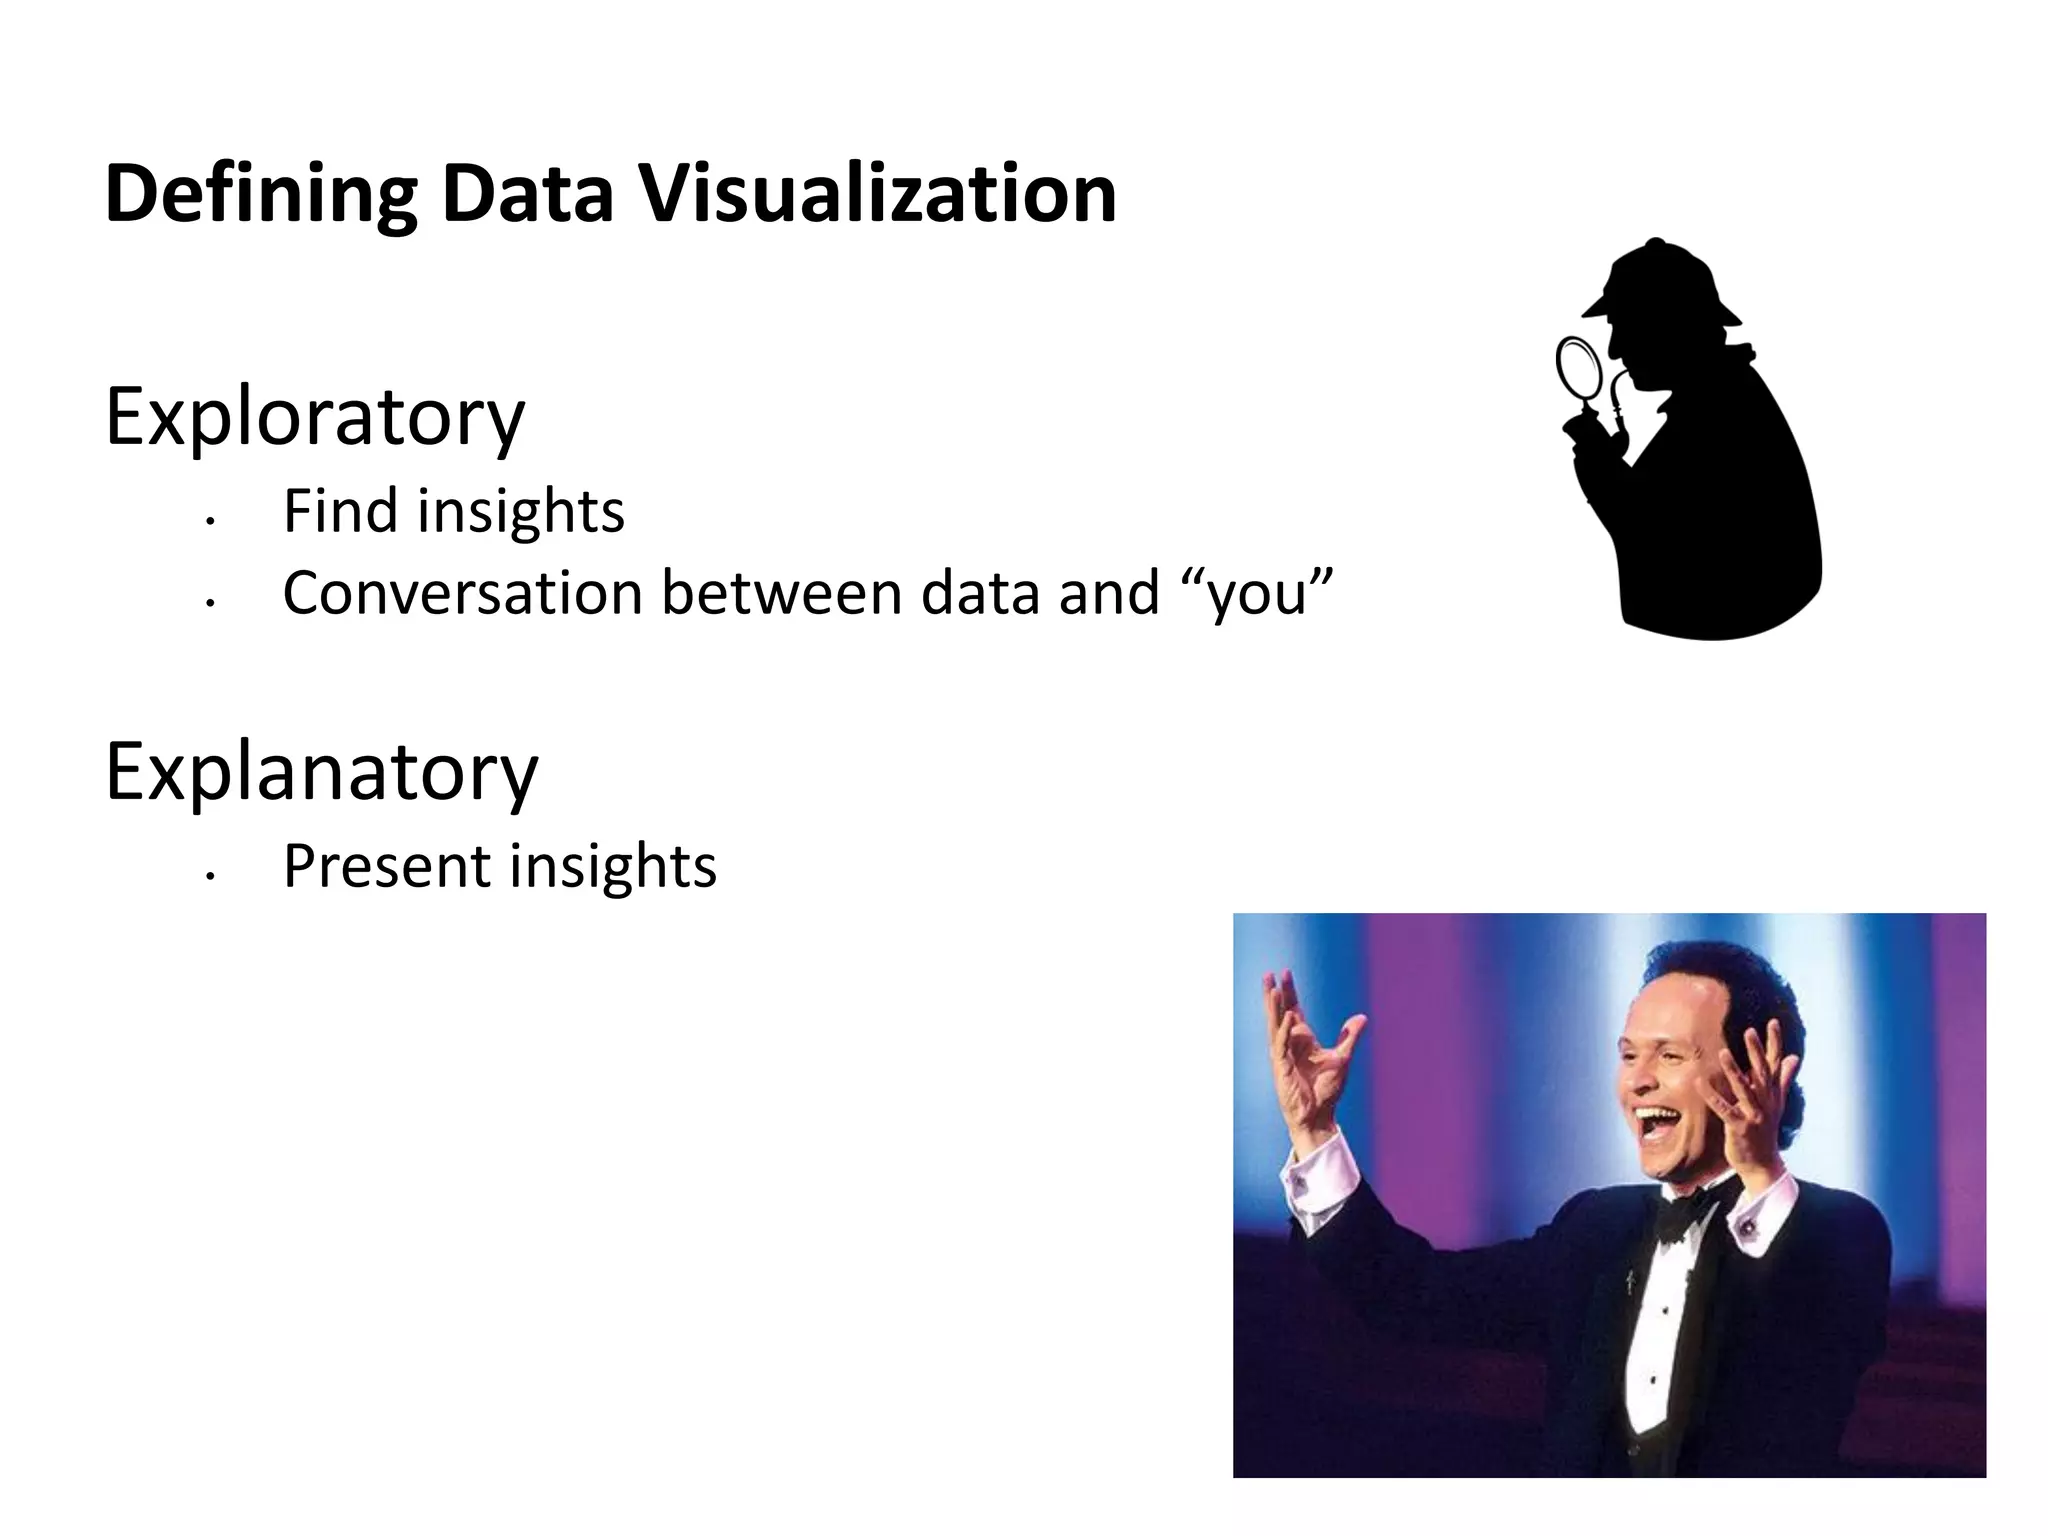
Data visualization defined through visual displays and the roles of exploratory and explanatory visuals.
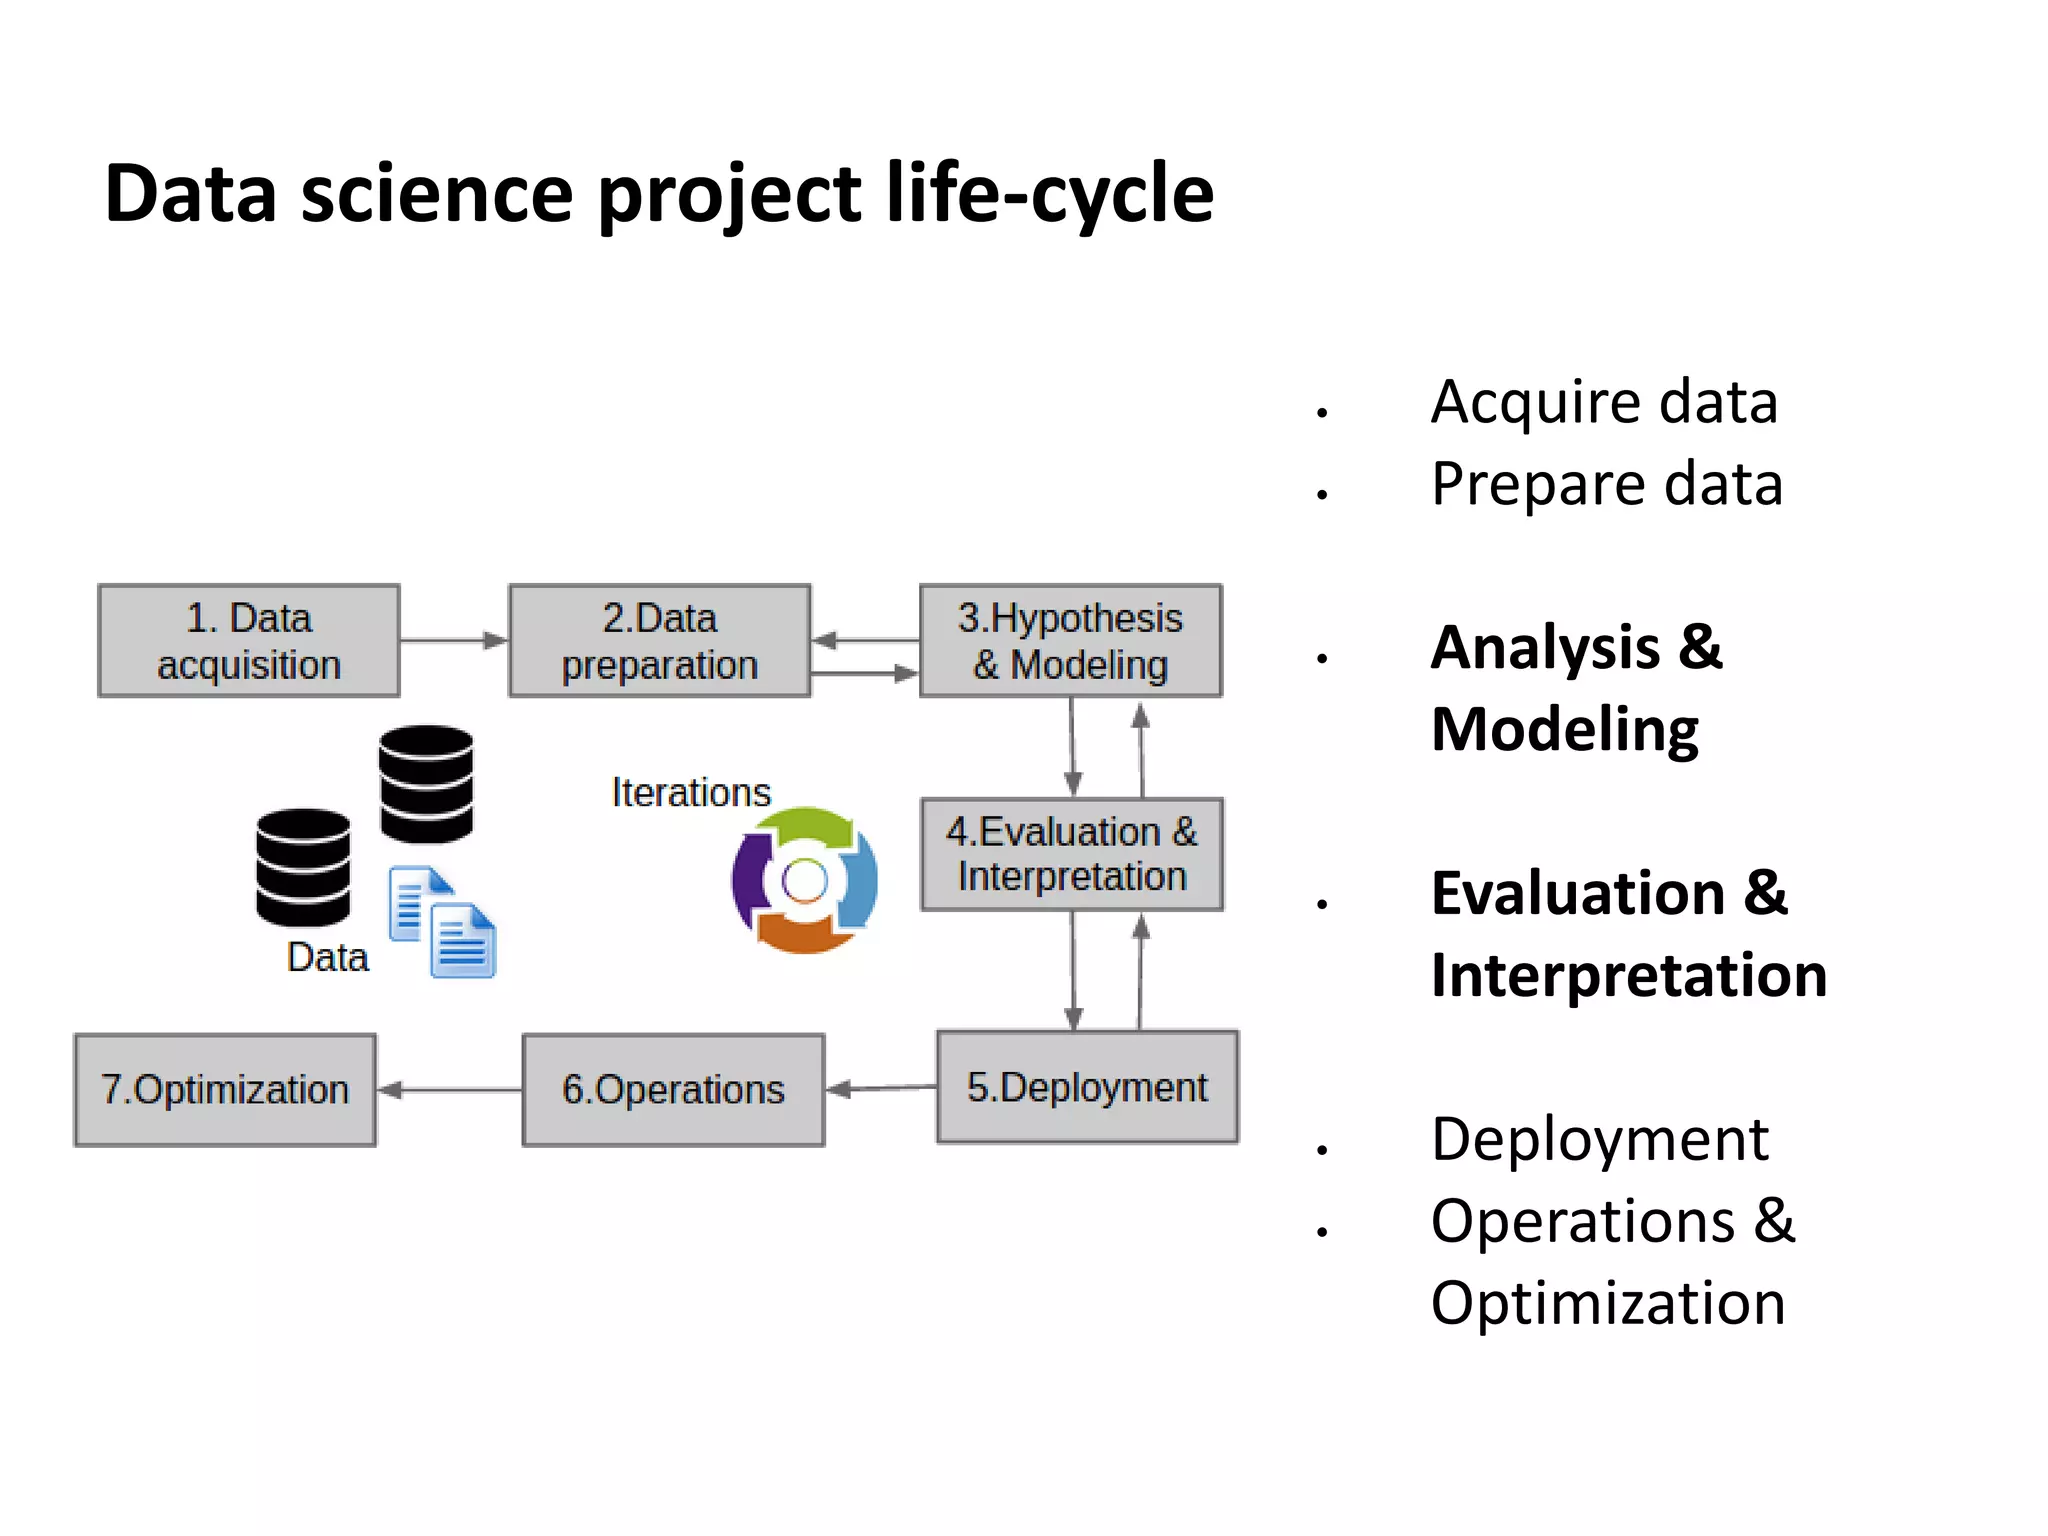
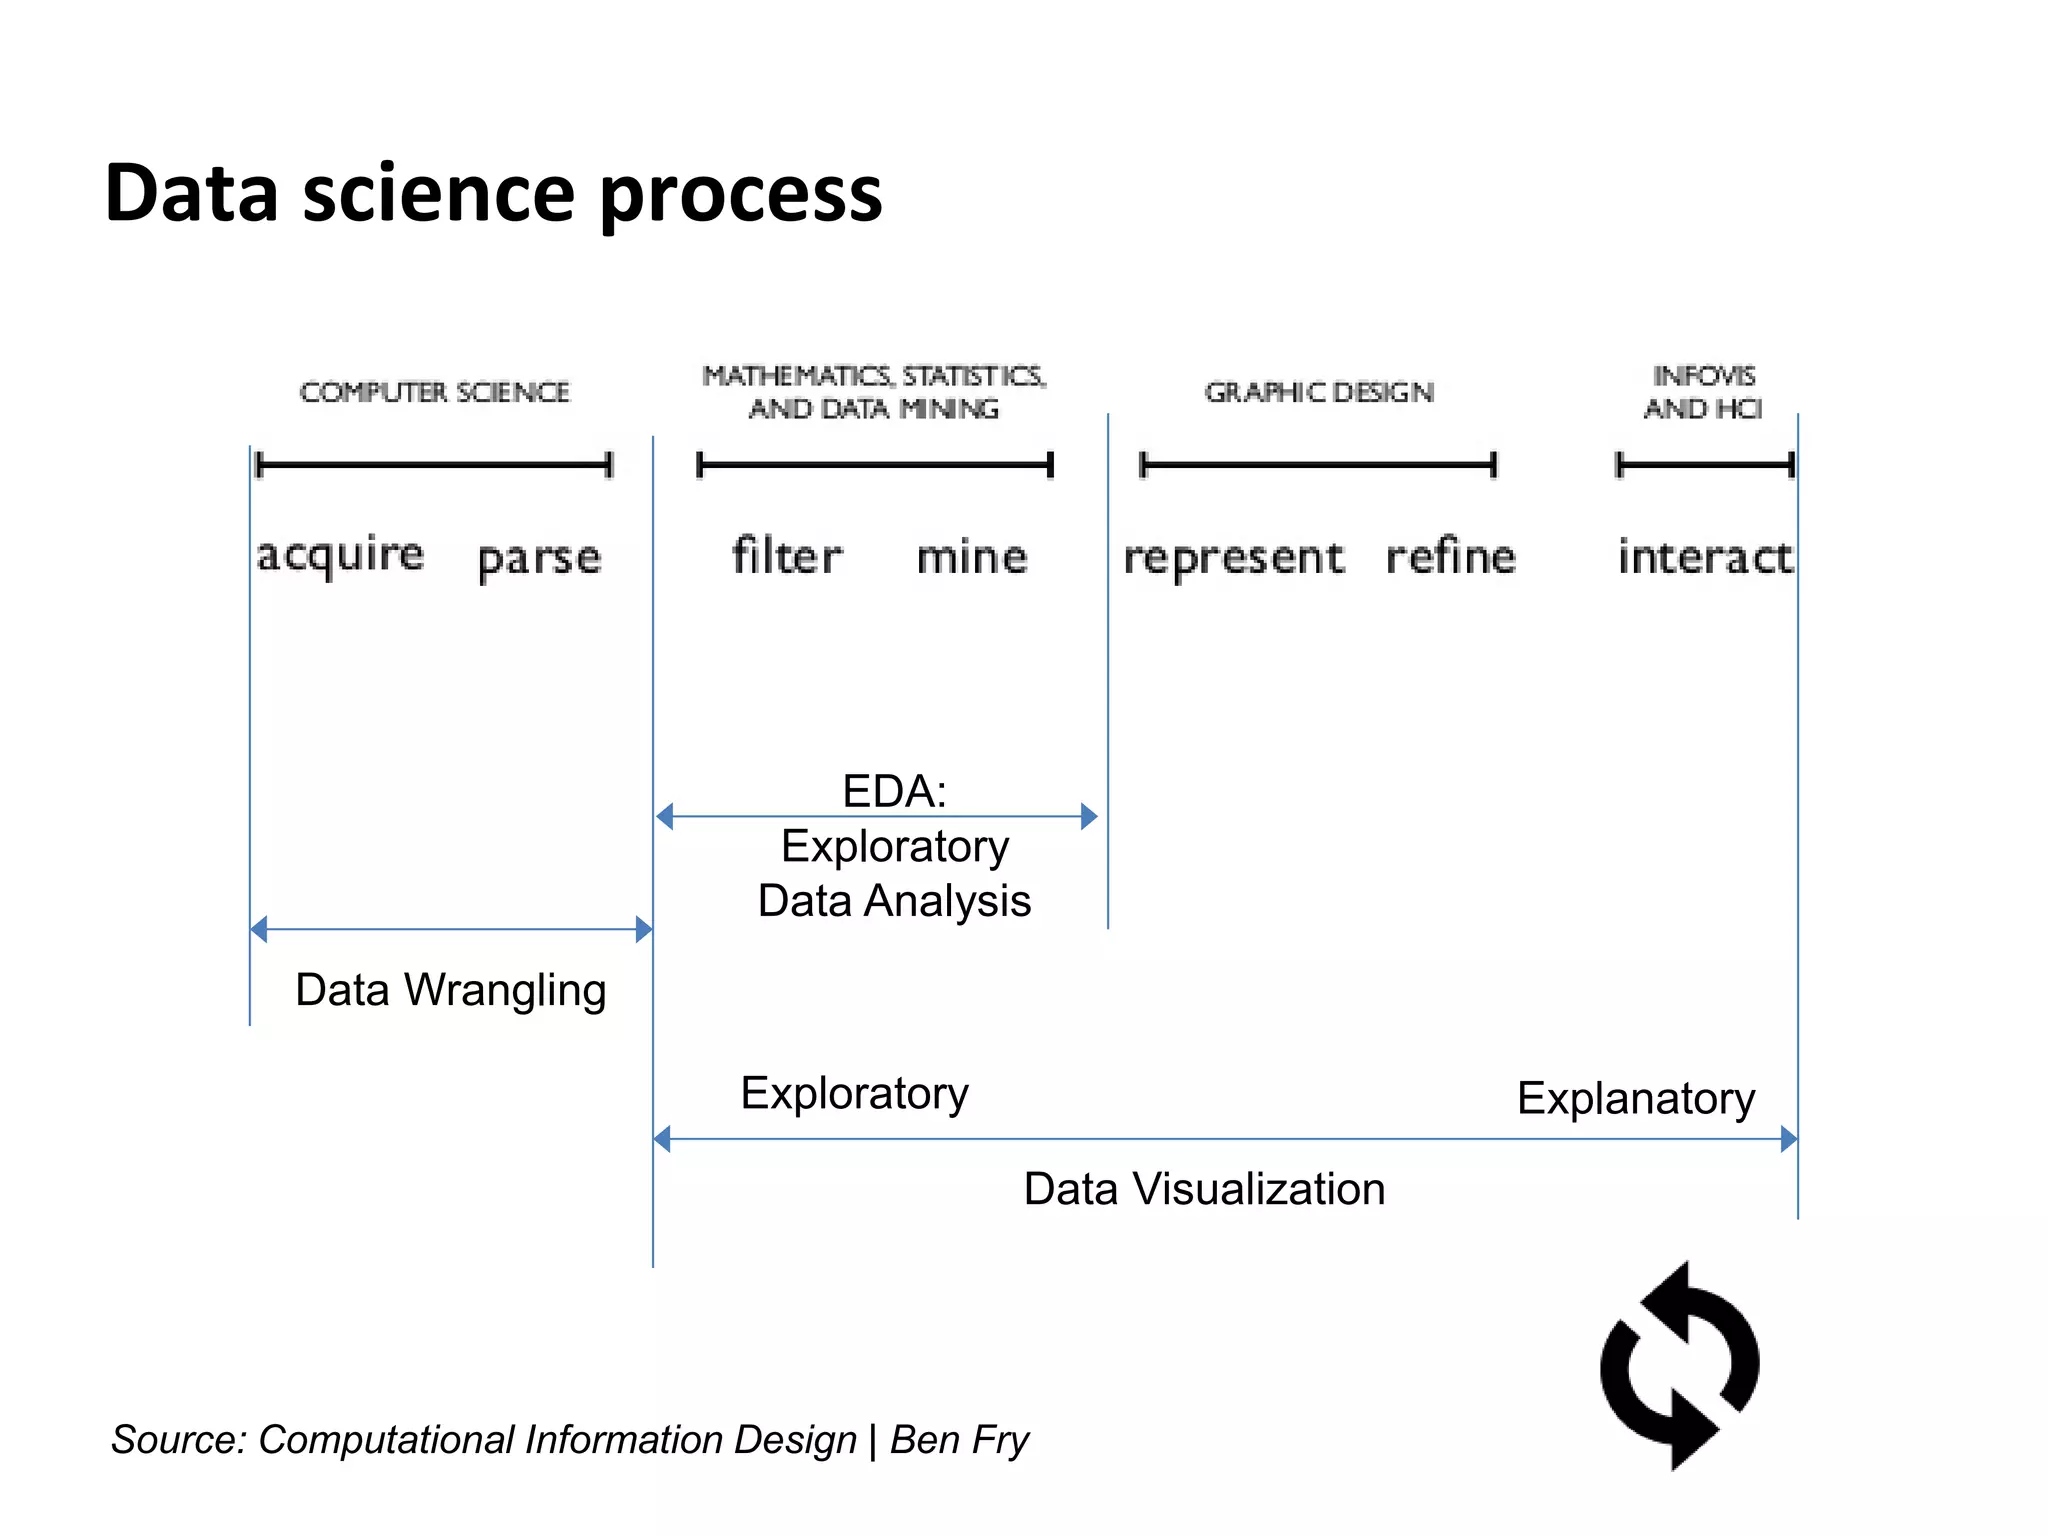
Lifecycle of a data science project, including stages from acquisition to optimization, highlighting data wrangling and exploratory data analysis.
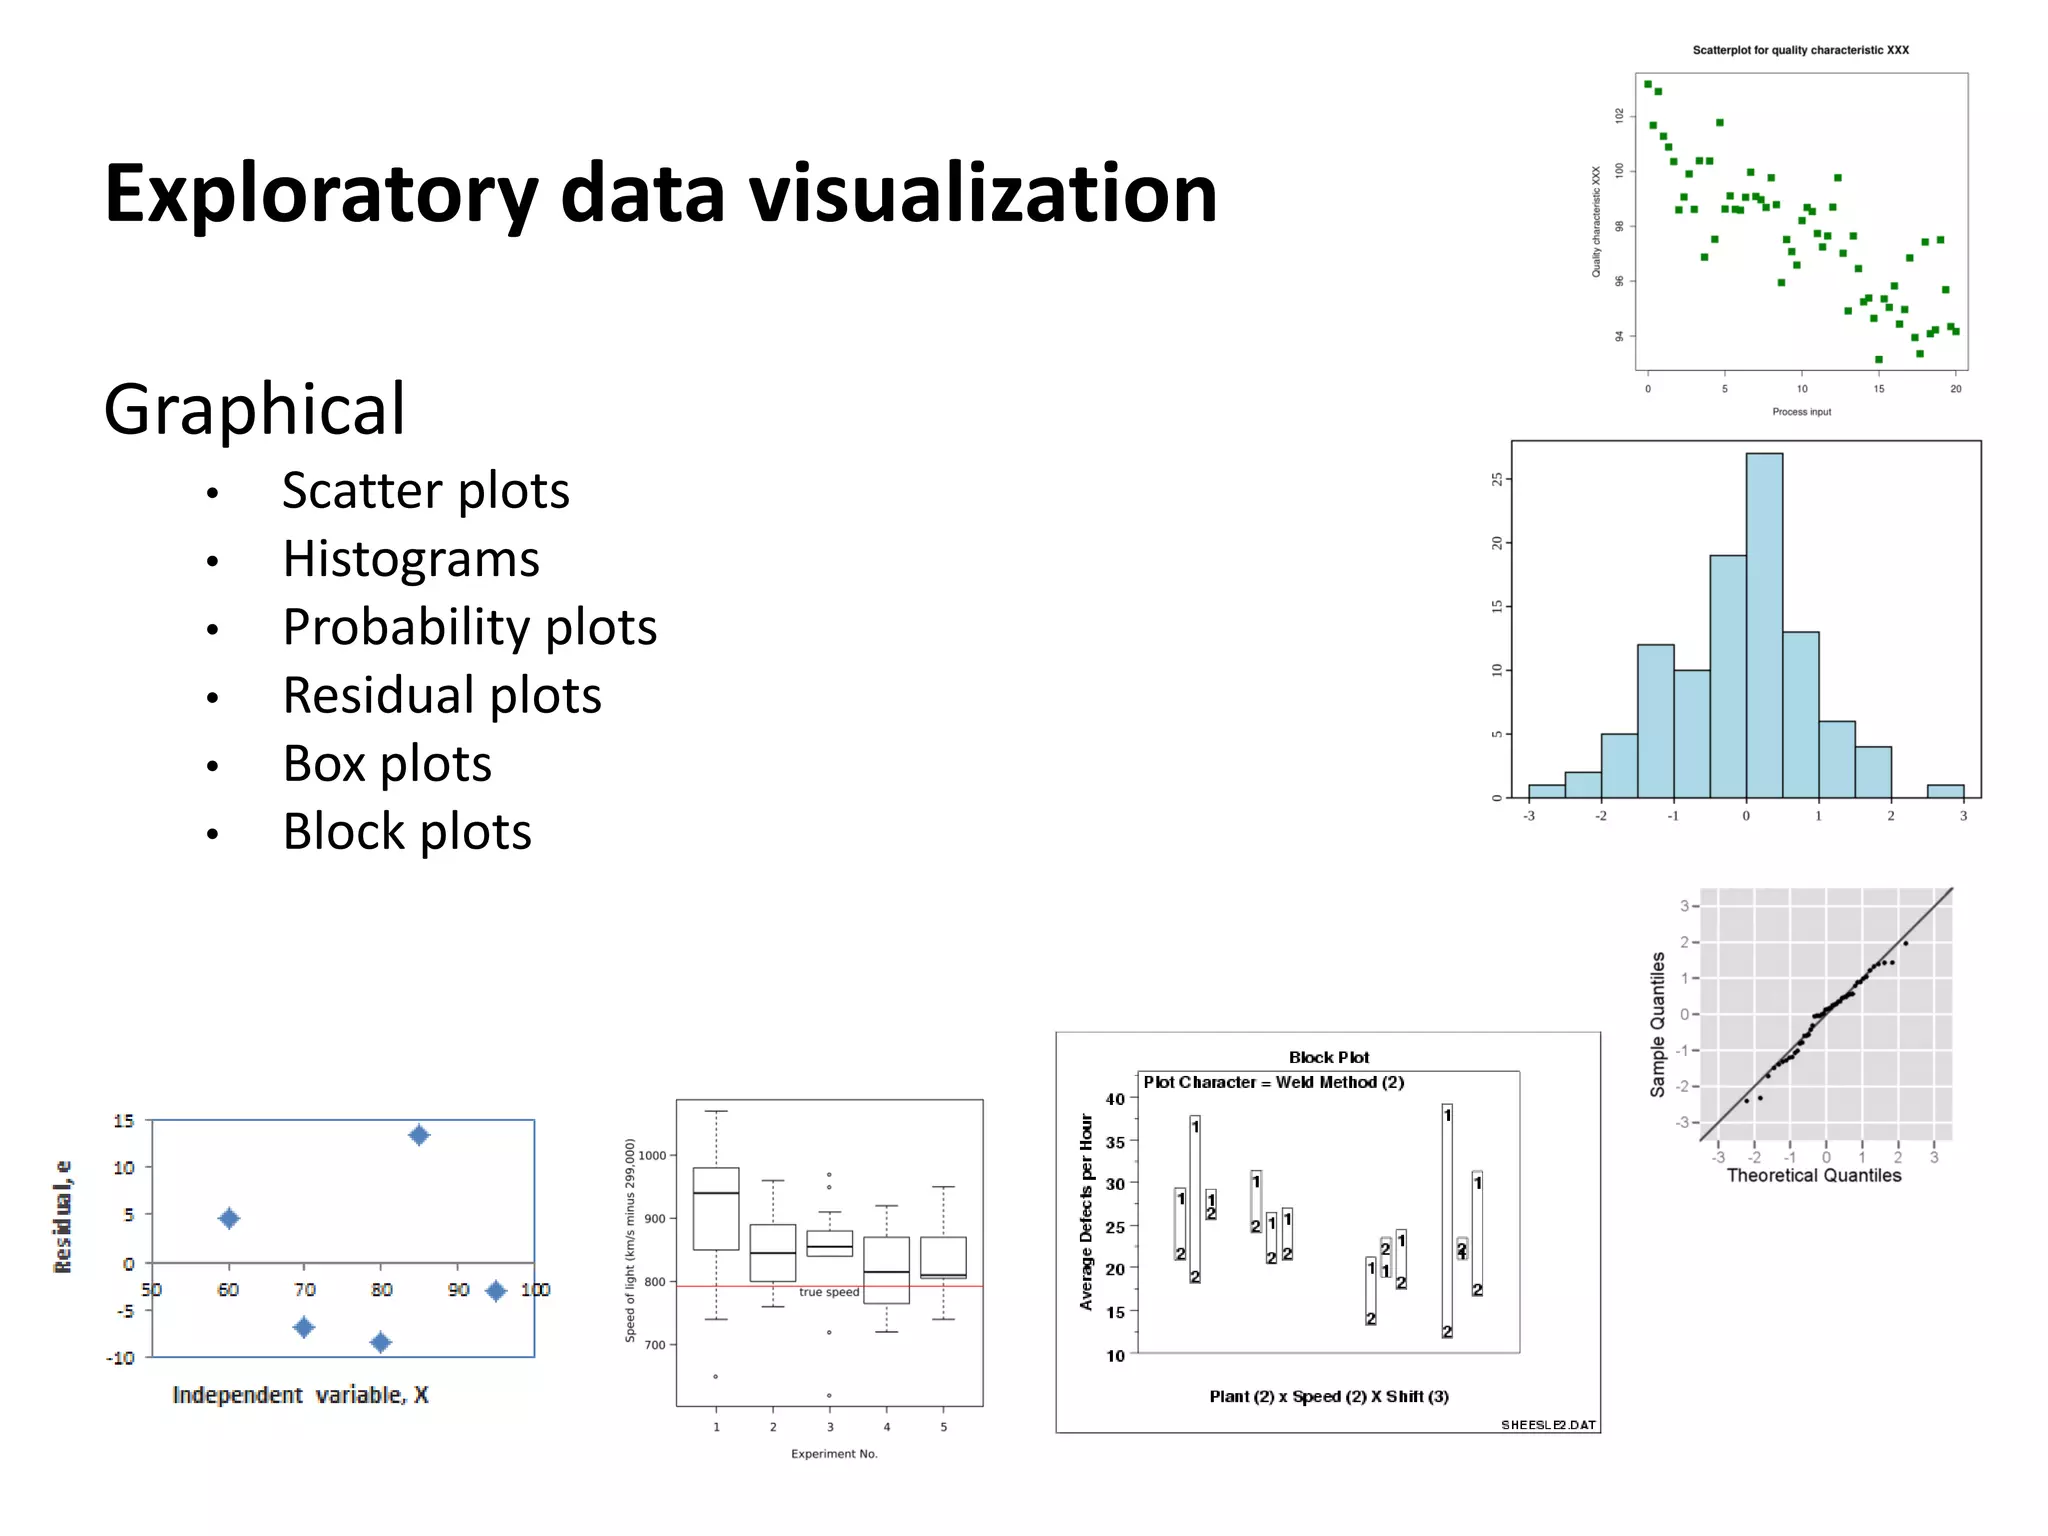
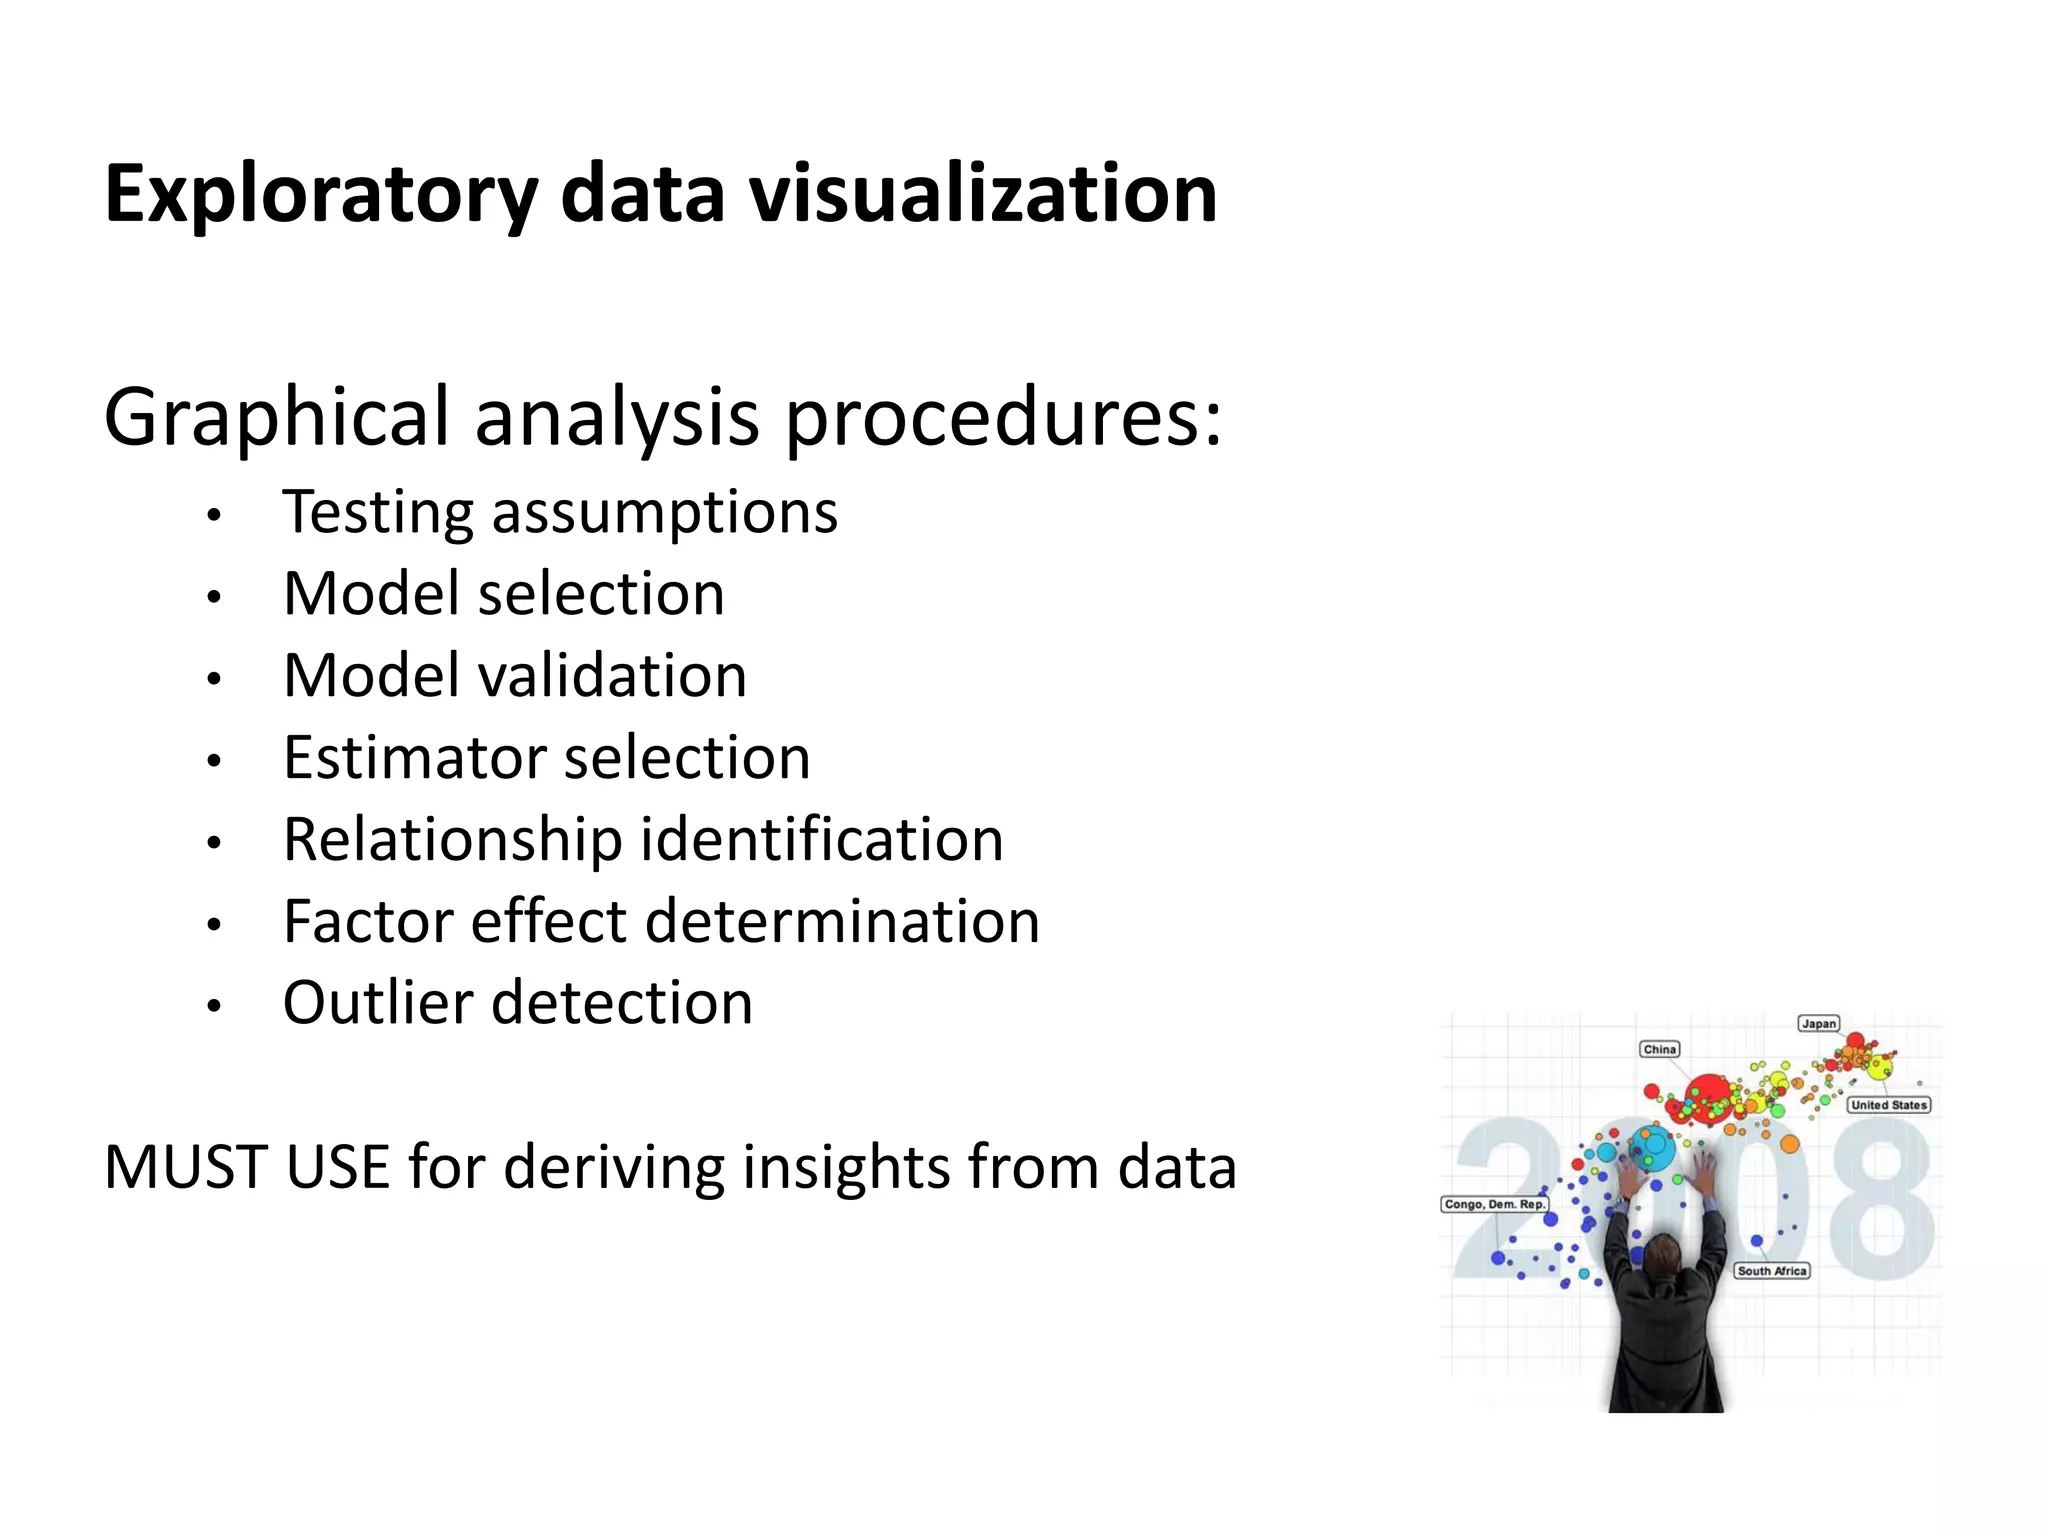
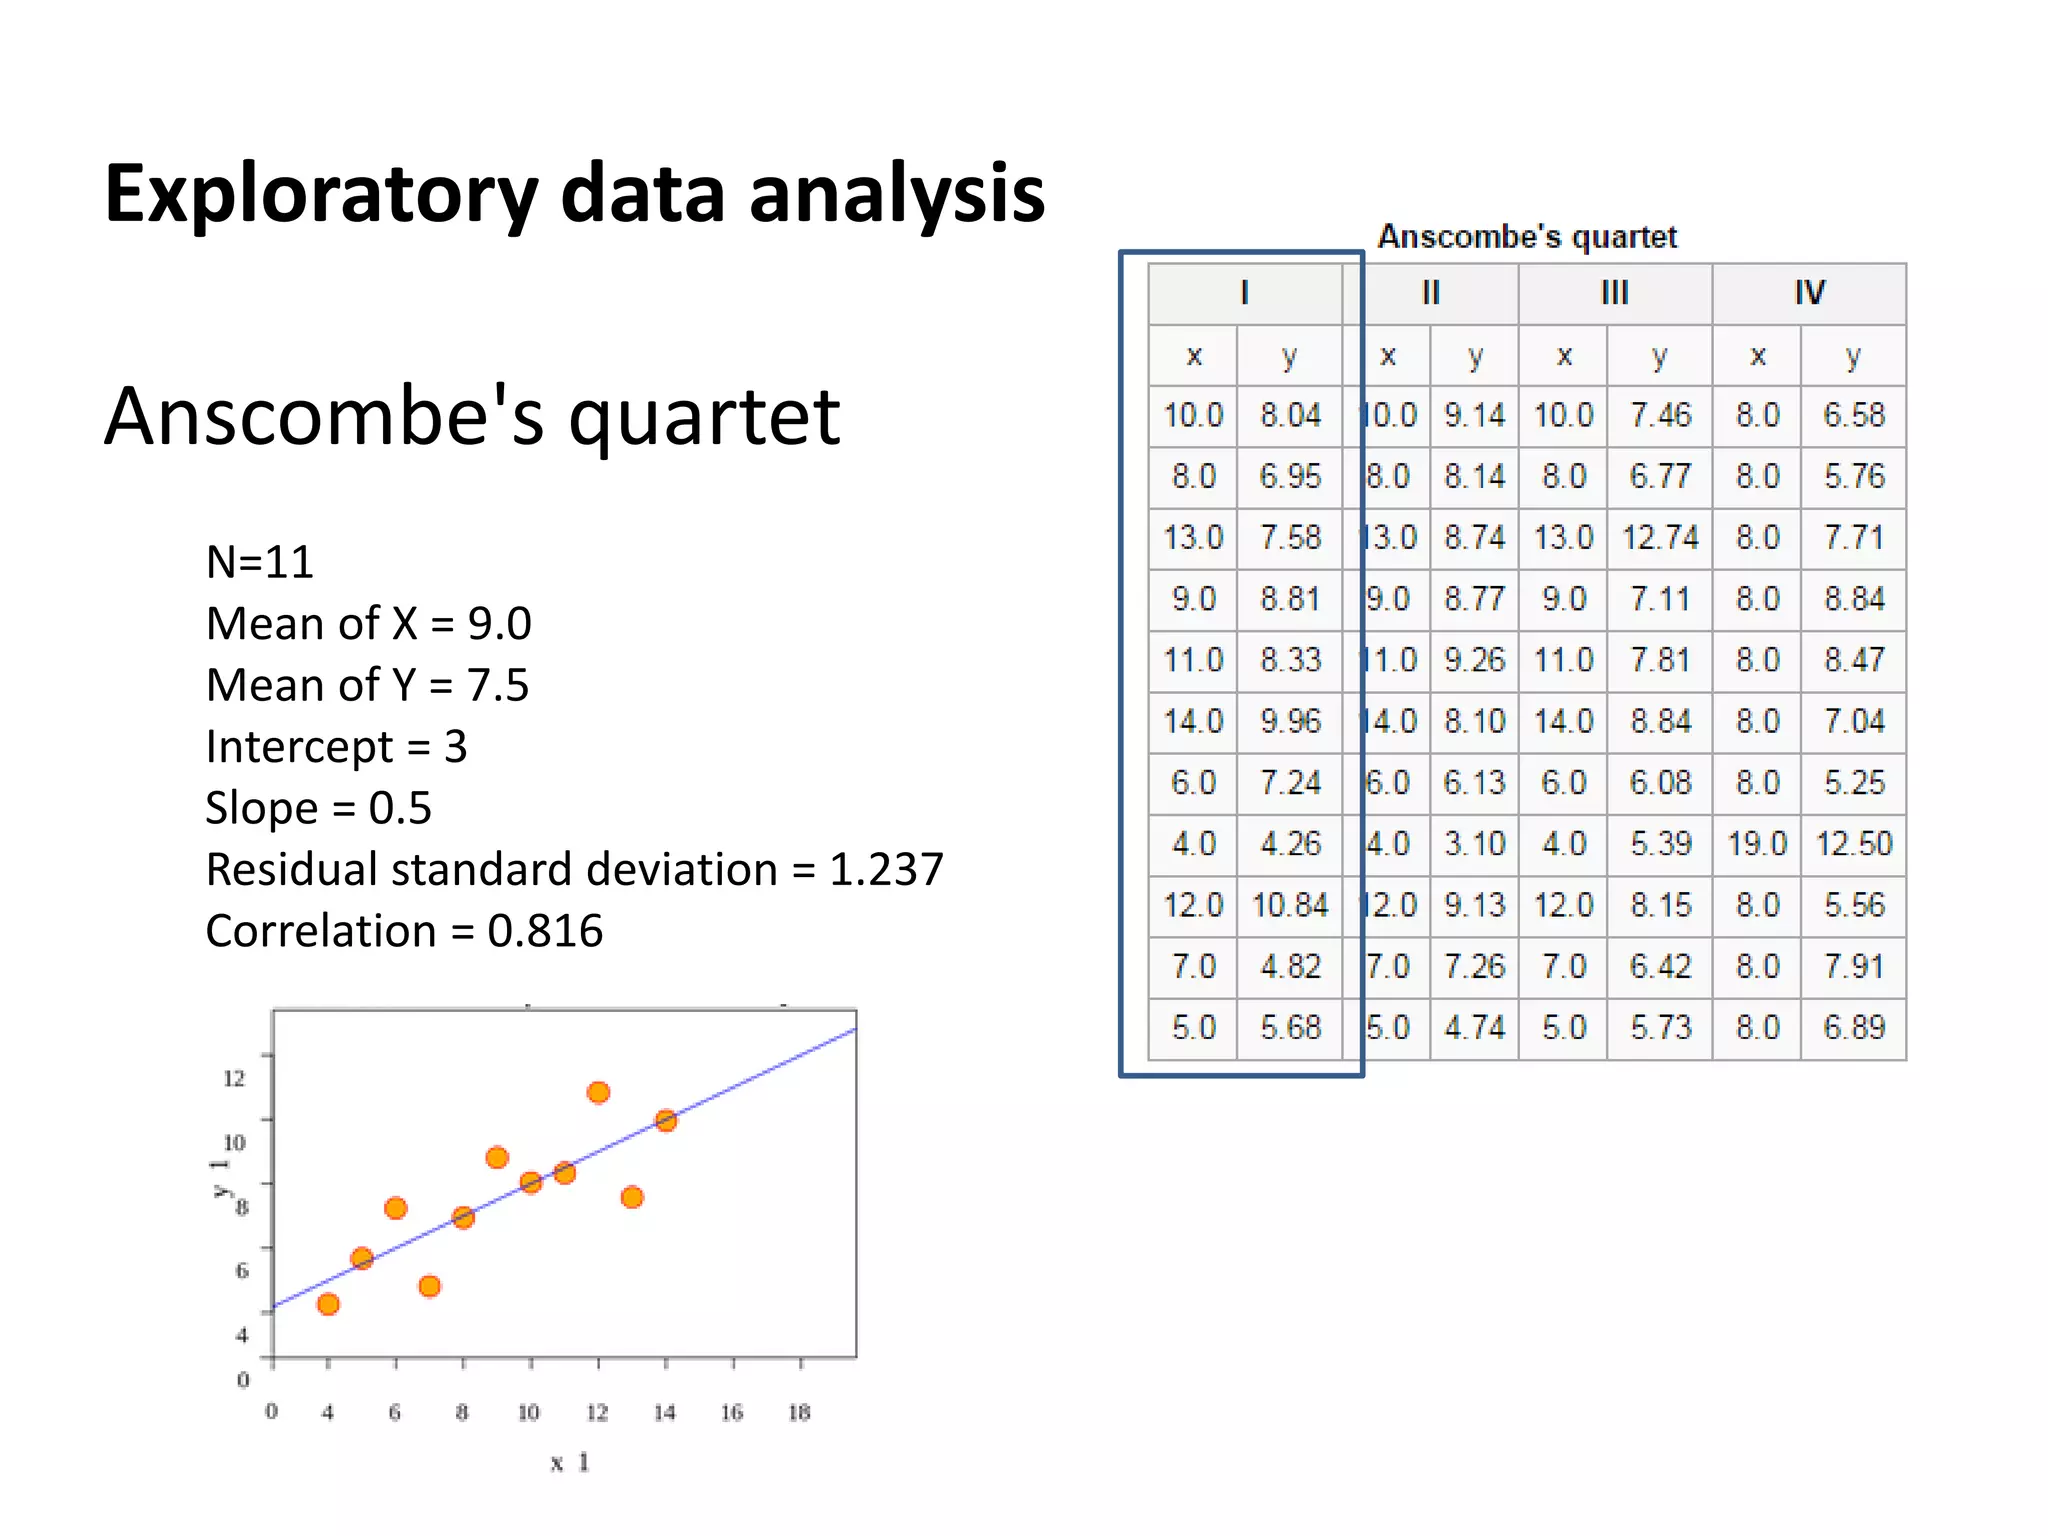
Different data analysis approaches with emphasis on exploratory data visualization techniques using statistical methods.
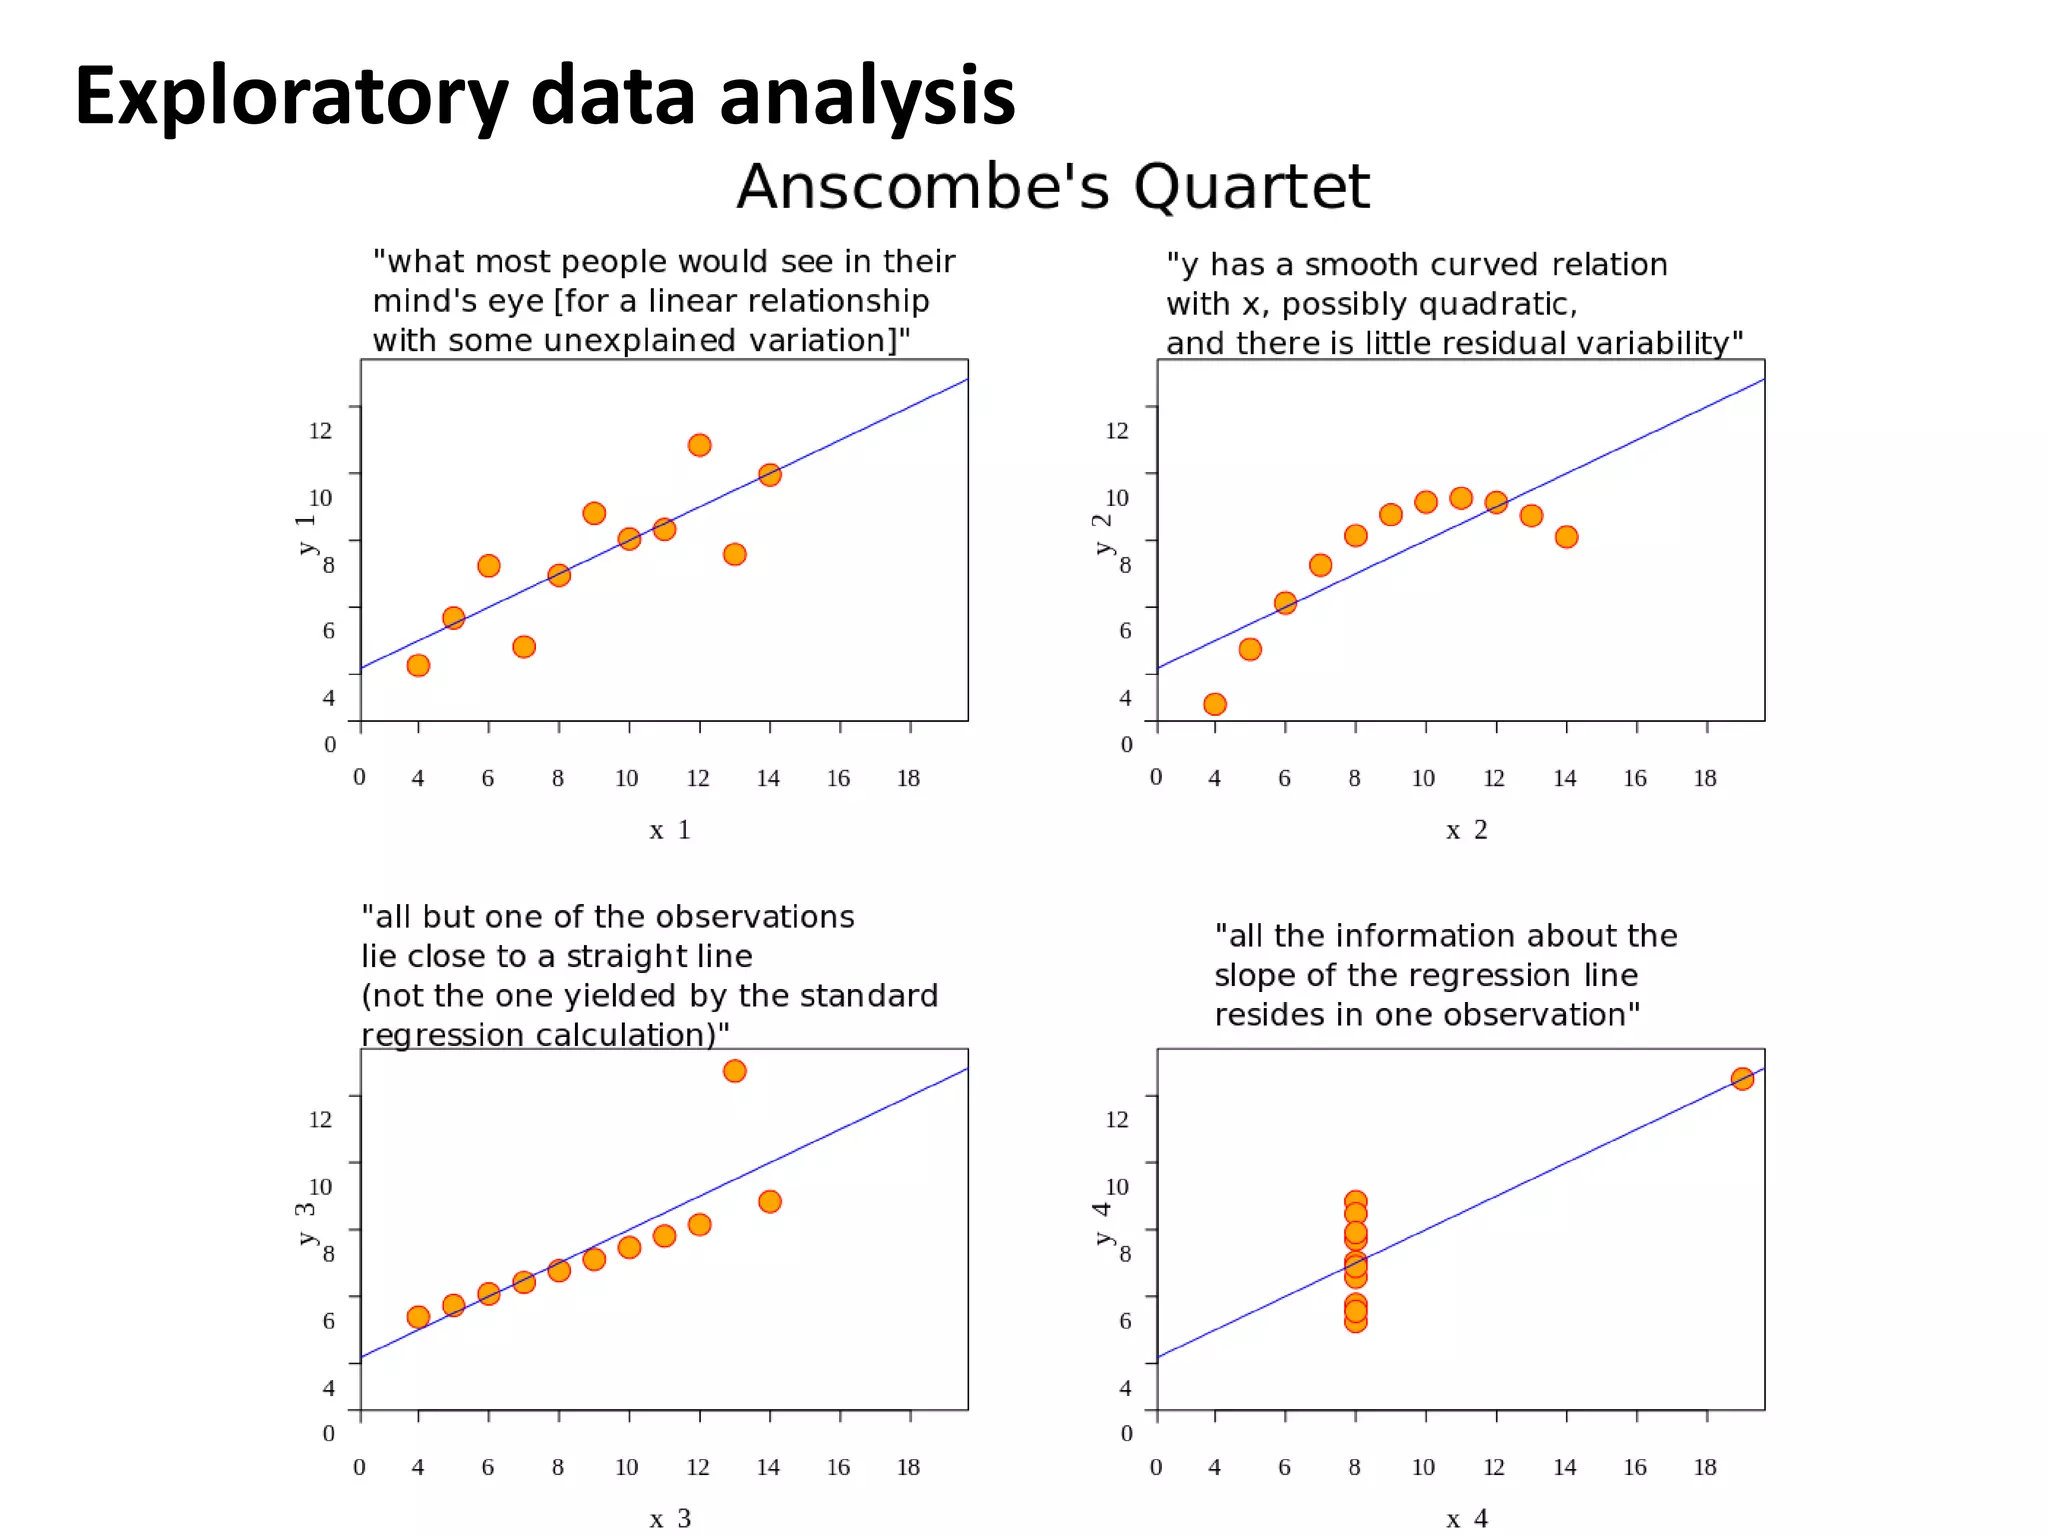
Example of Anscombe's quartet illustrating the importance of visual representation in exploratory data analysis.
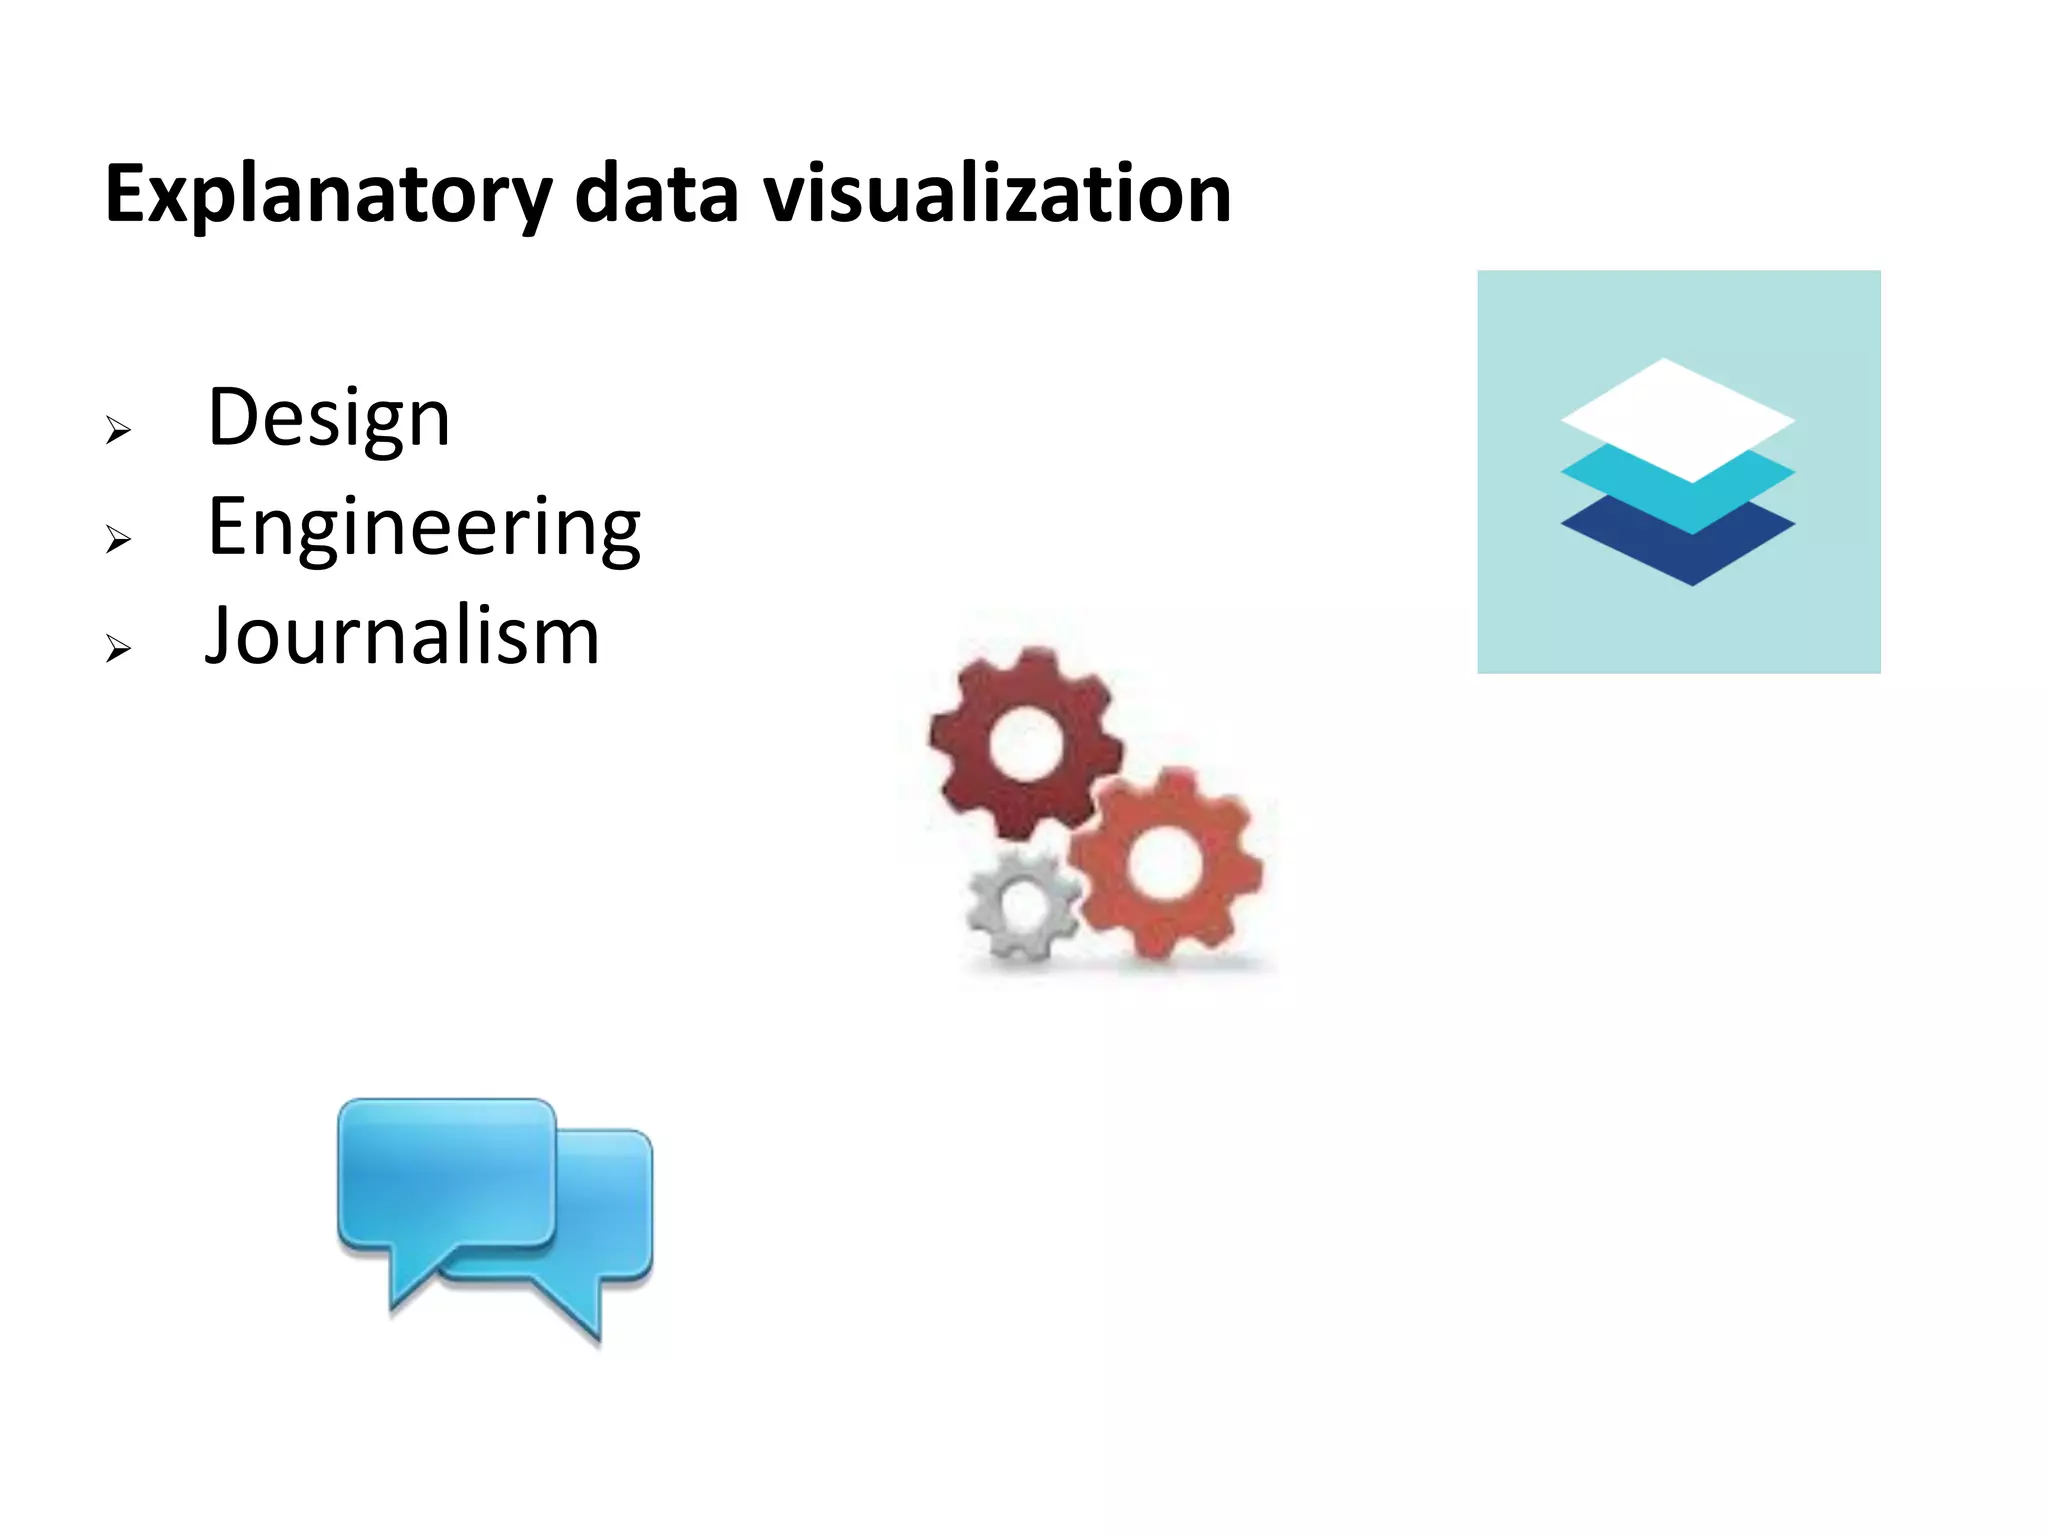
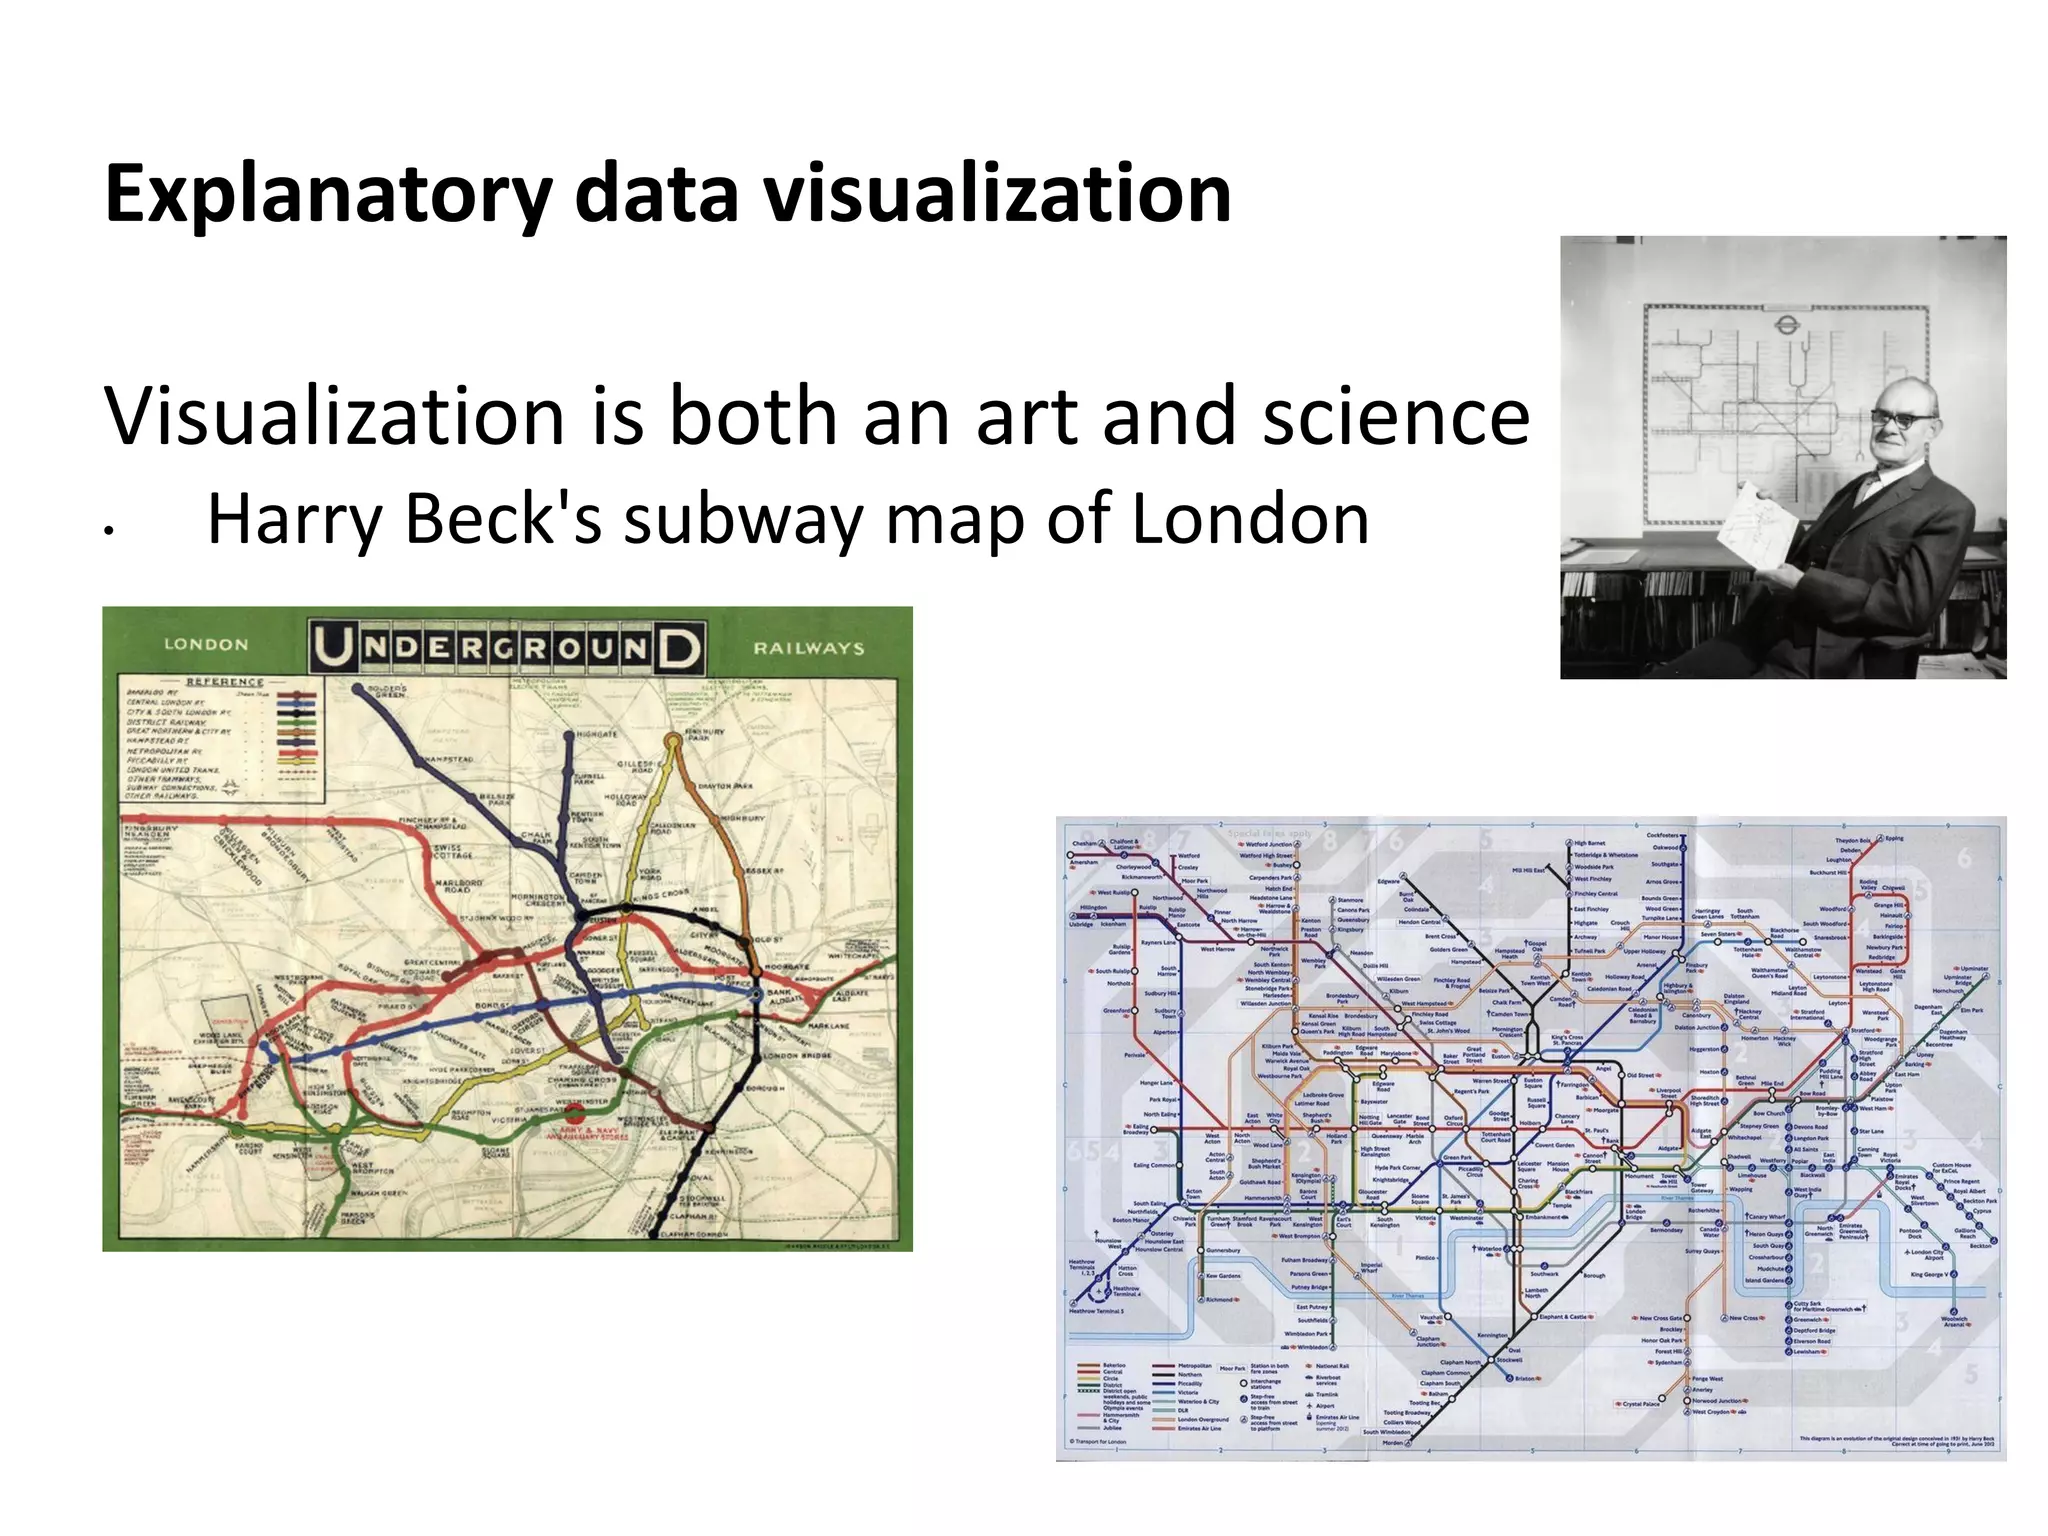
Explains the design aspects of explanatory data visualization, reinforcing that it blends art and science.
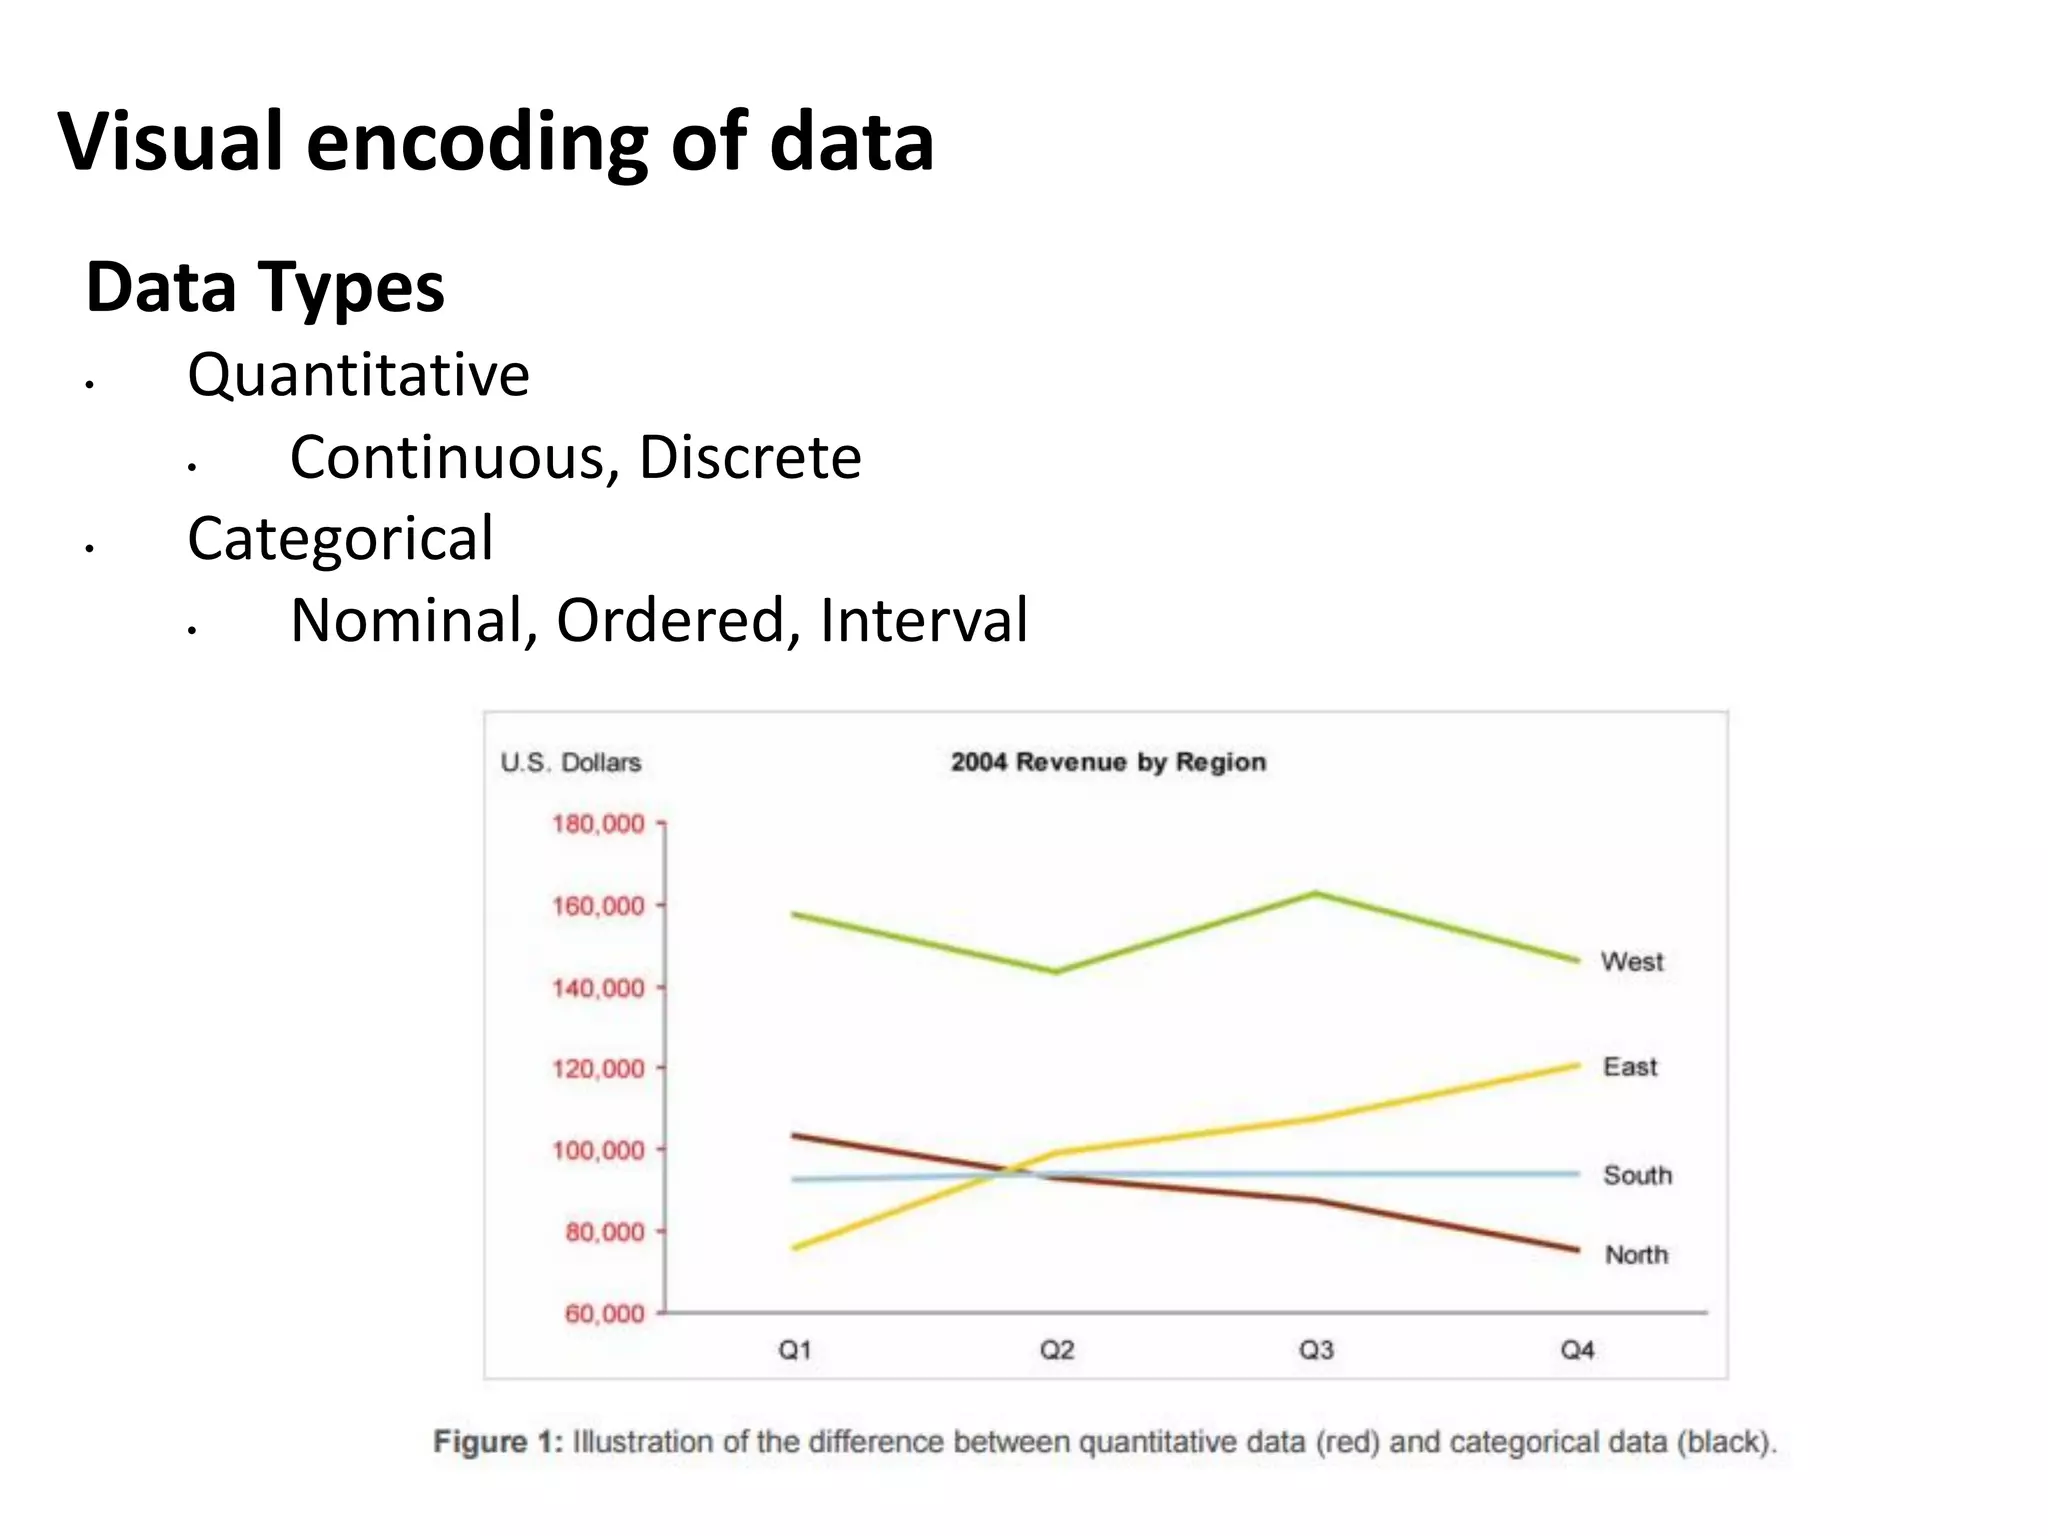
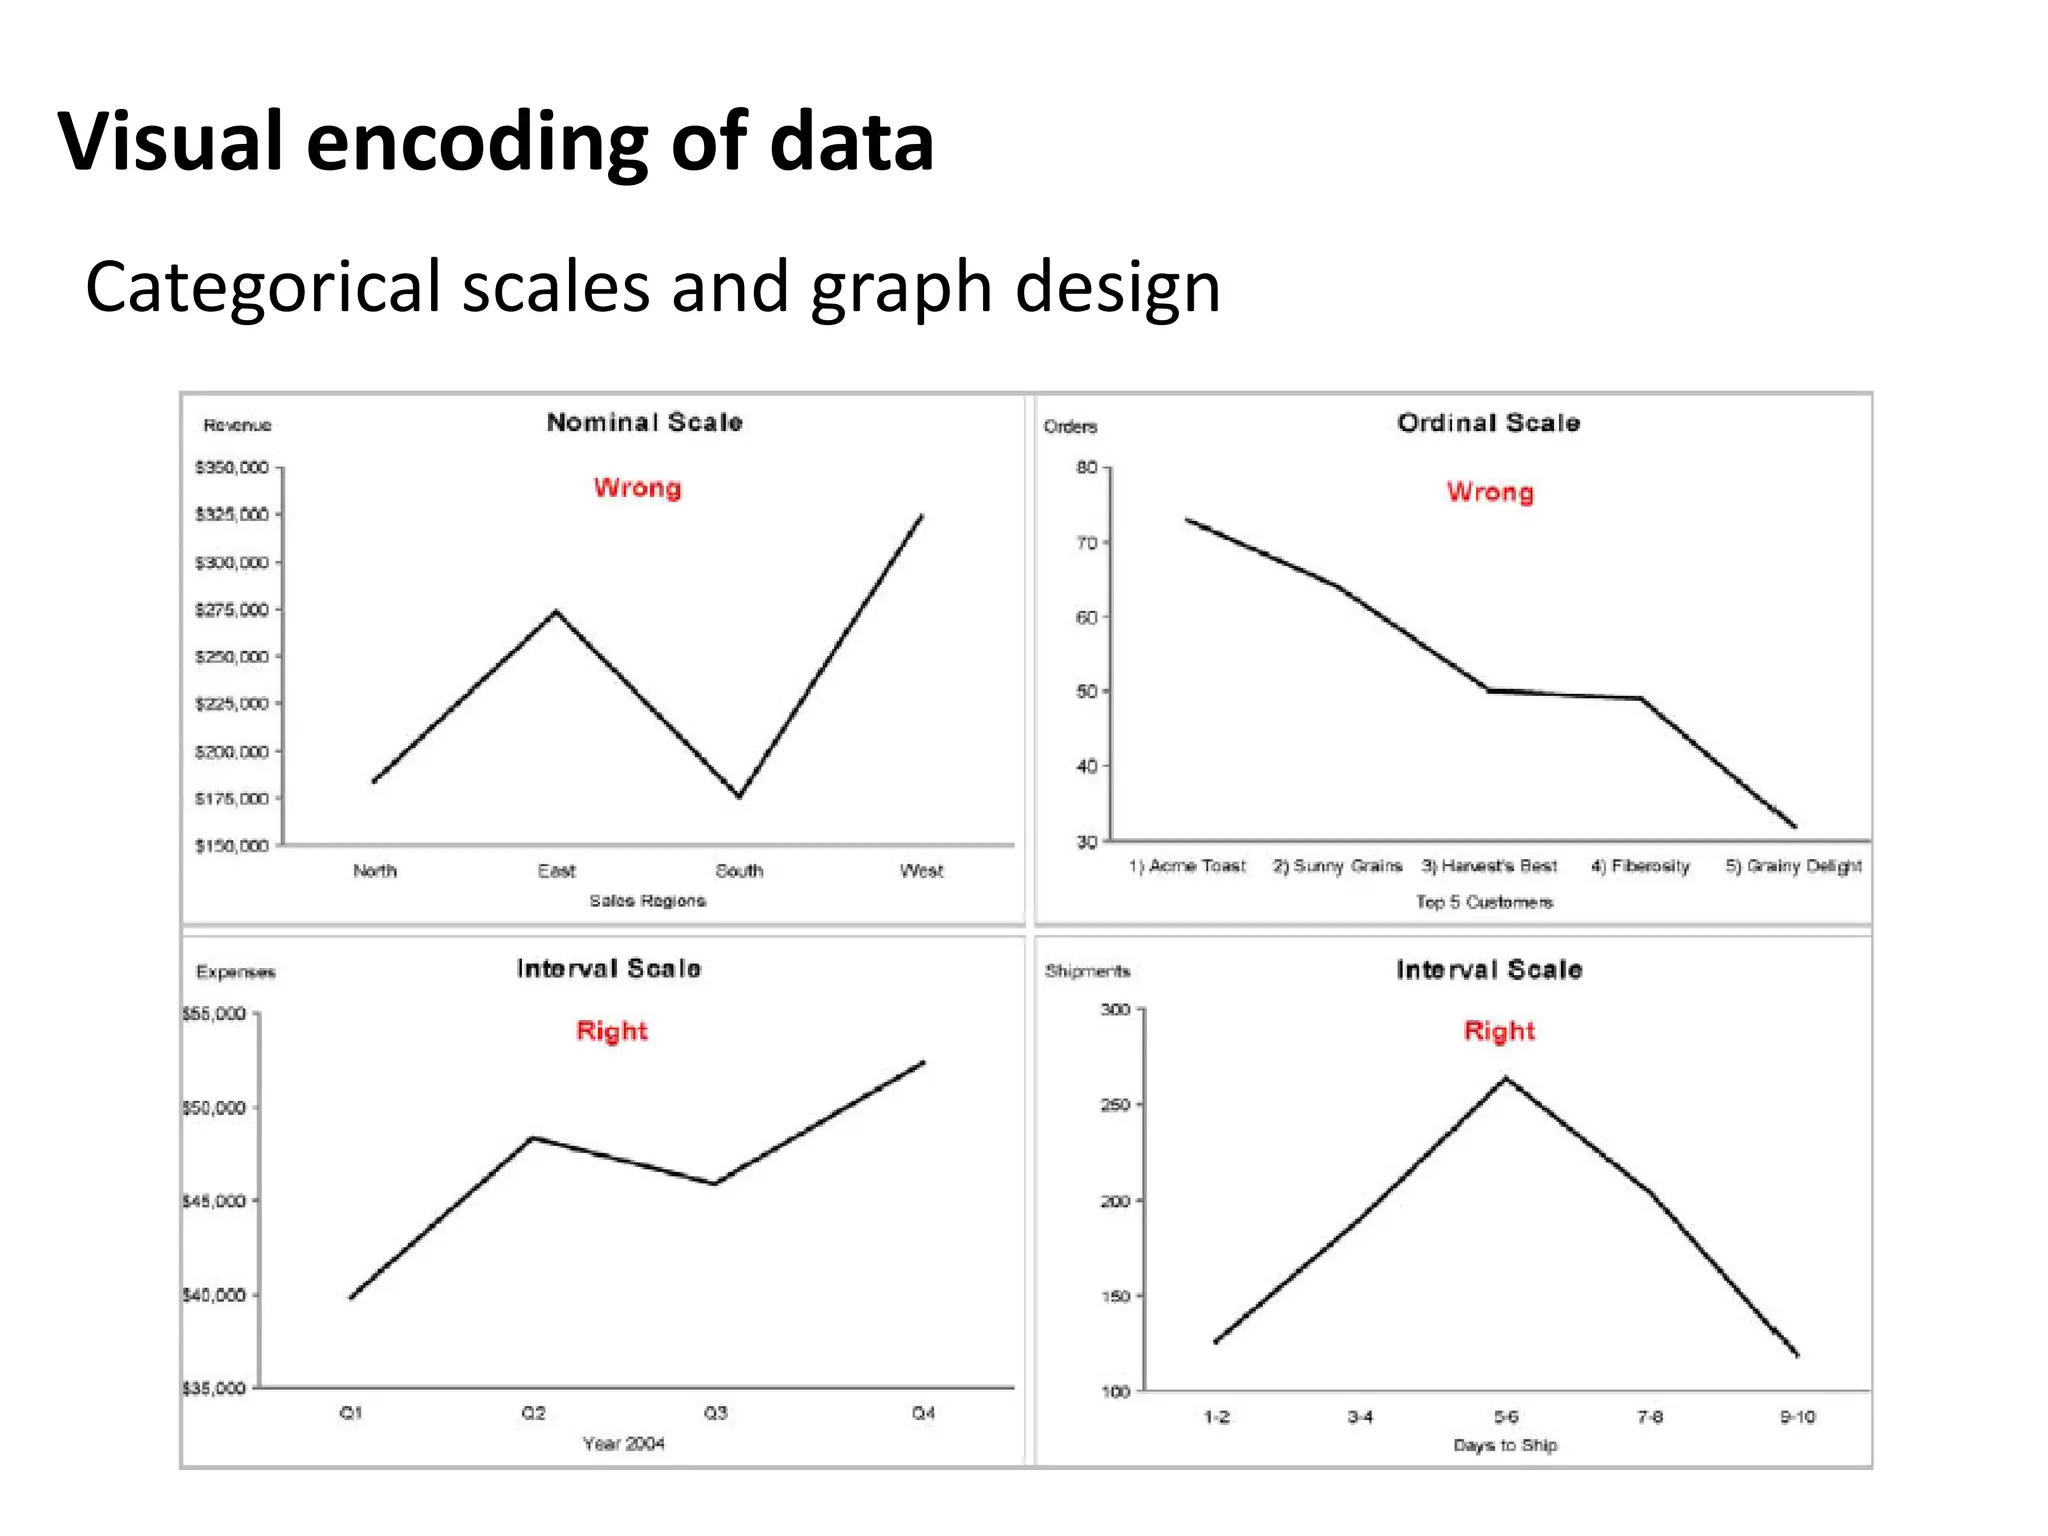
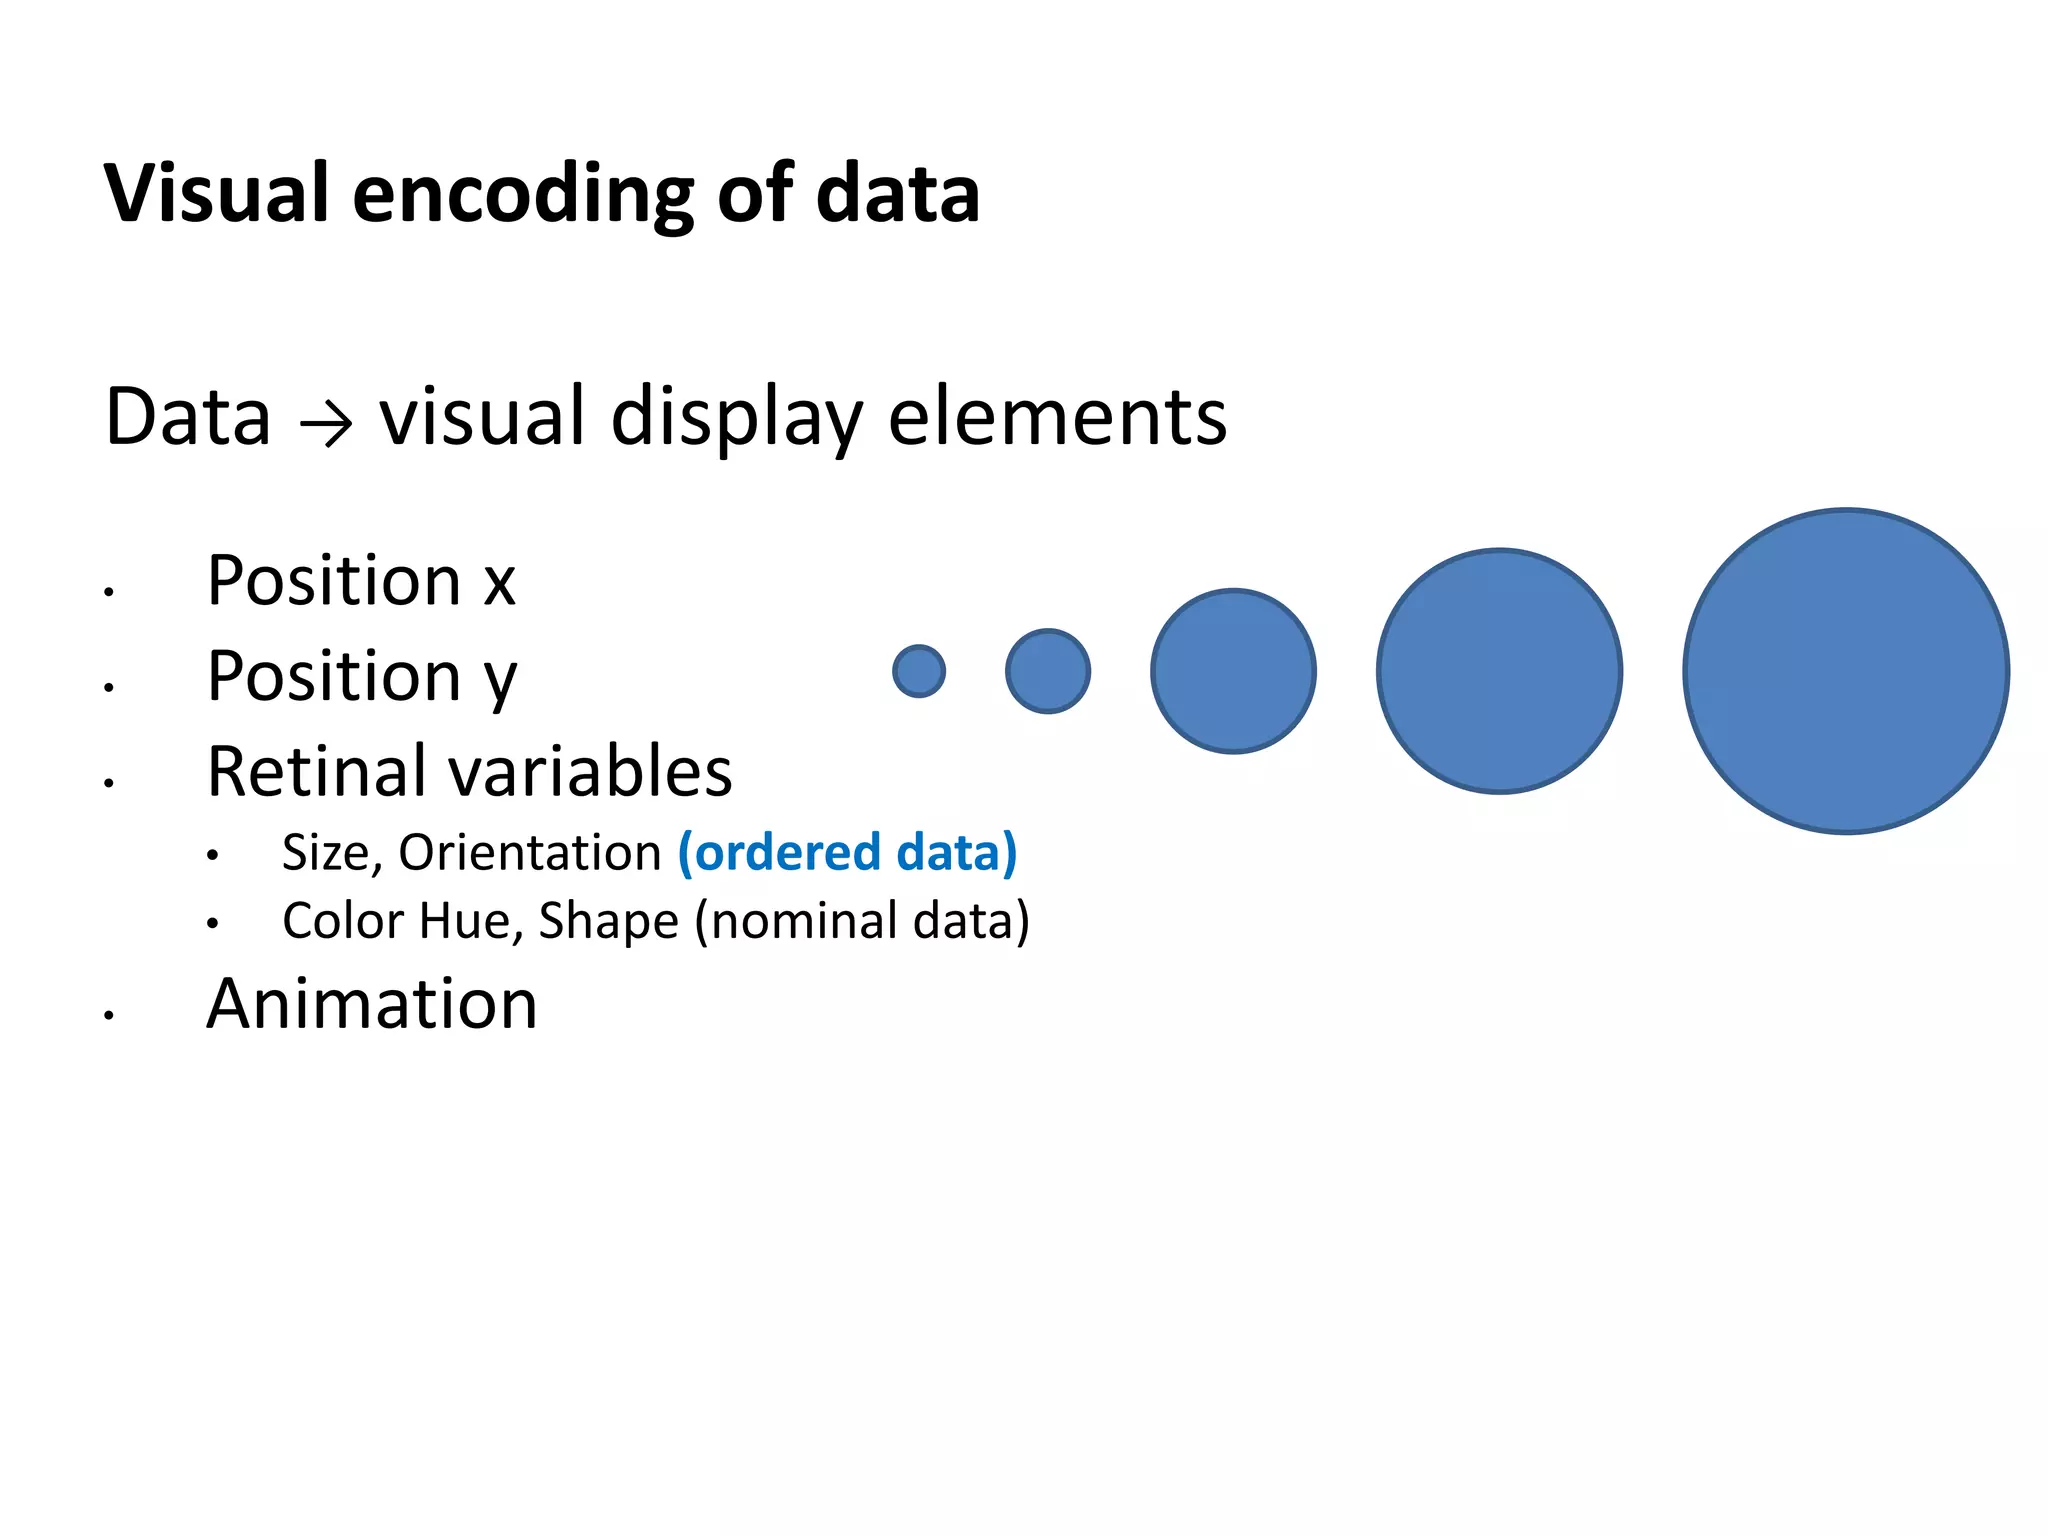
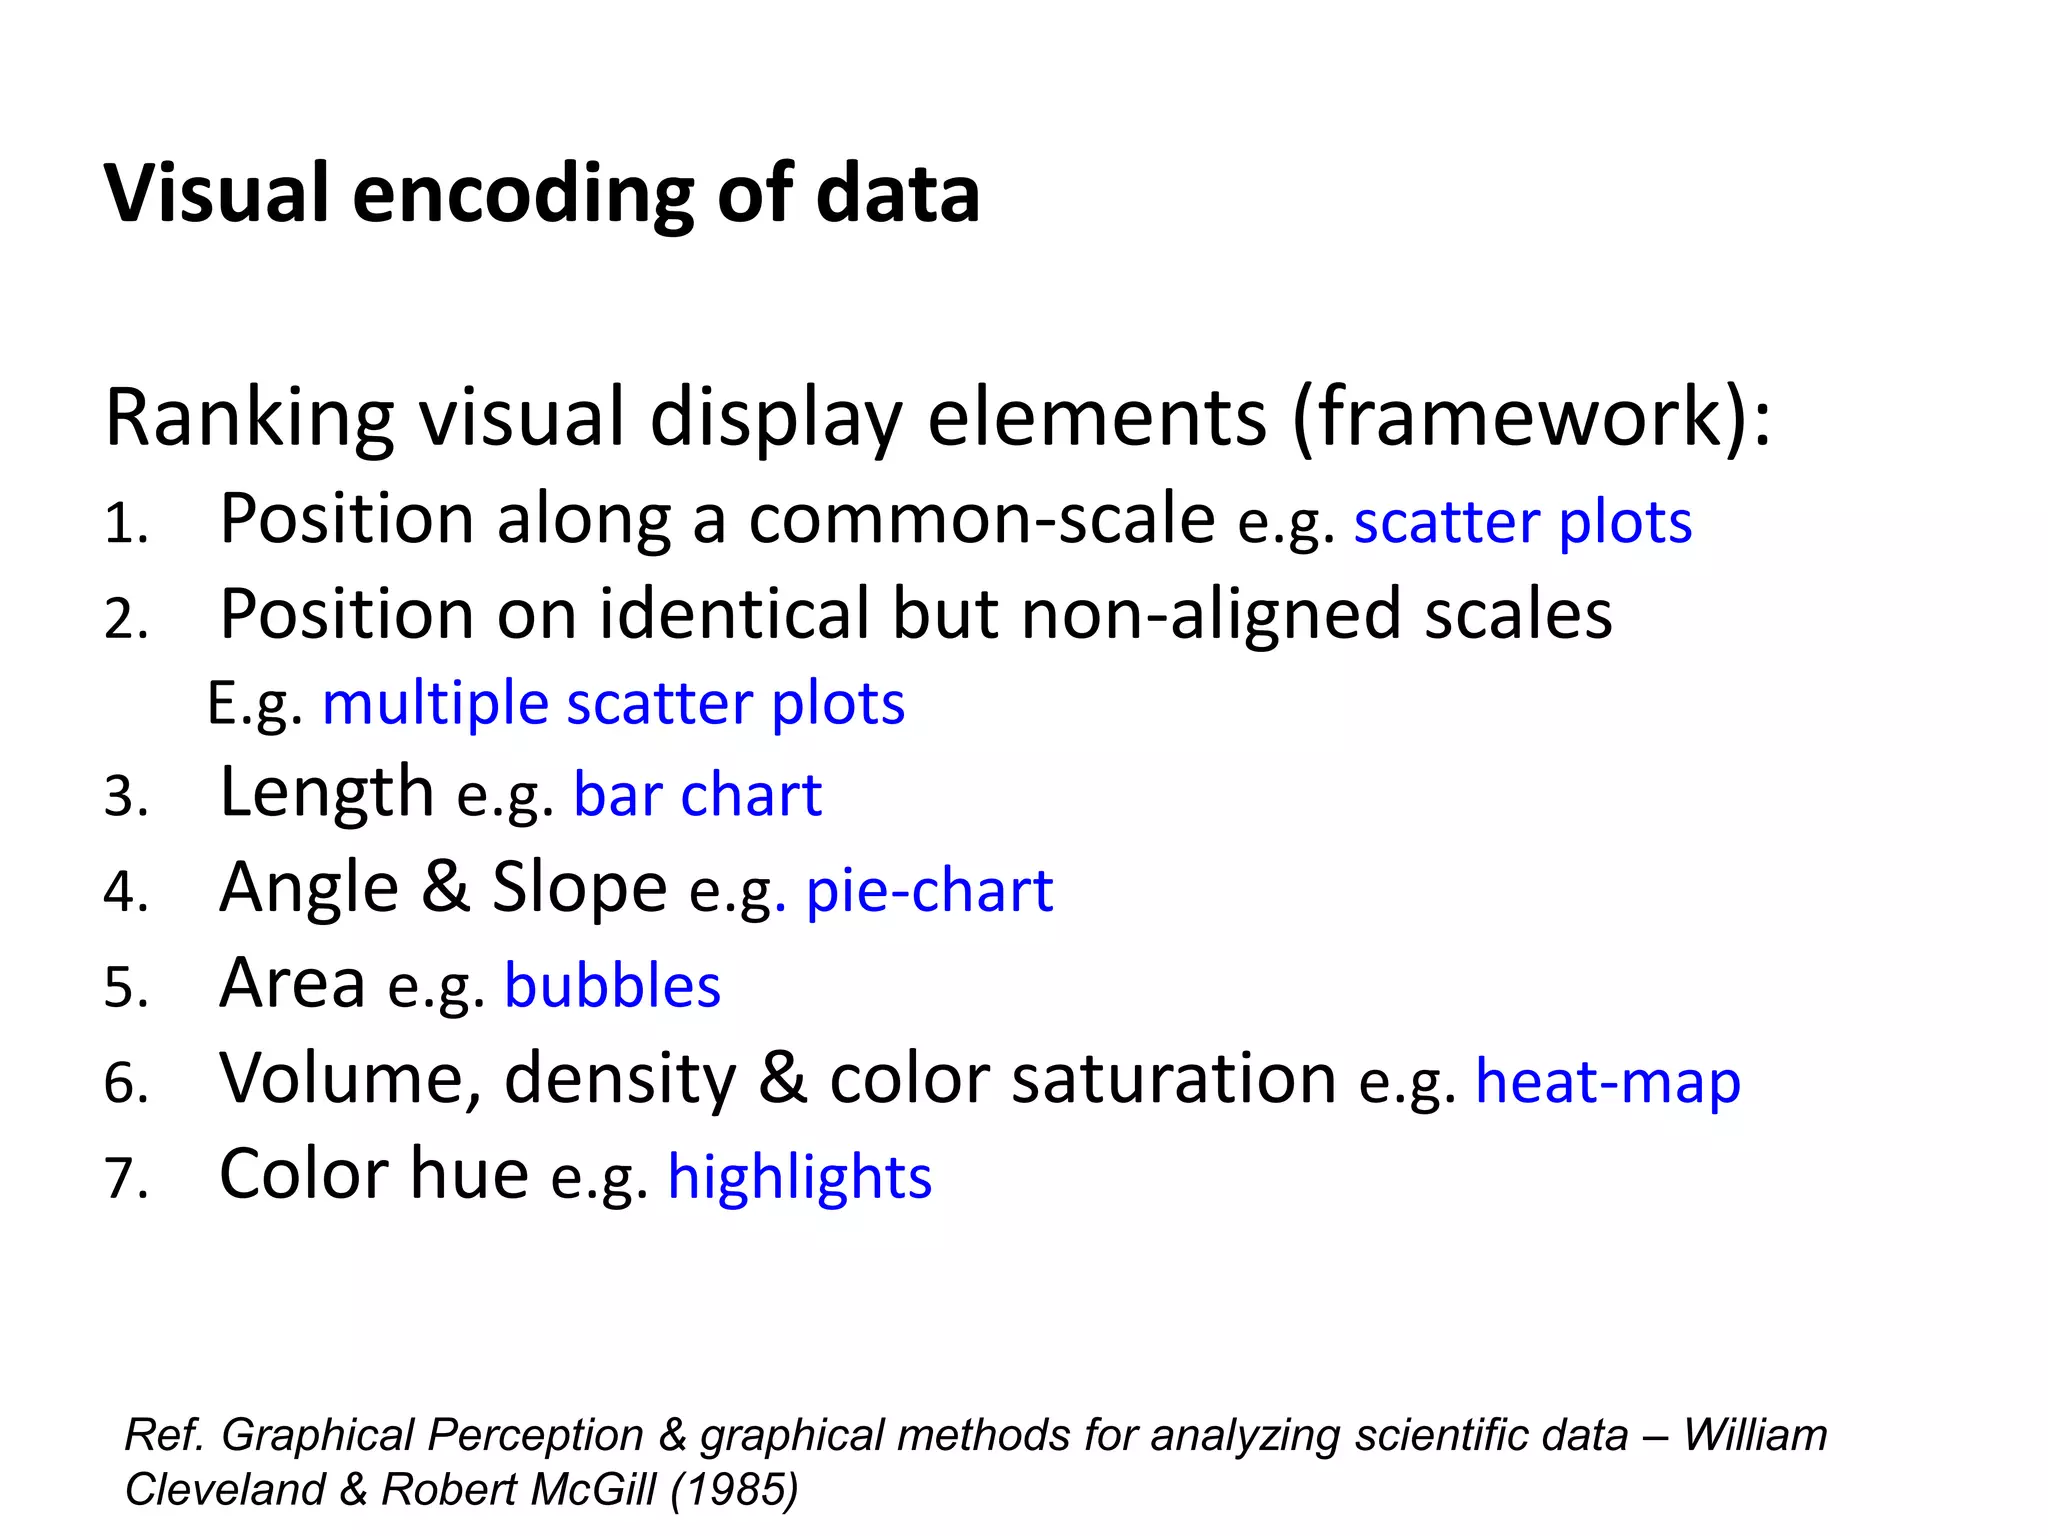
Categories of data types and their visual encoding principles with a framework for effective graphical representation.
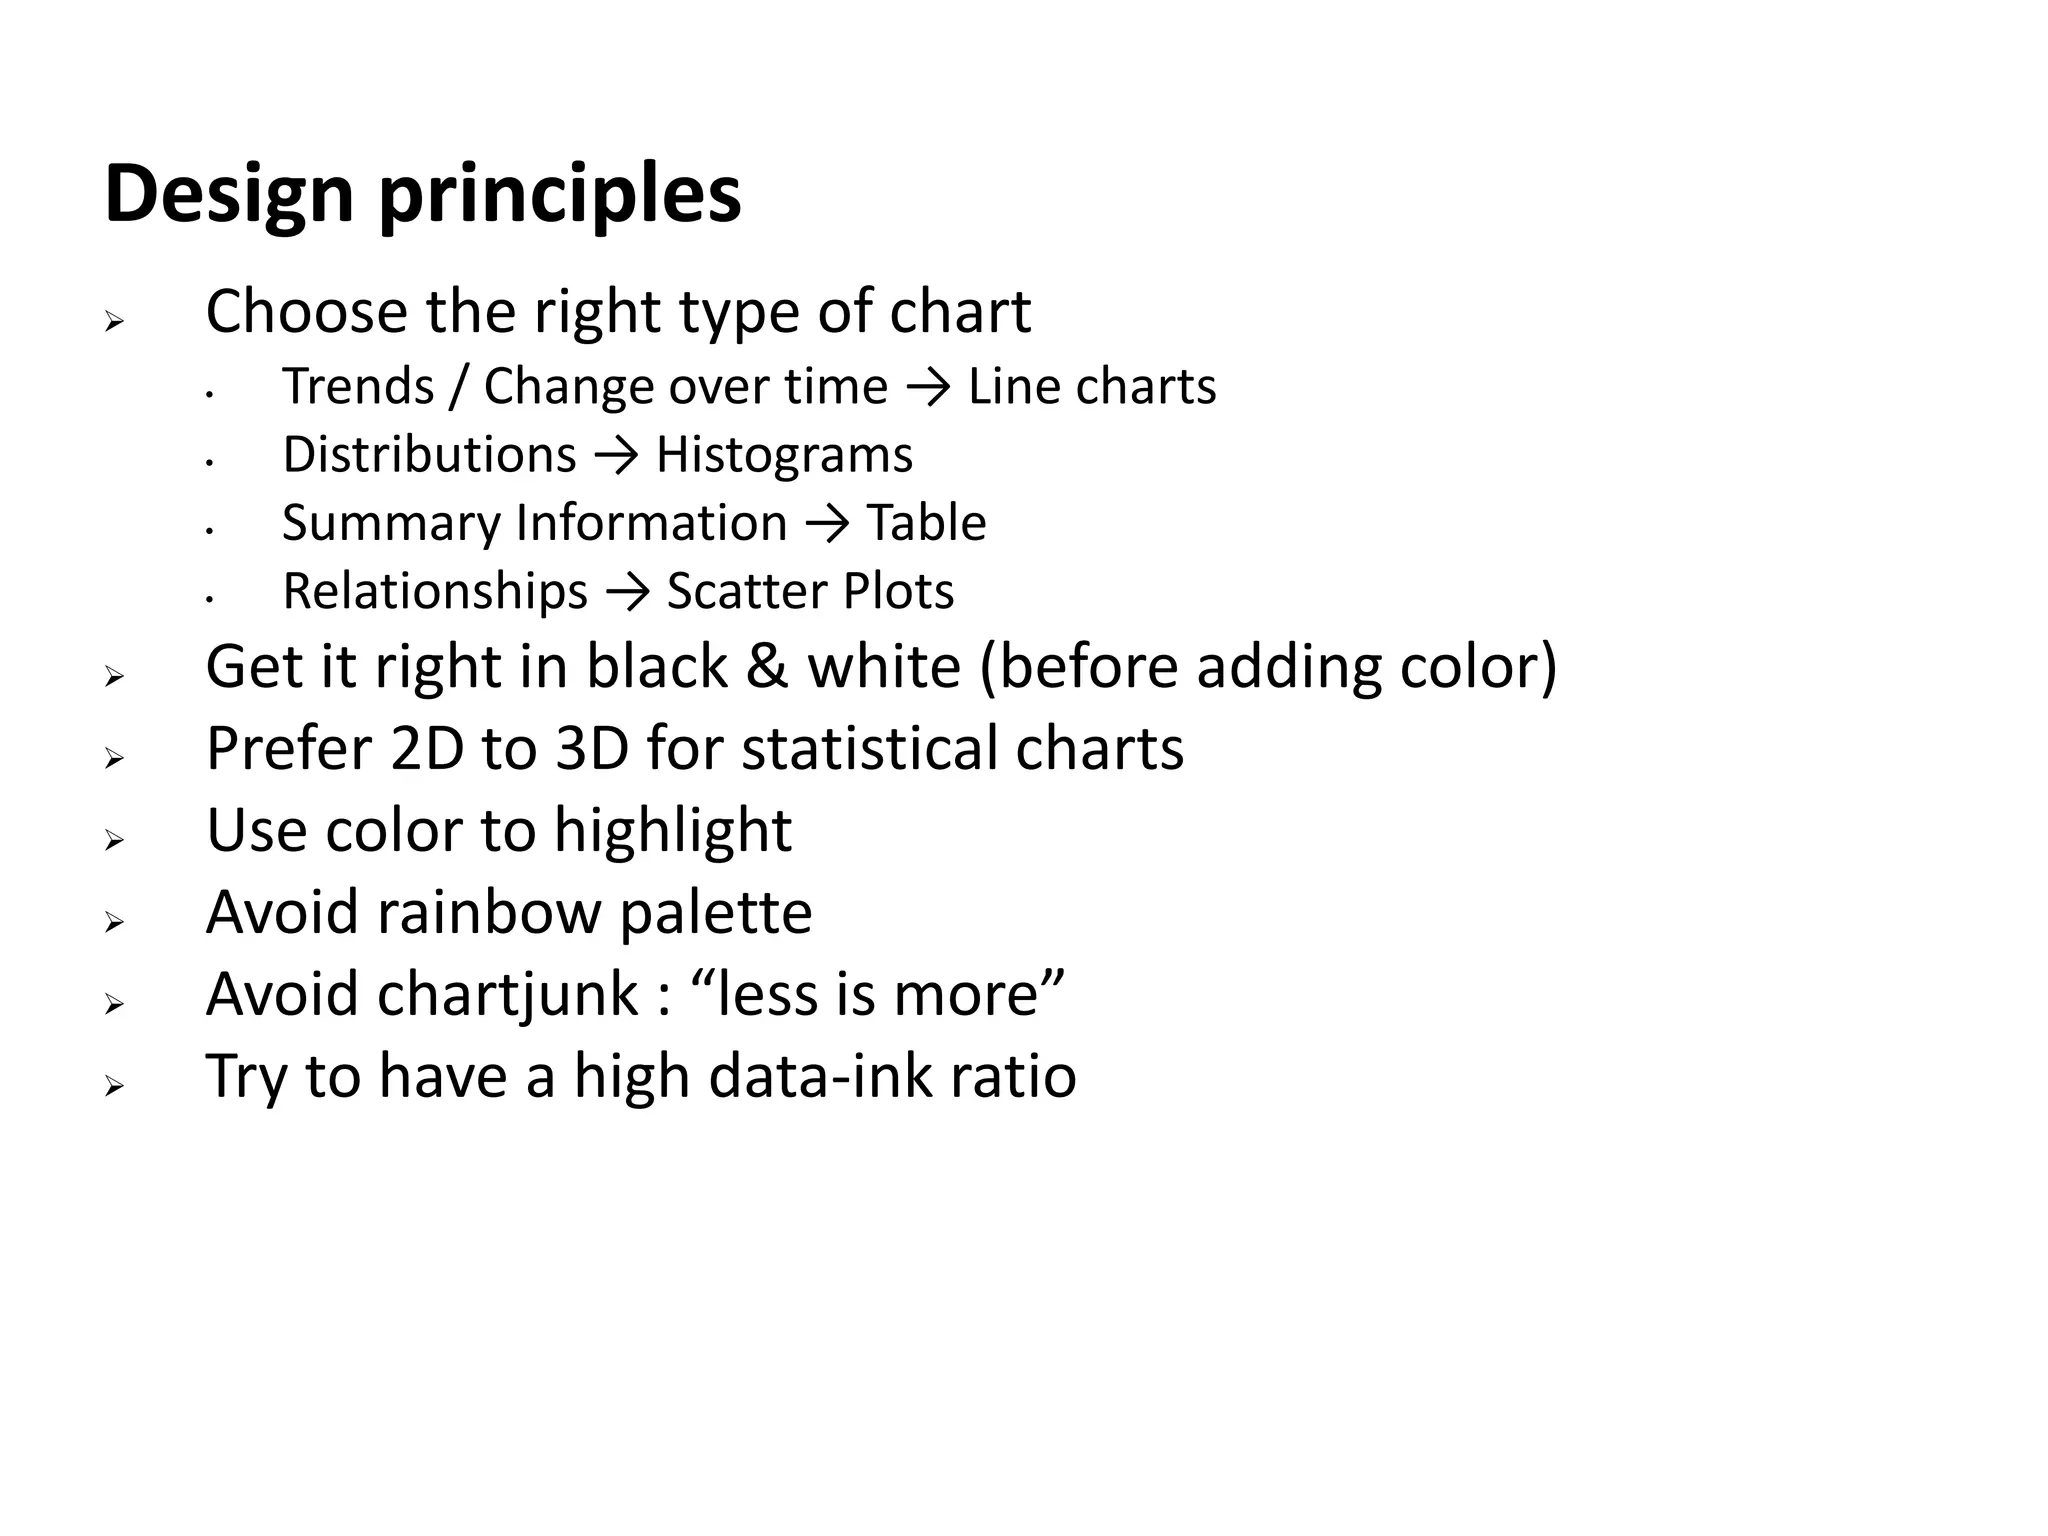
Guidelines for choosing chart types based on data nature and ensuring clarity in visual design, promoting 'less is more'.
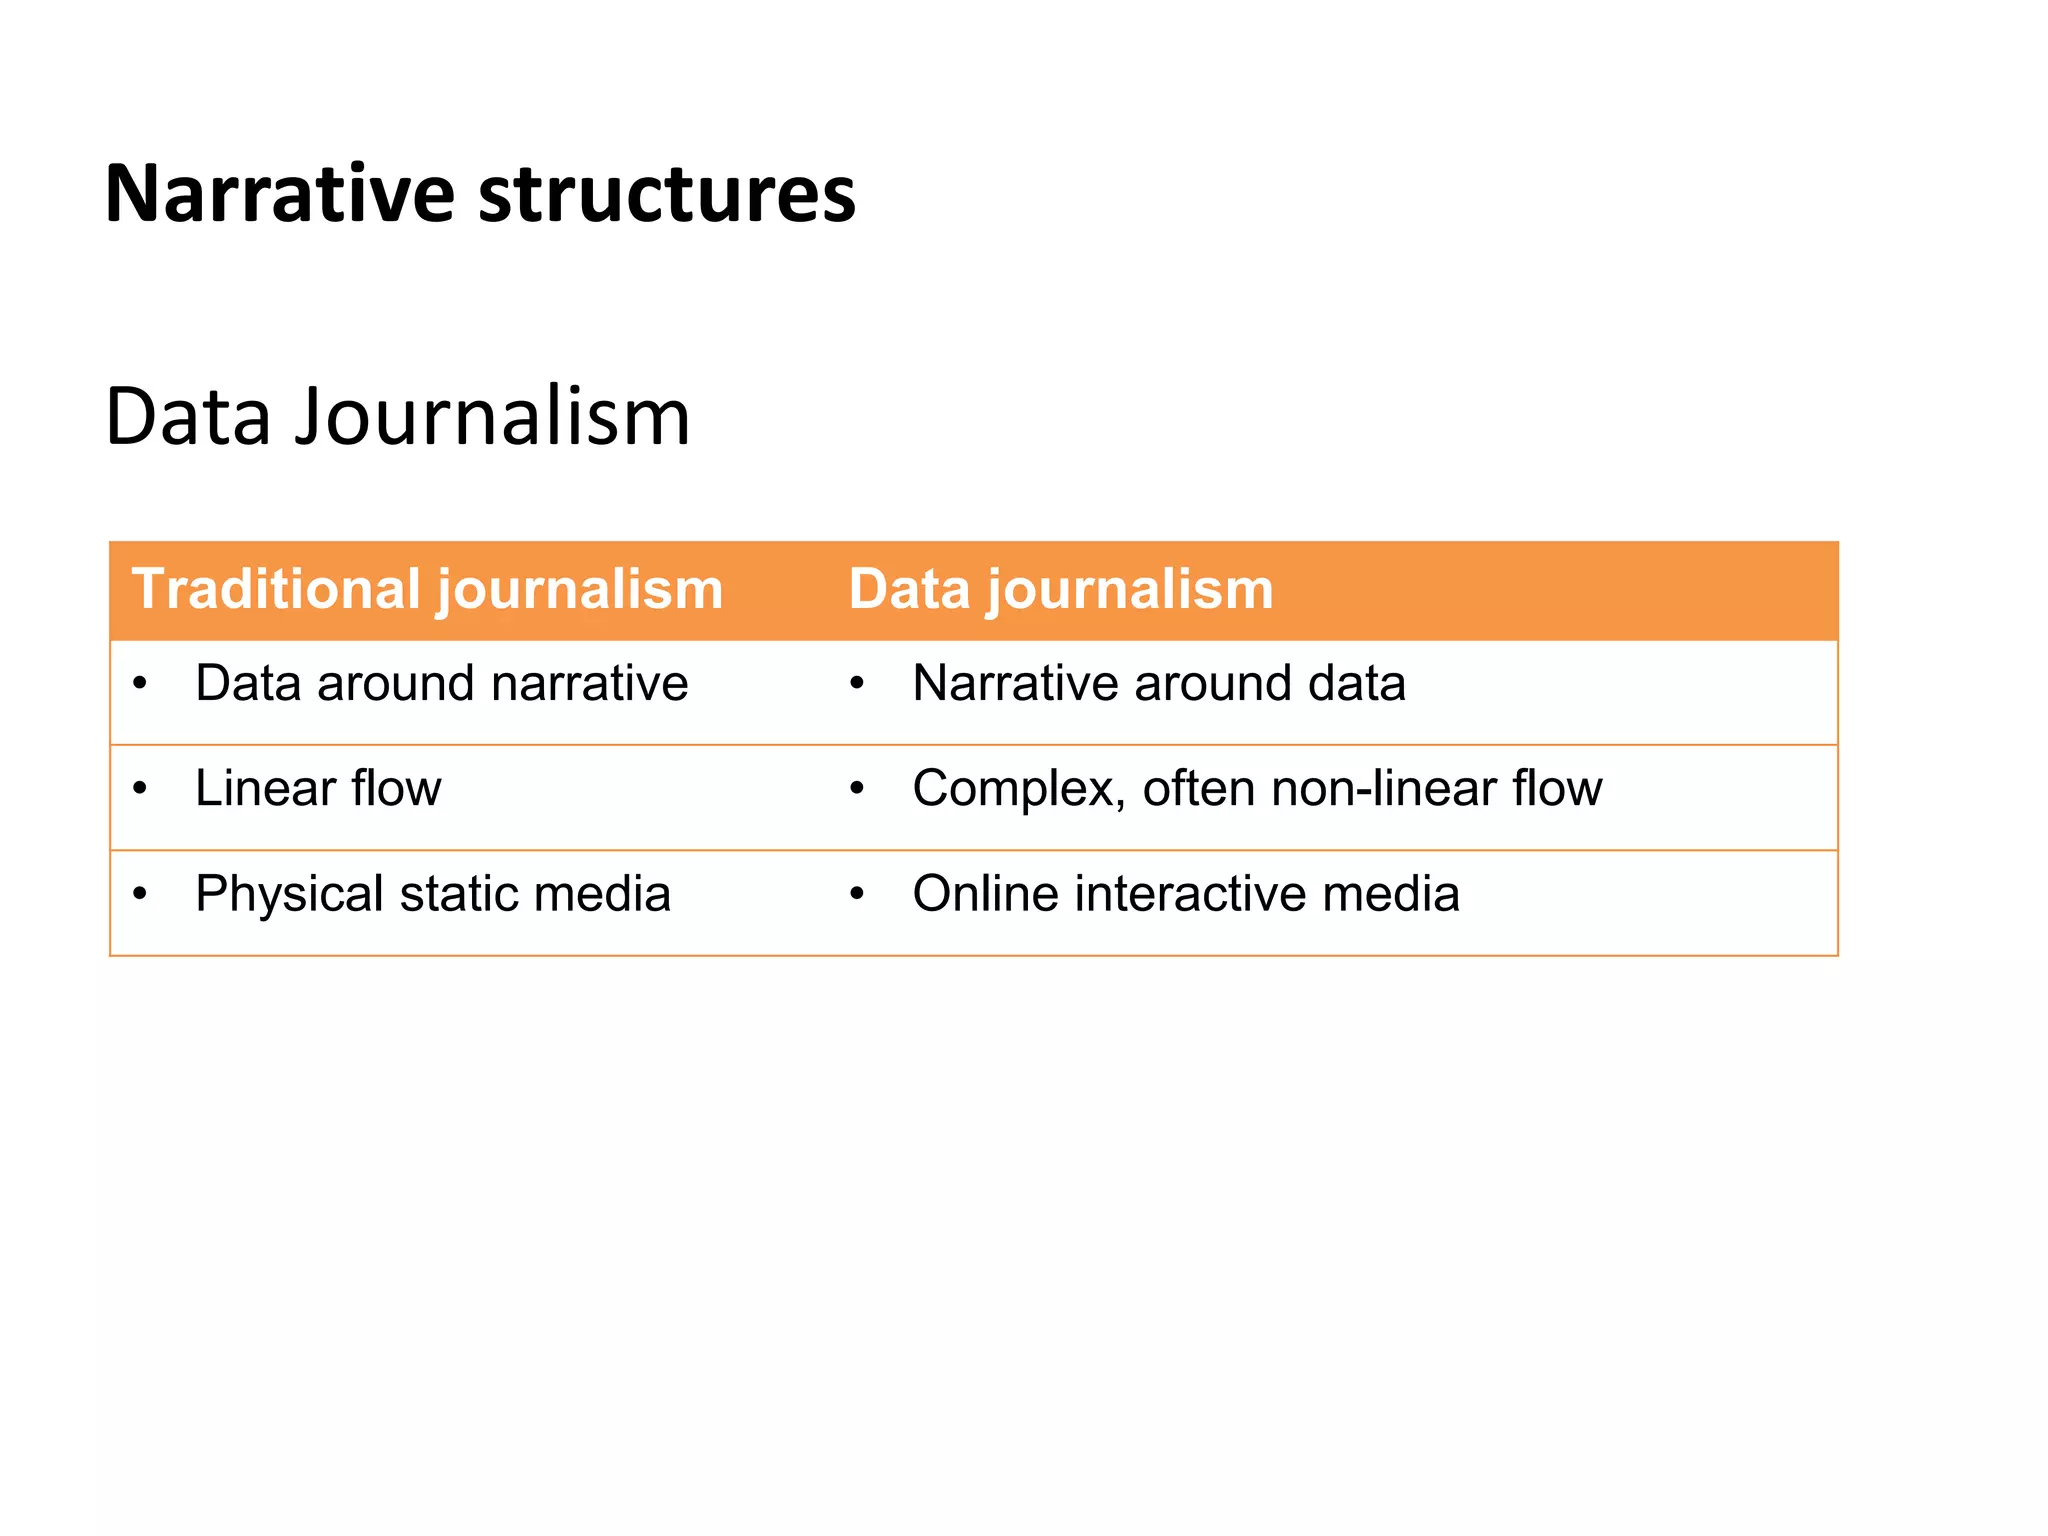
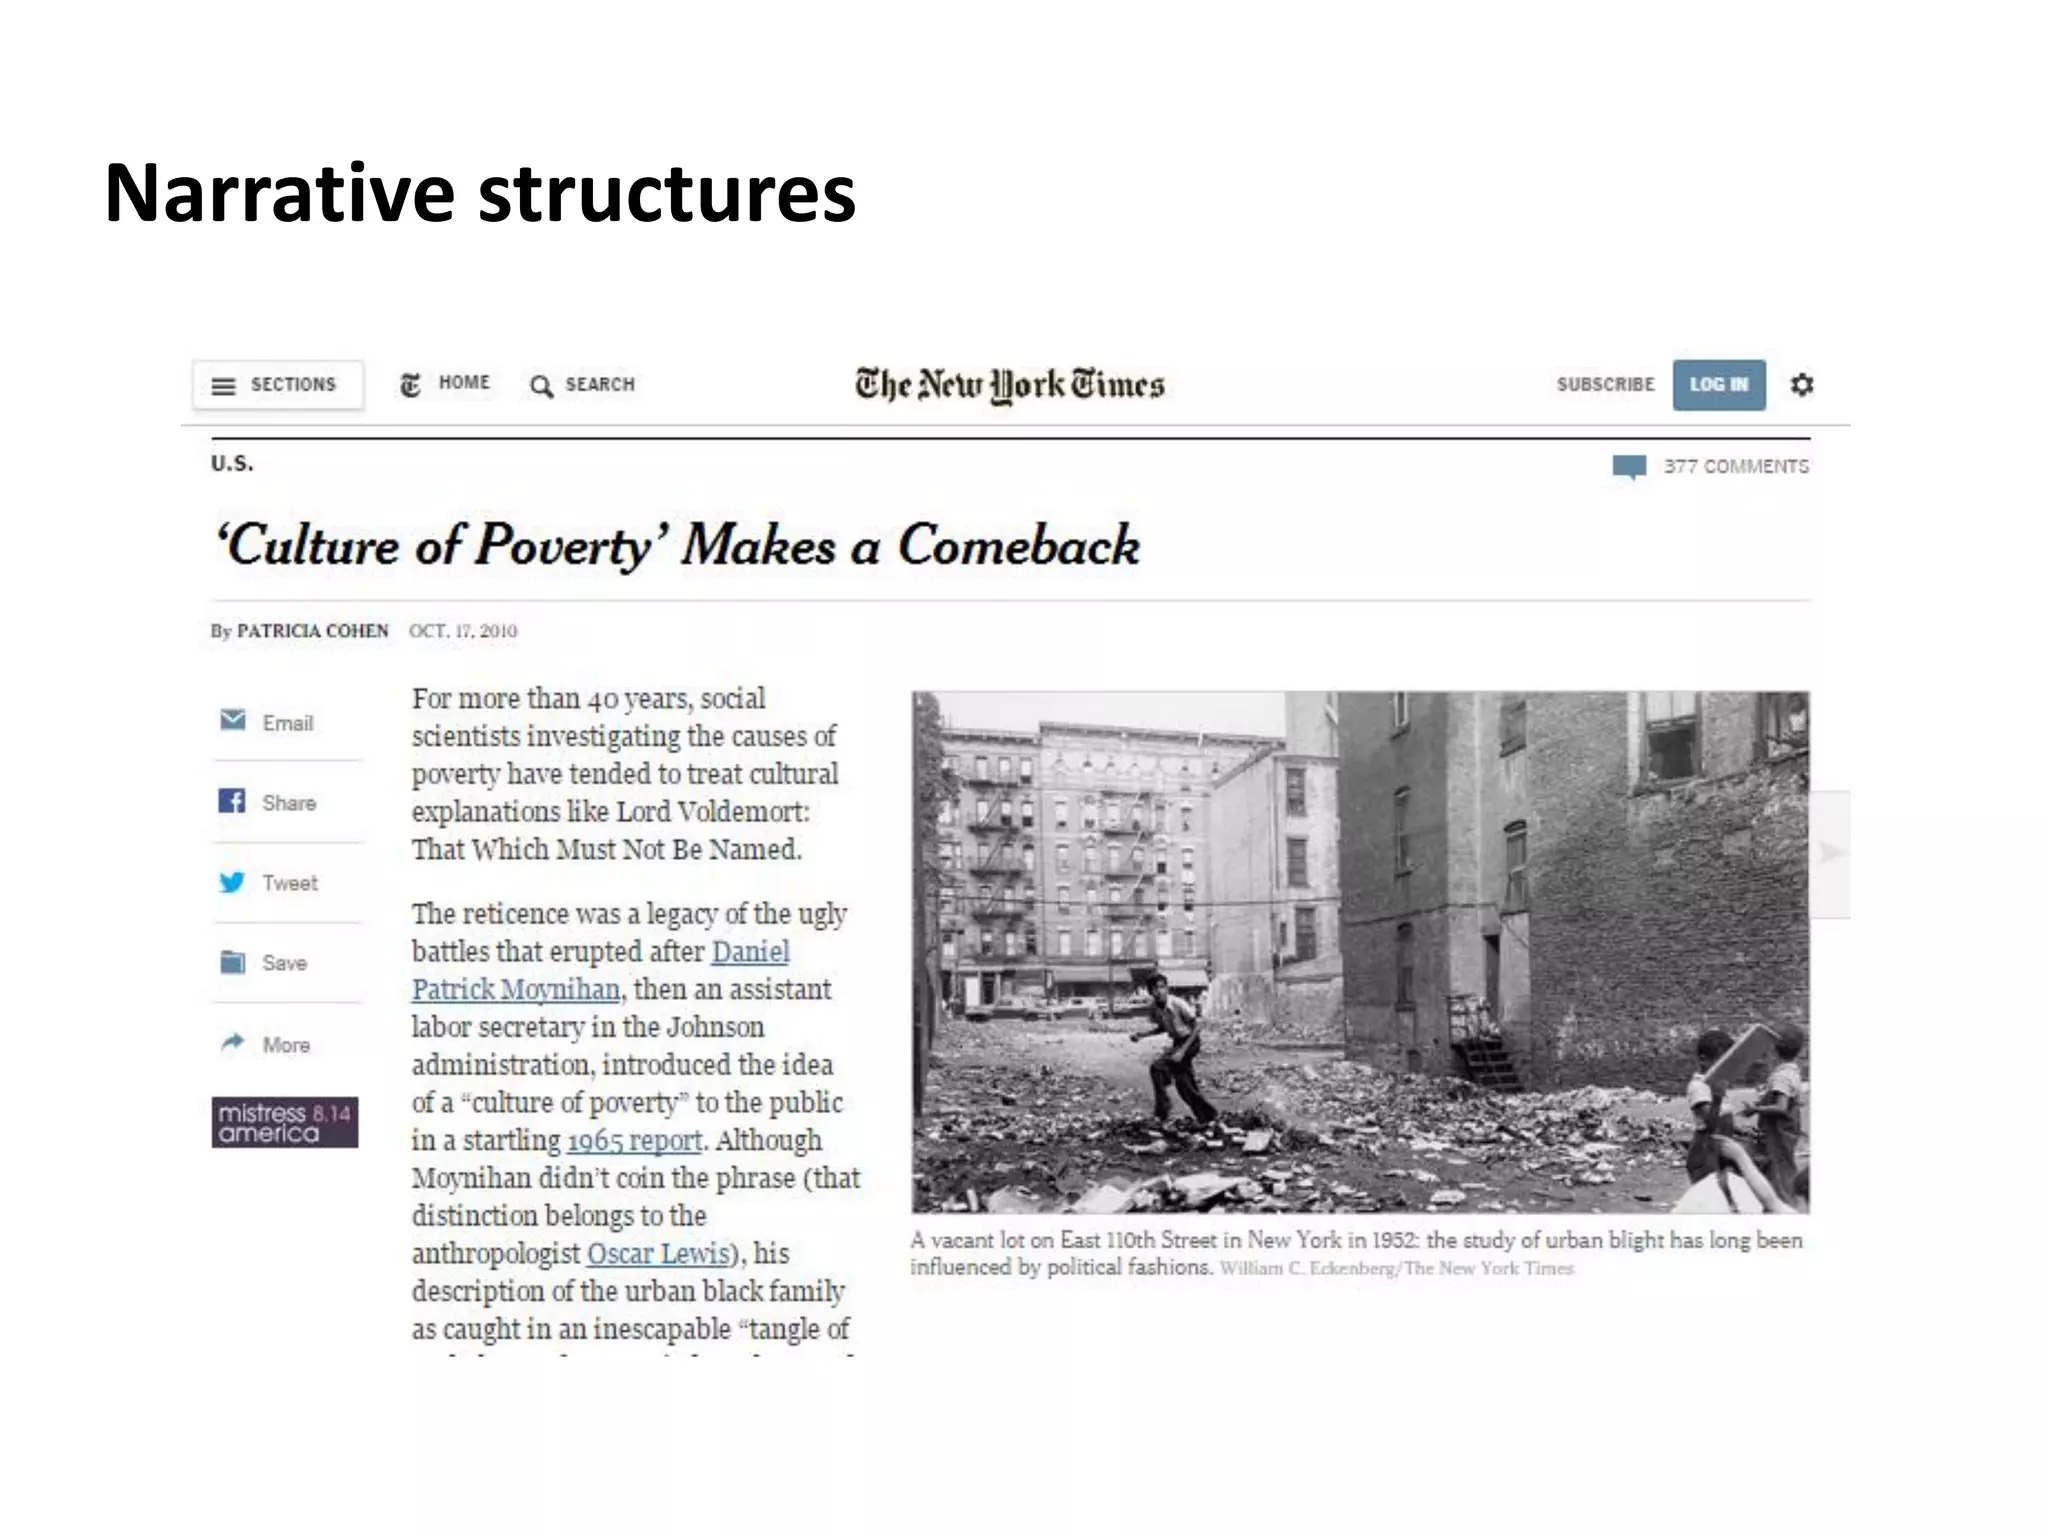
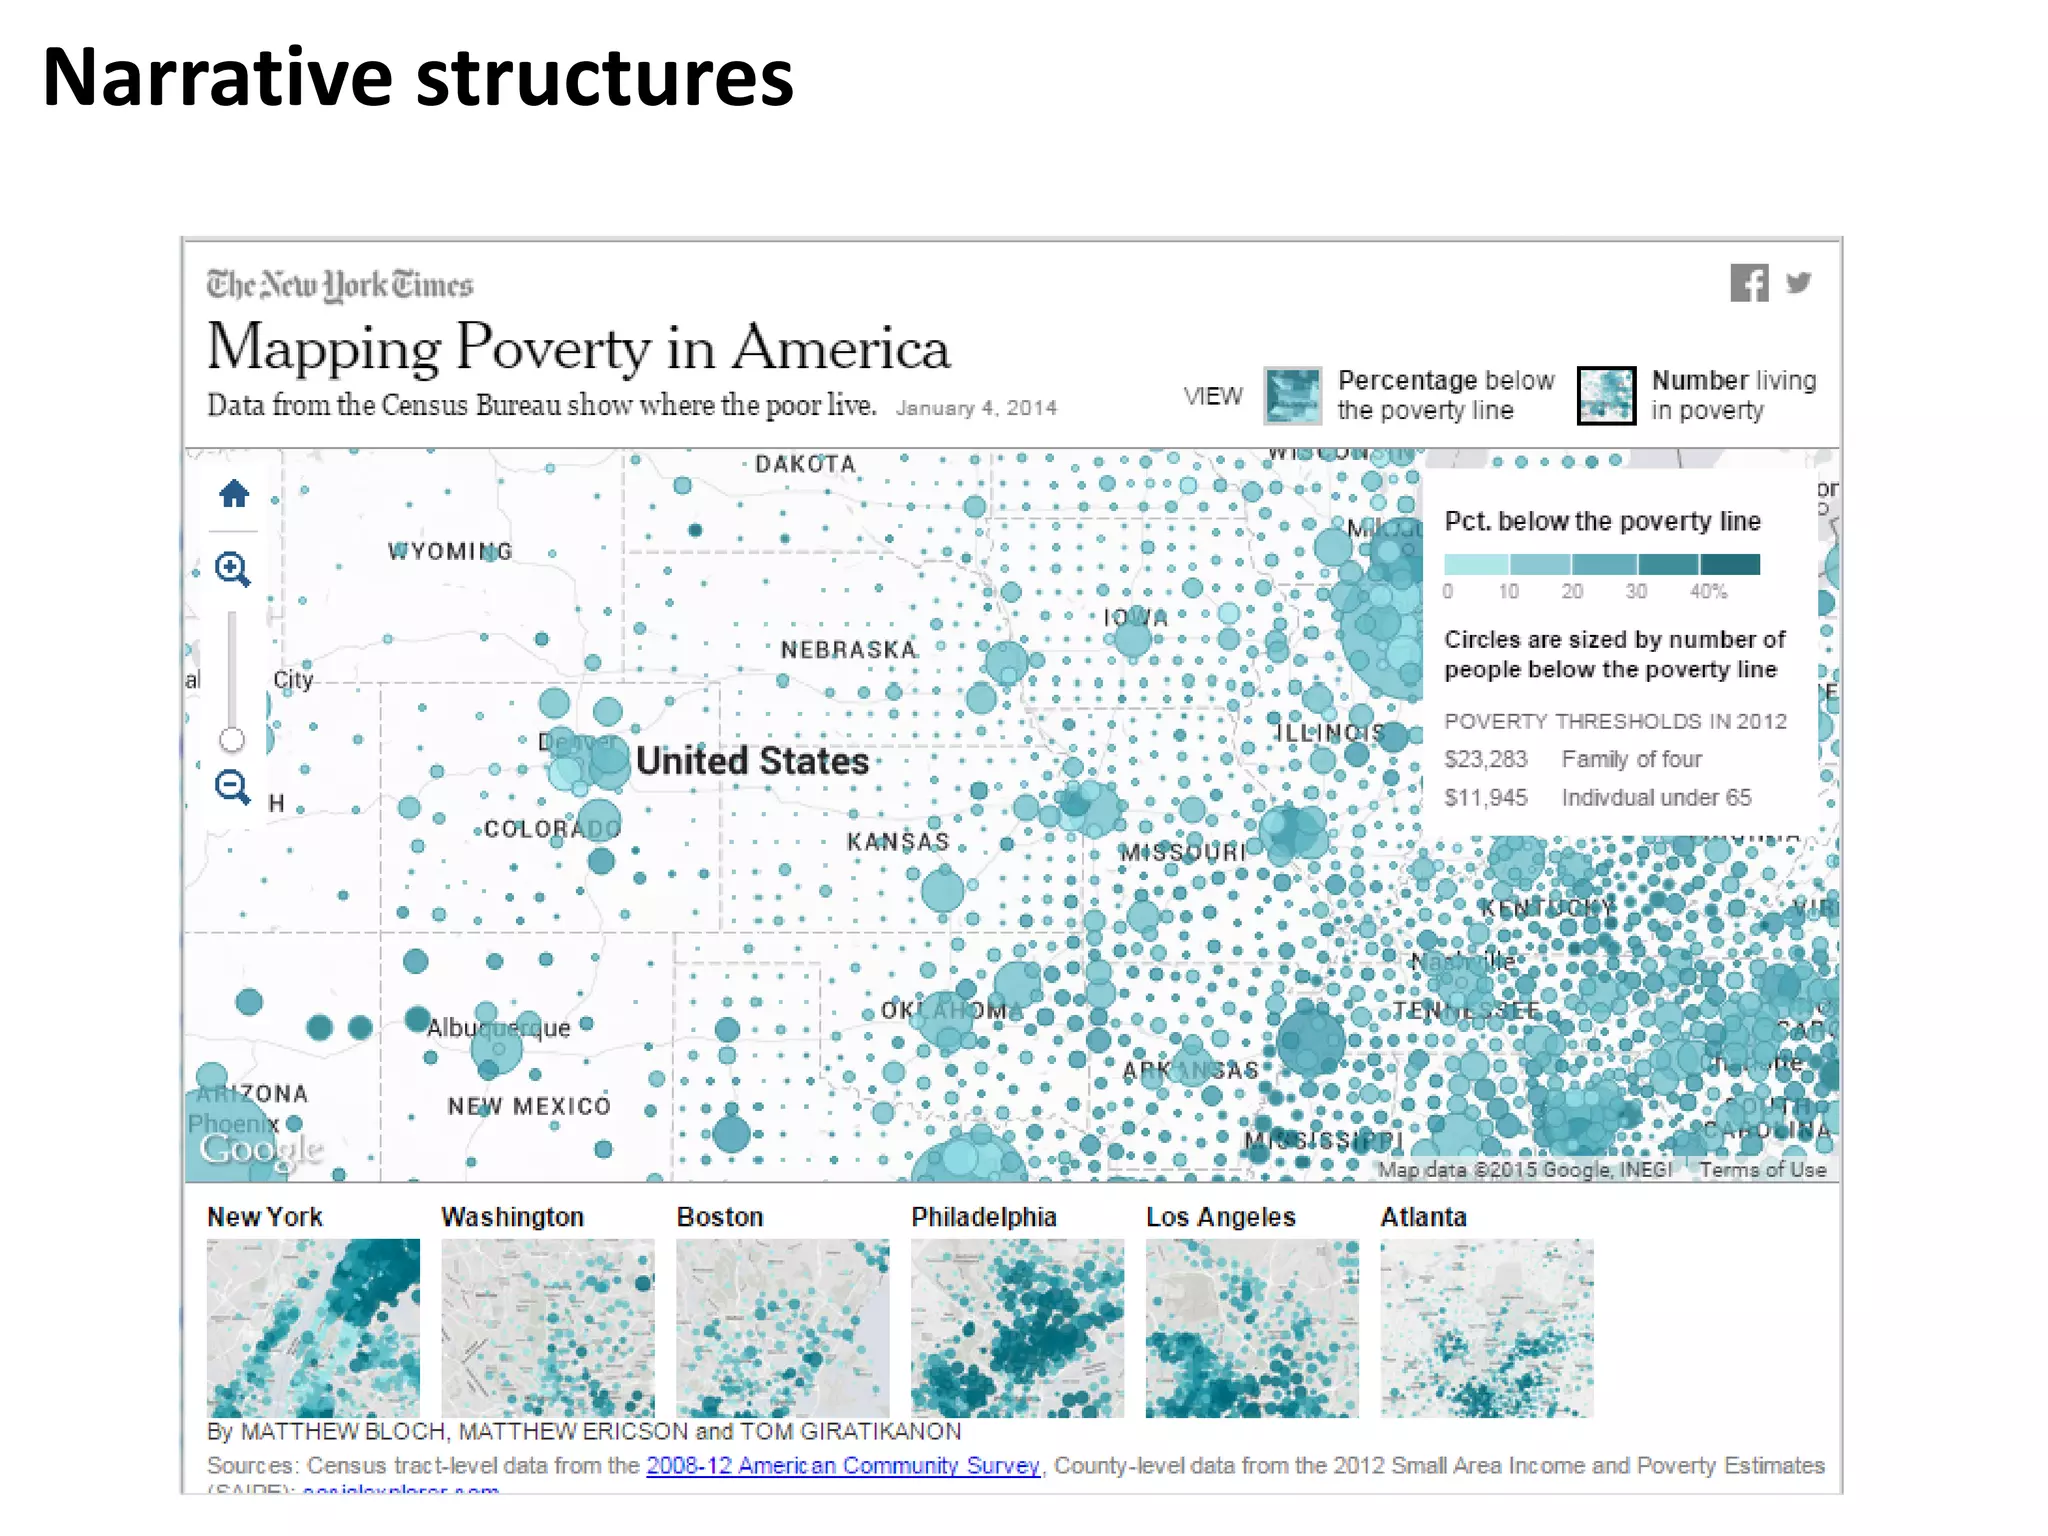
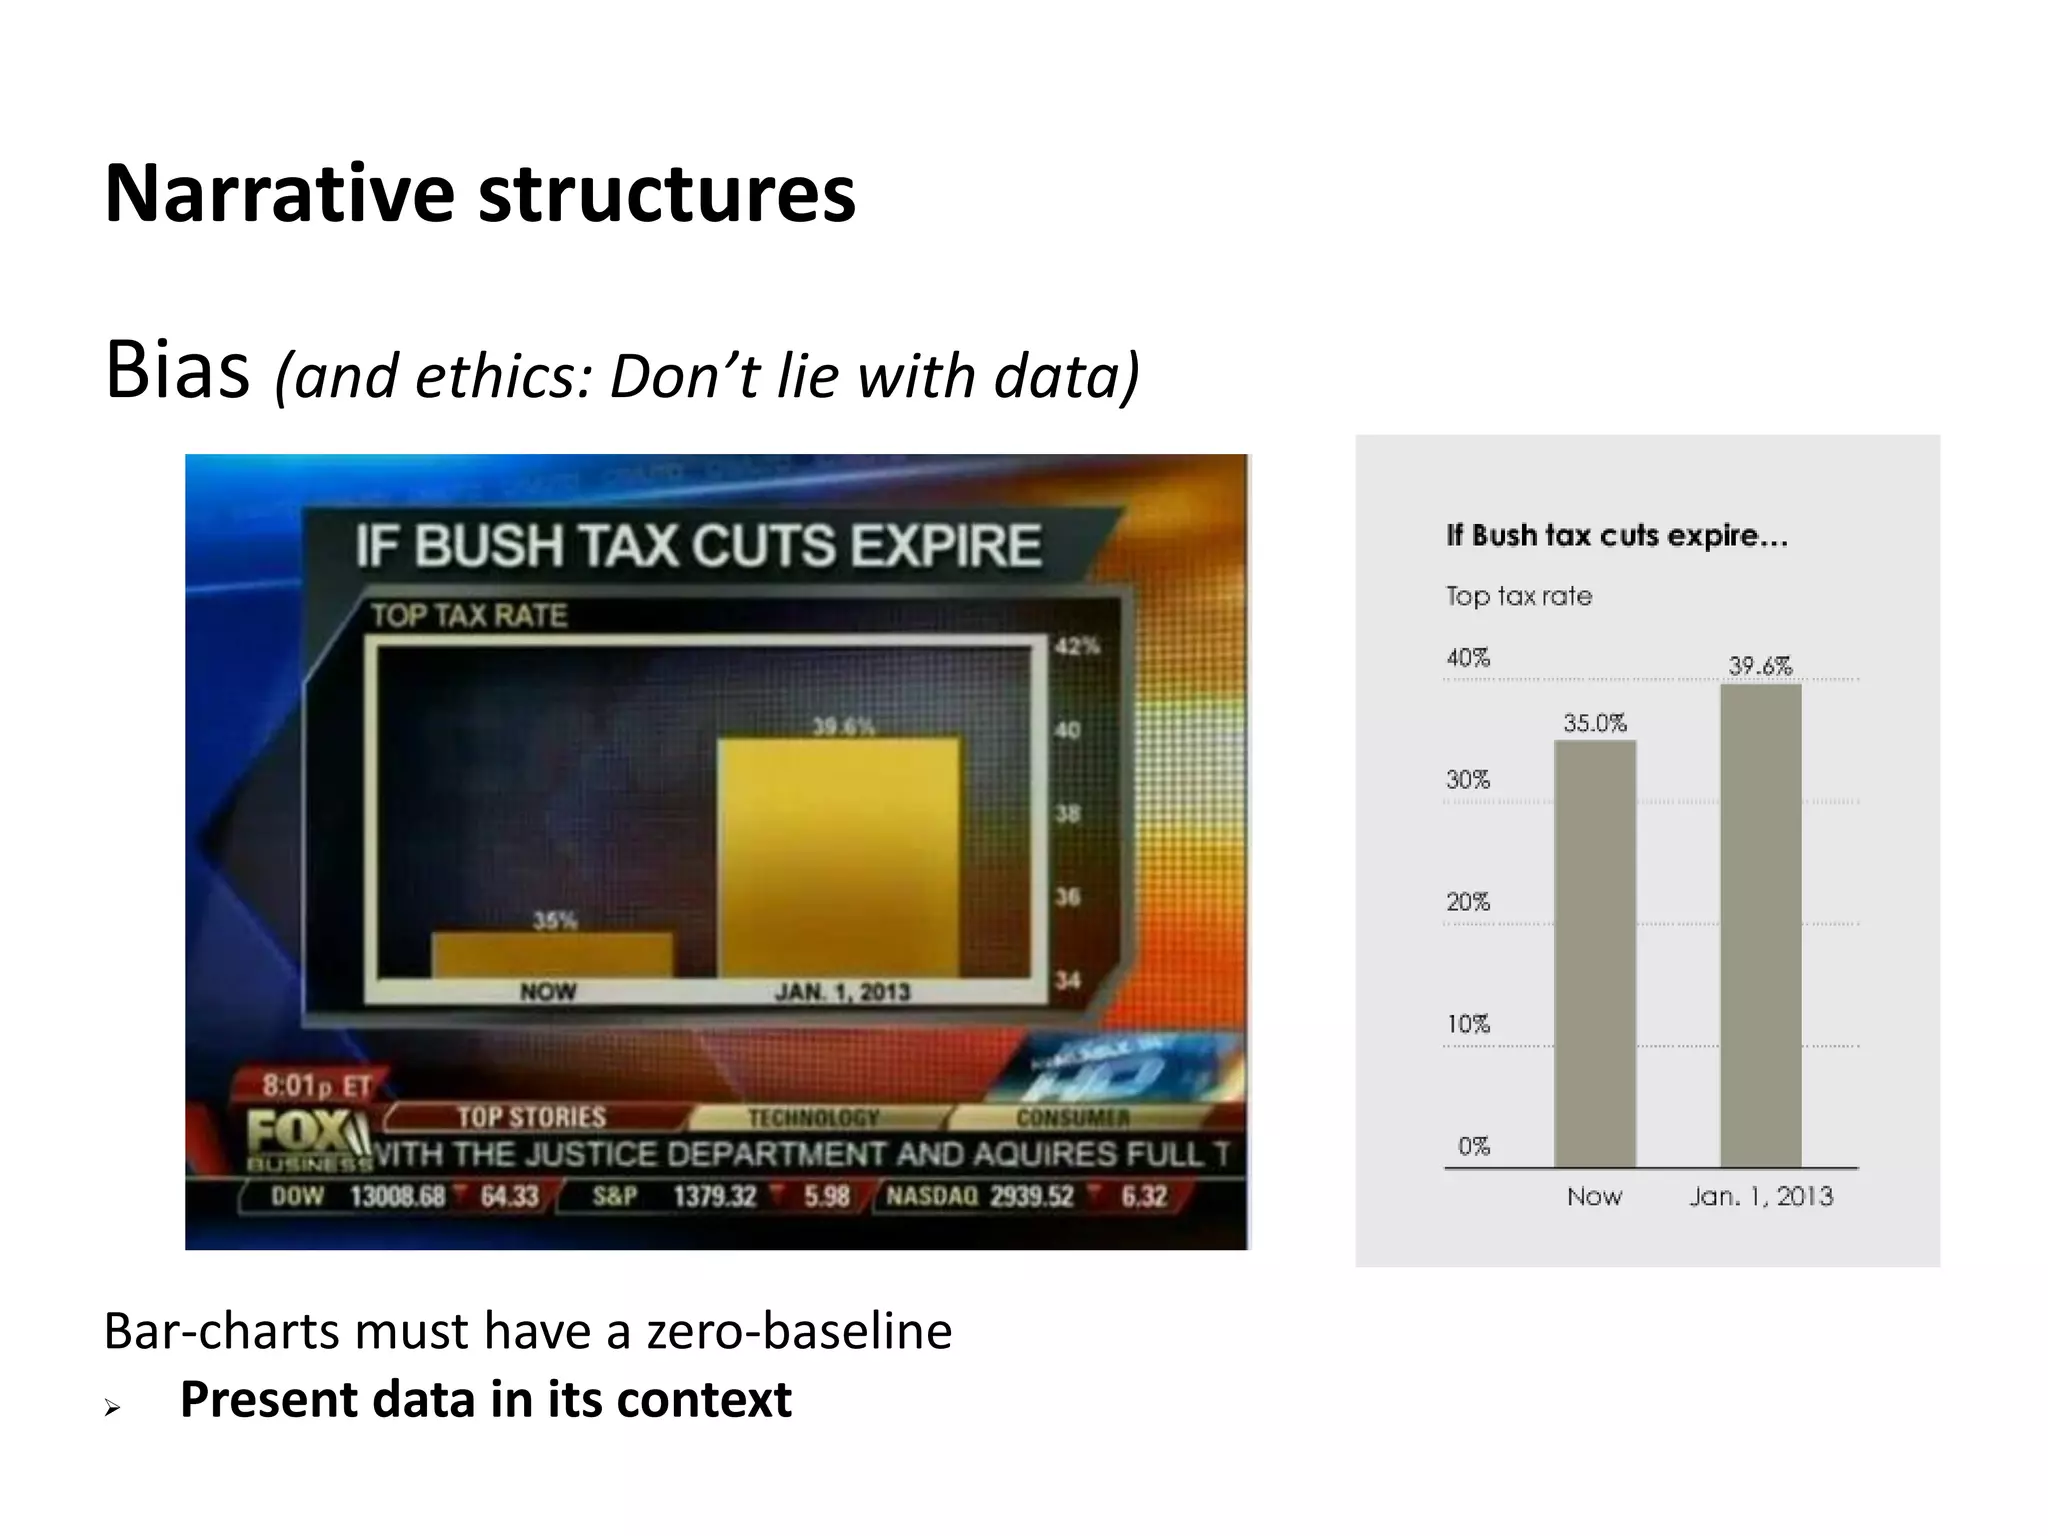
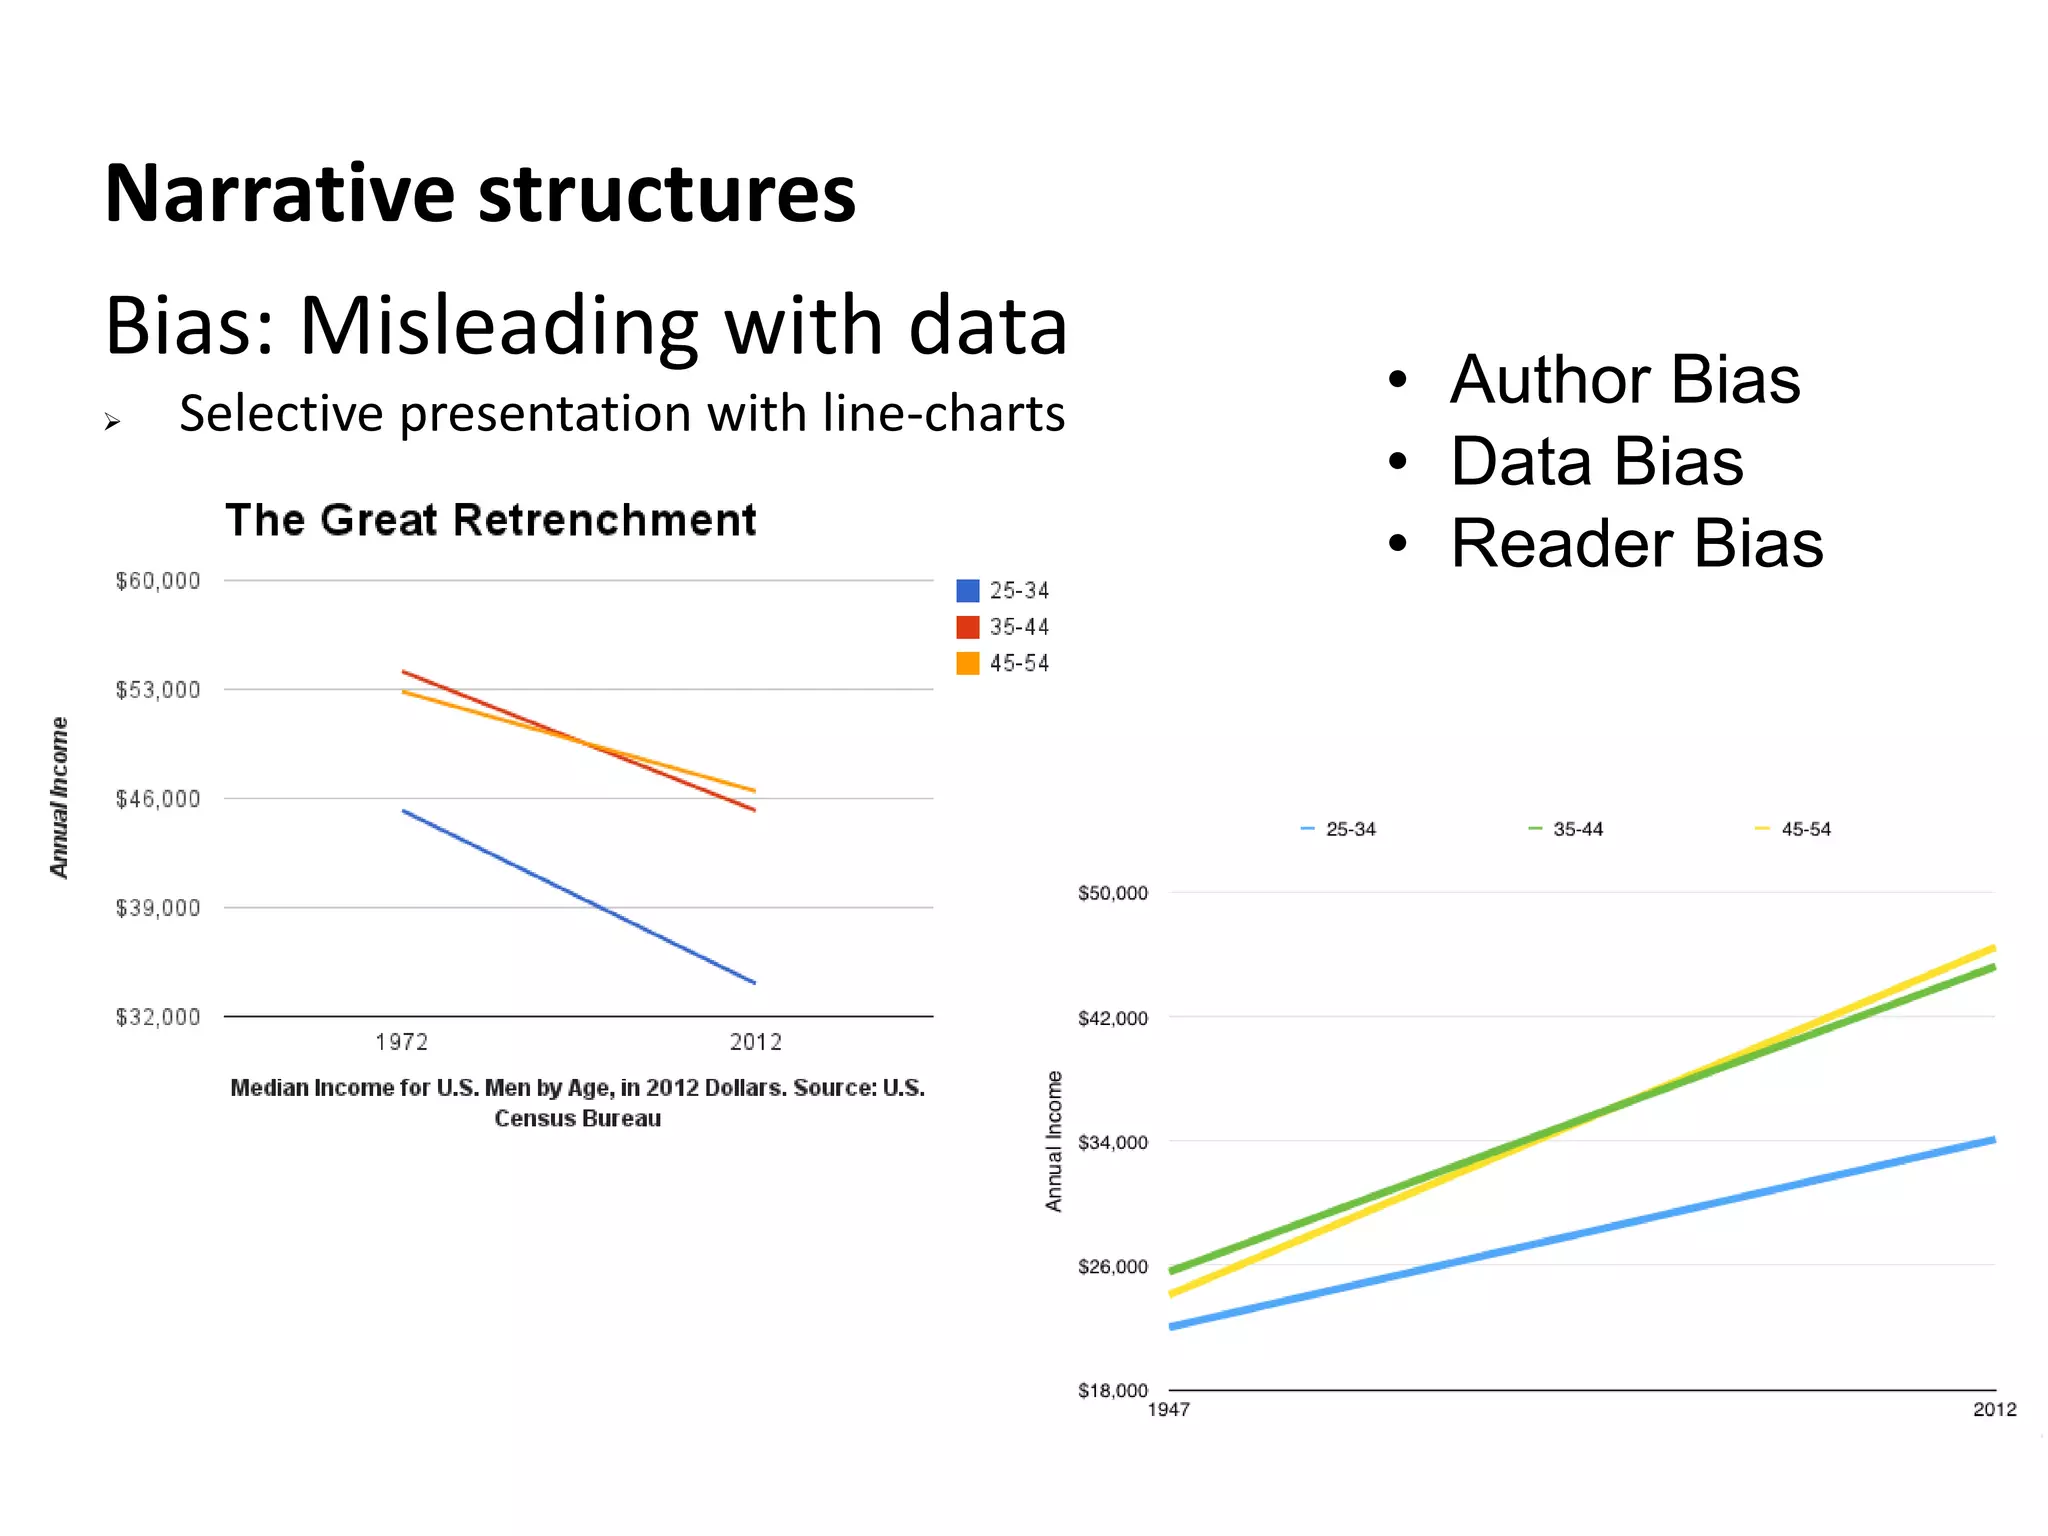
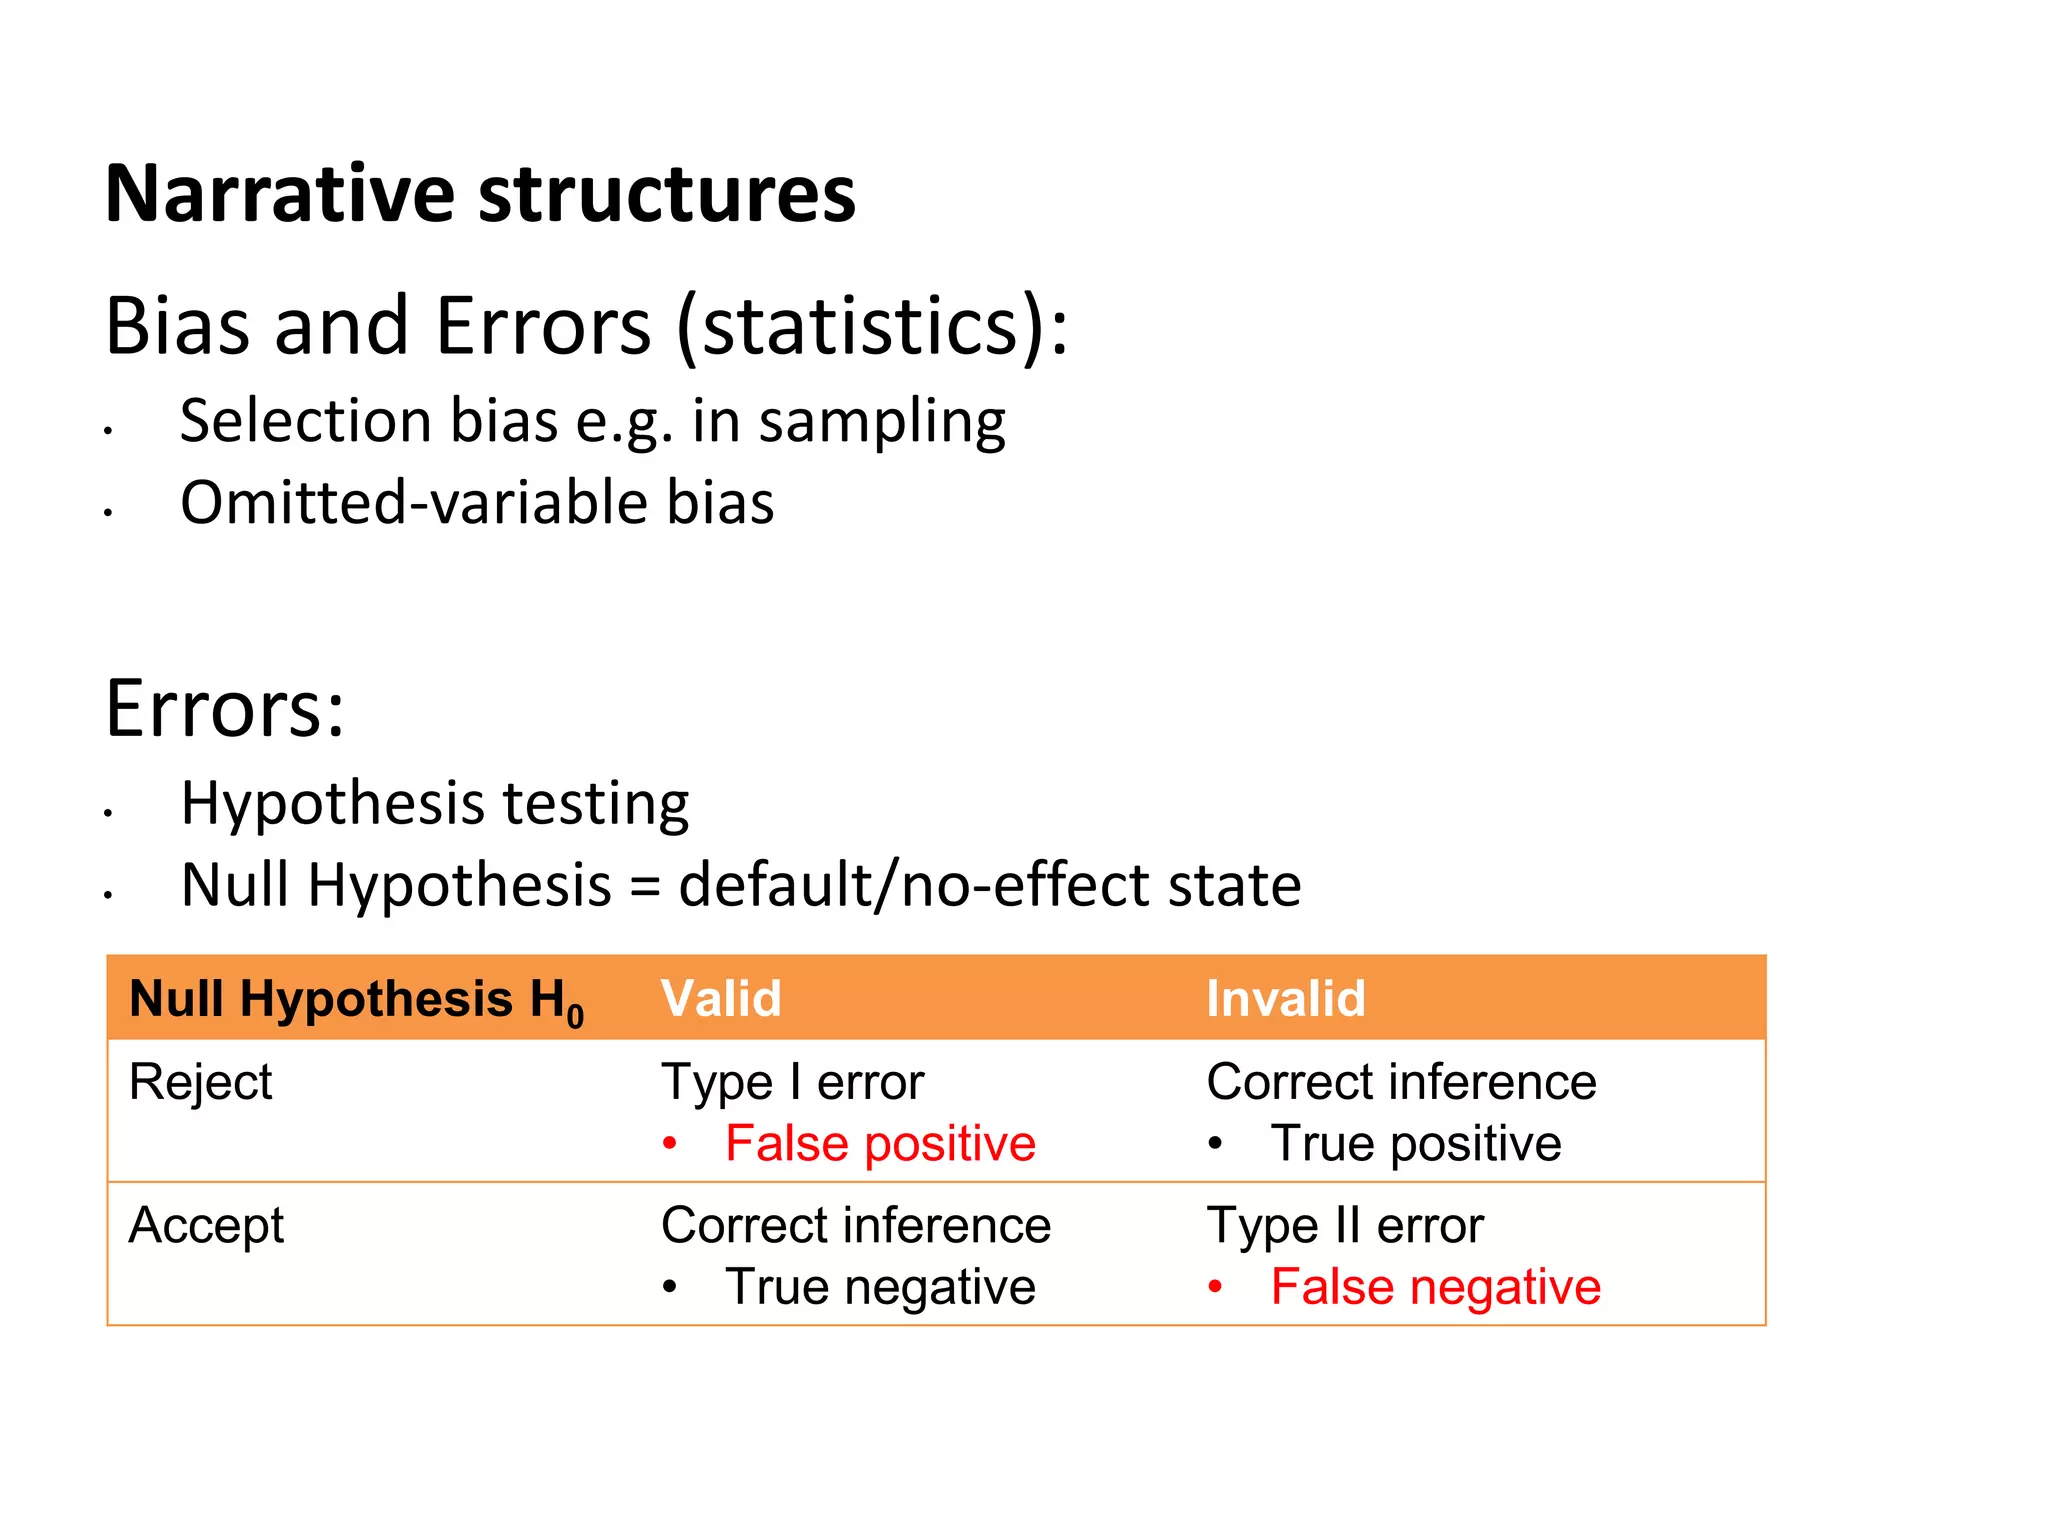
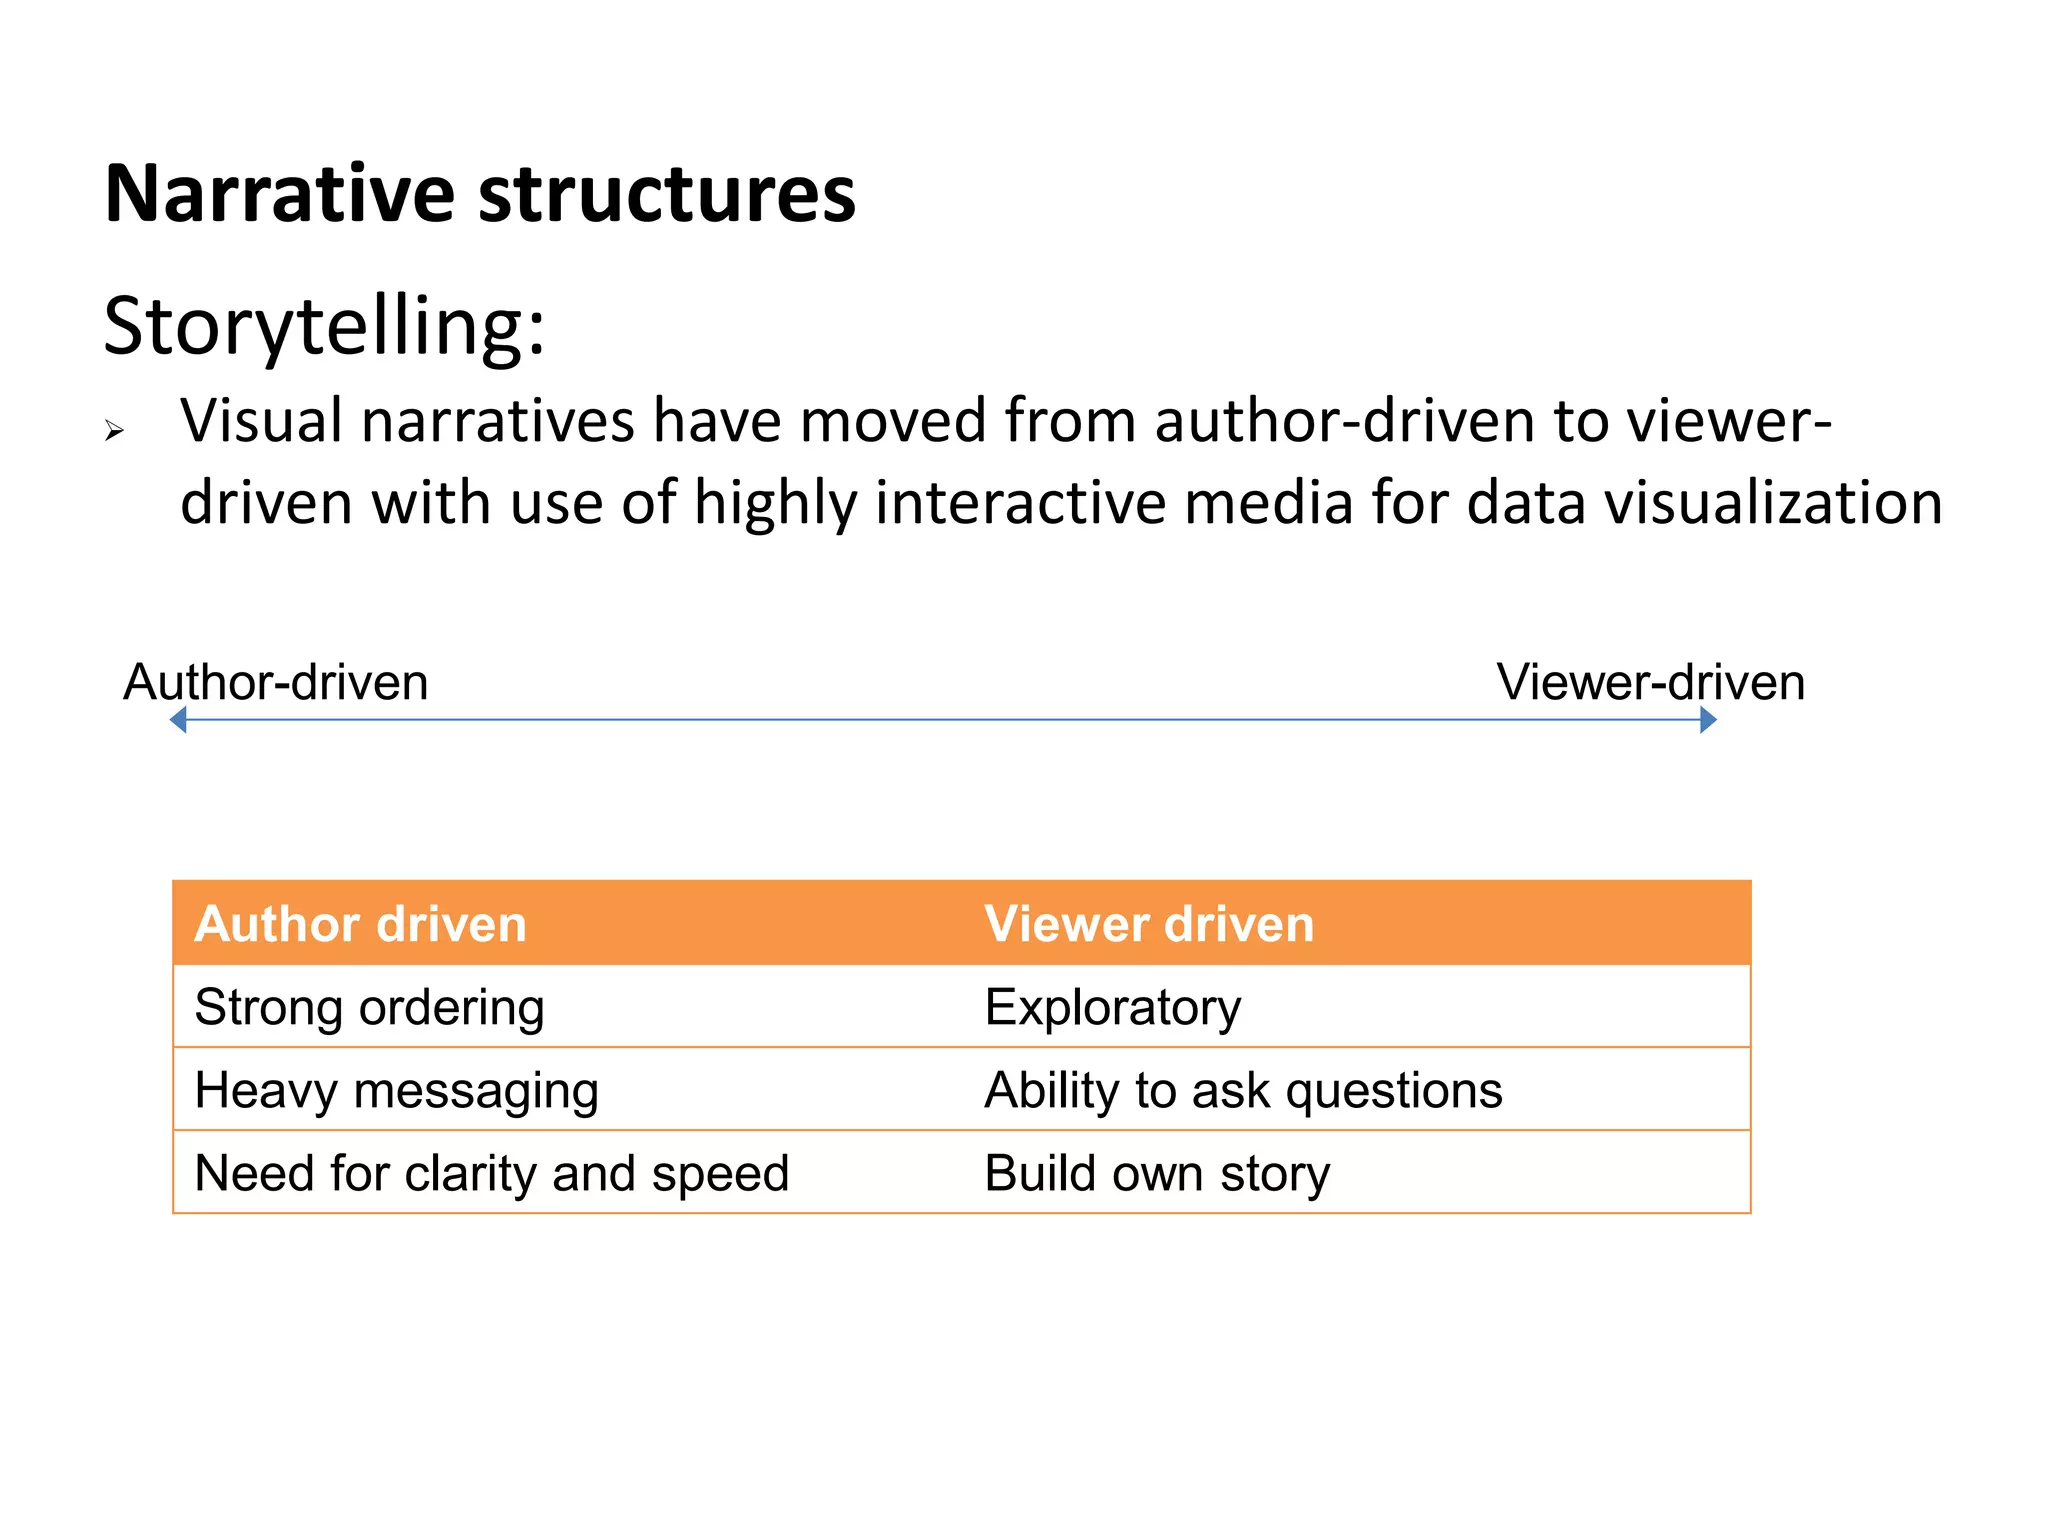
Contrast between traditional journalism and data journalism; discussion on bias, storytelling, and viewer-driven narratives.
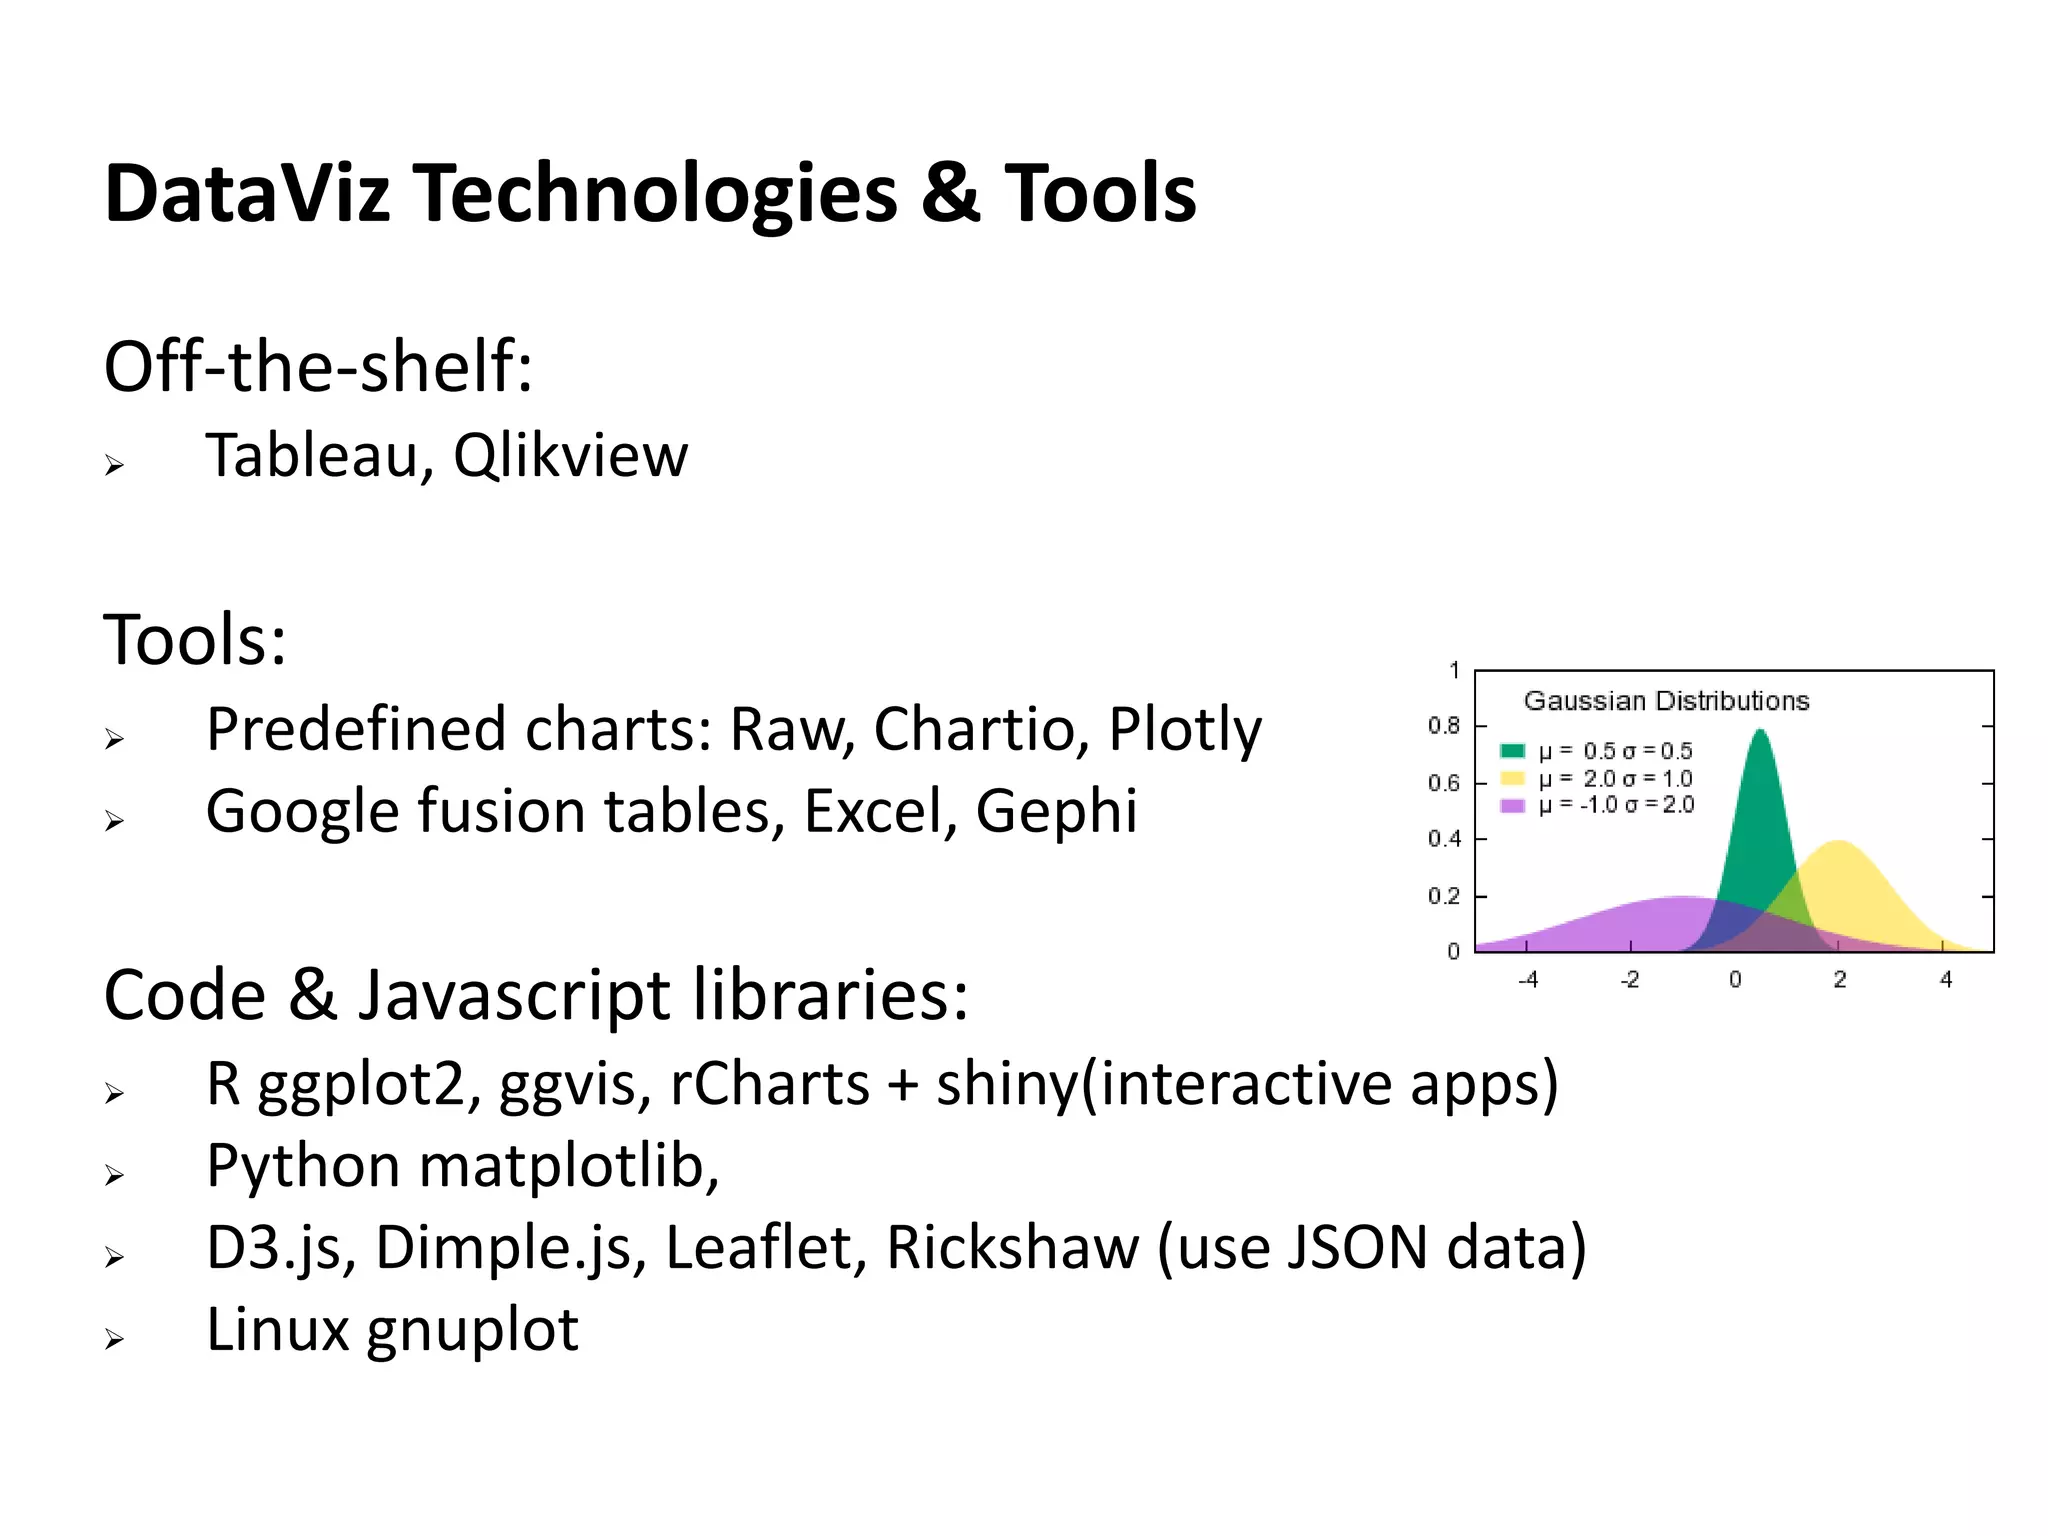
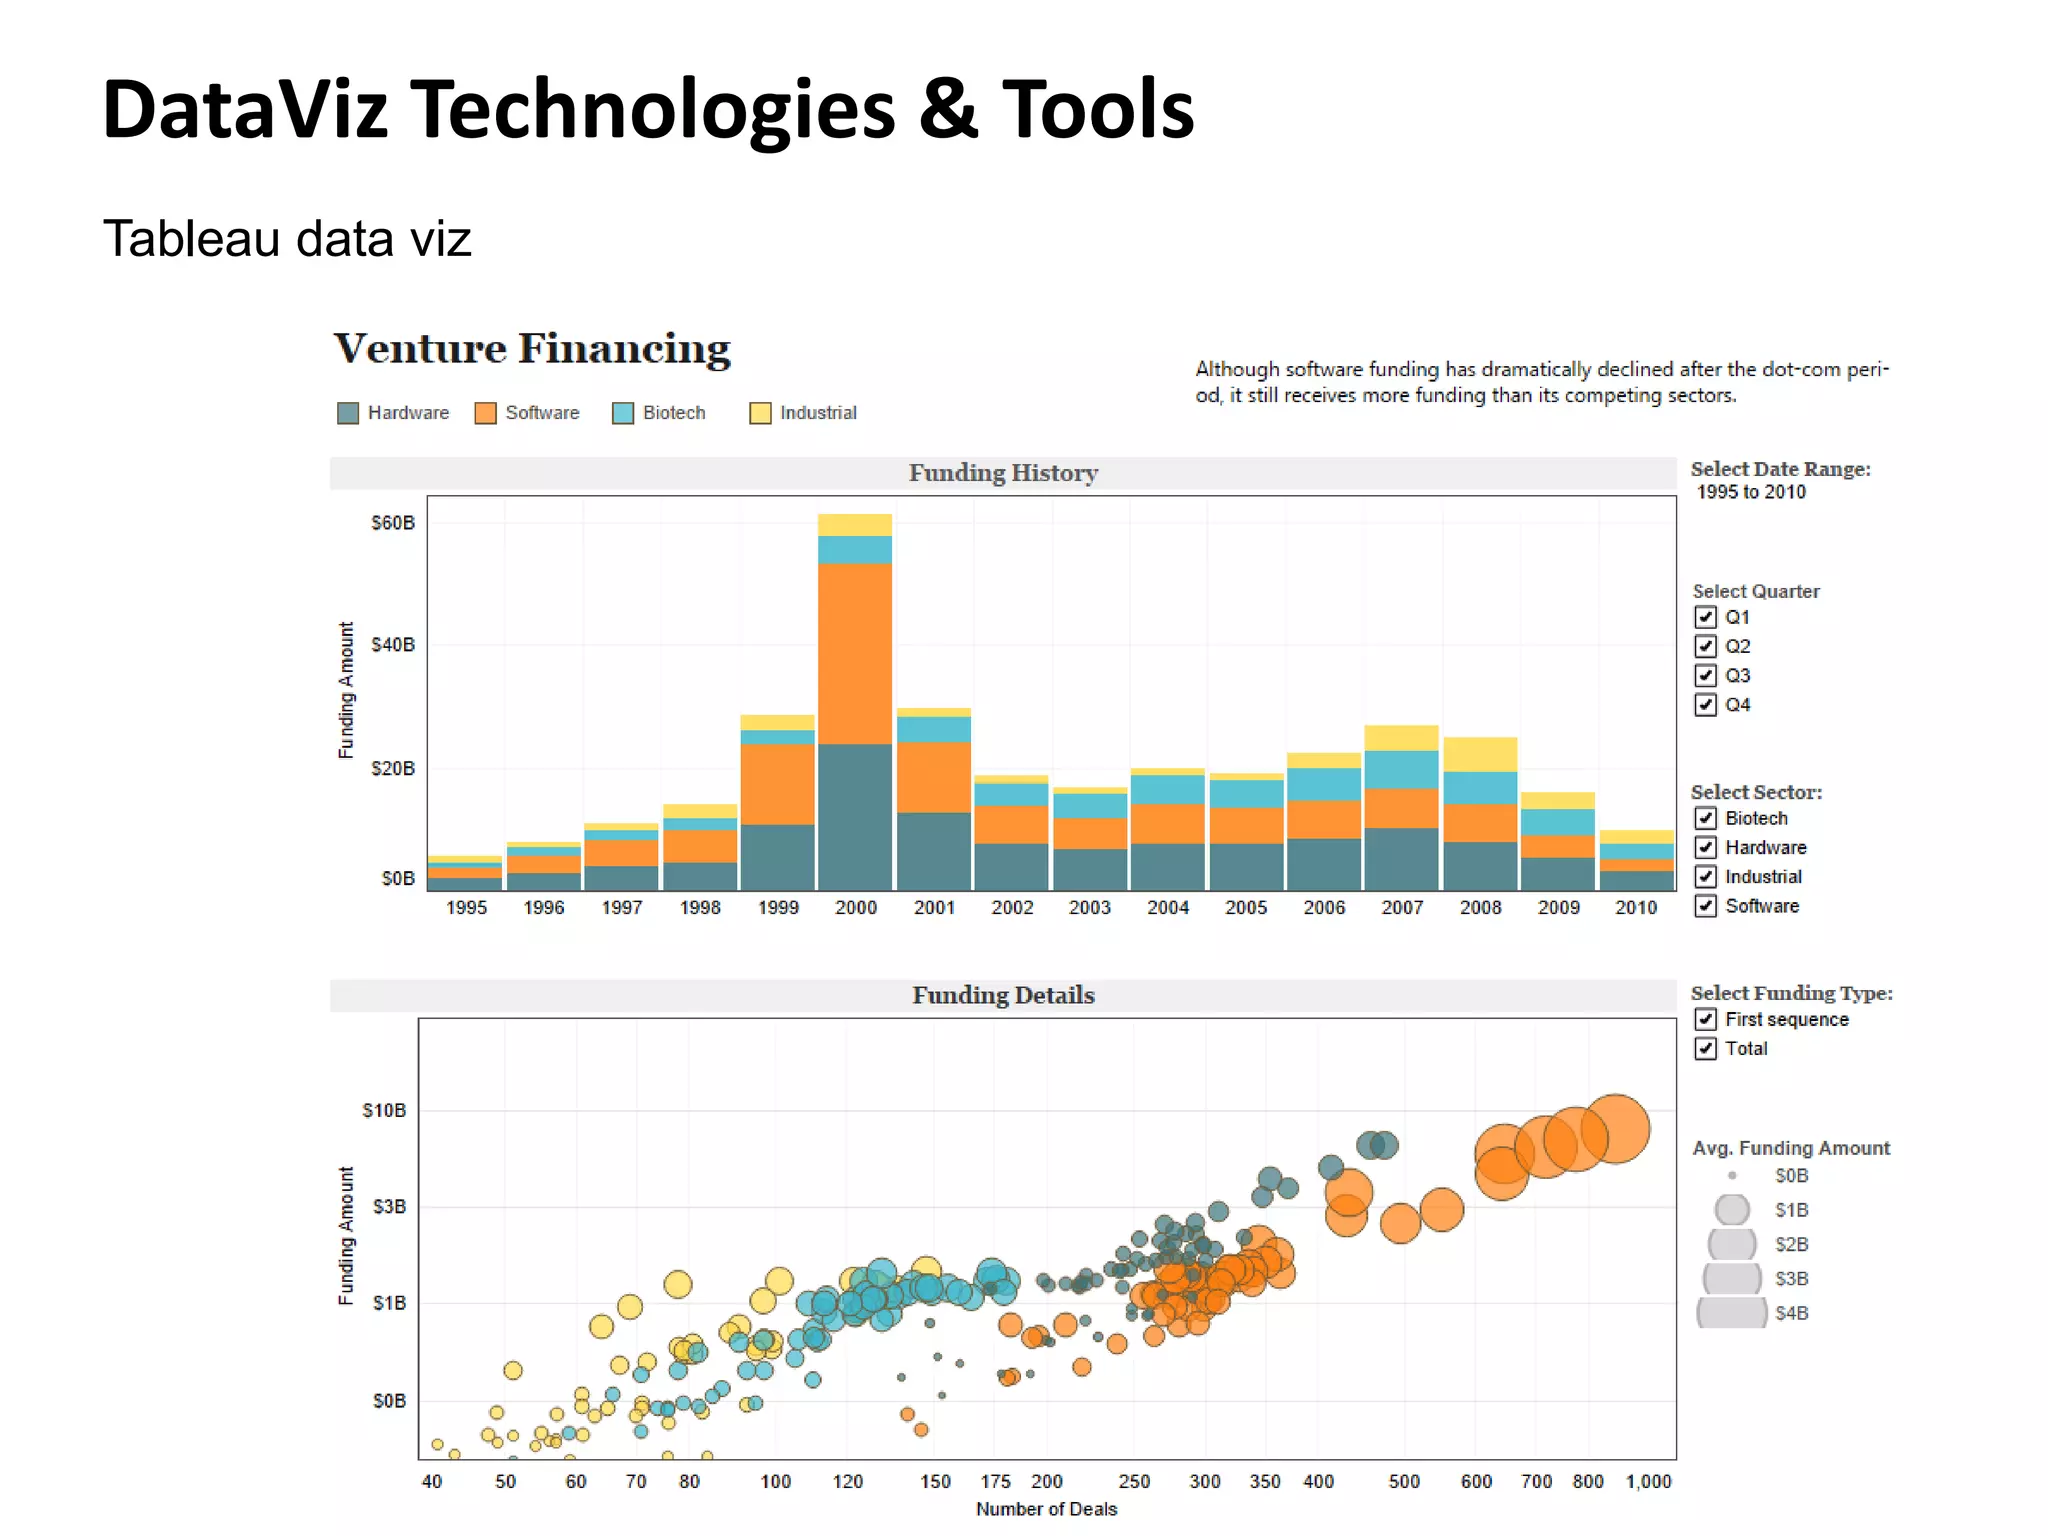
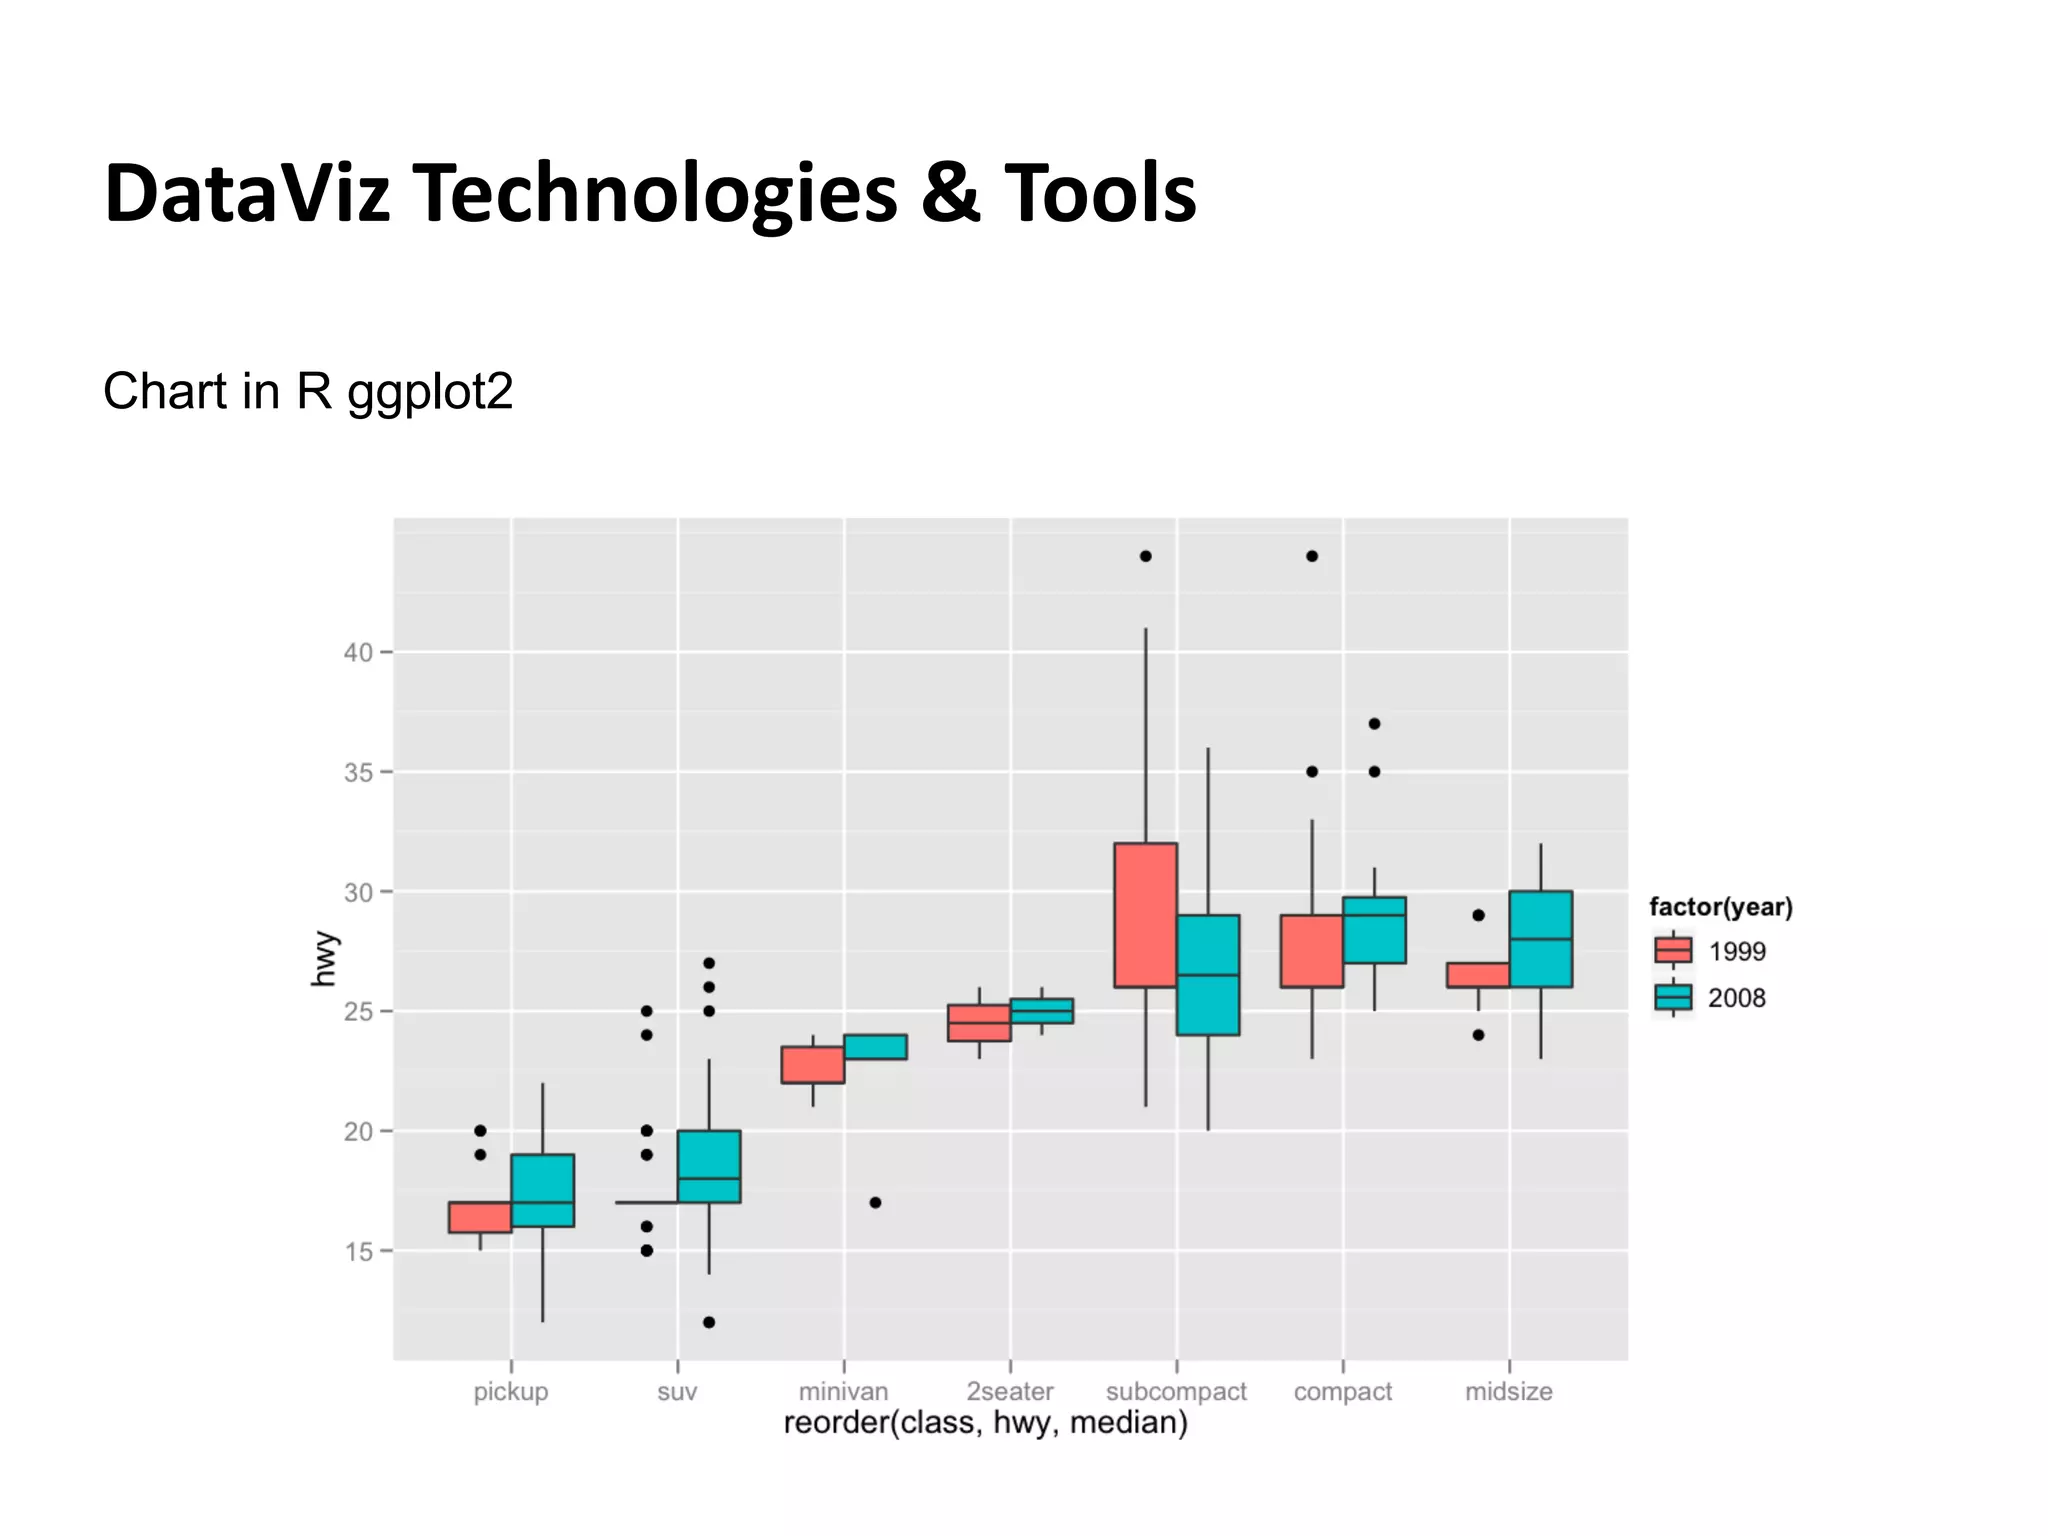
Overview of various tools and technologies for data visualization, including both software and coding options.
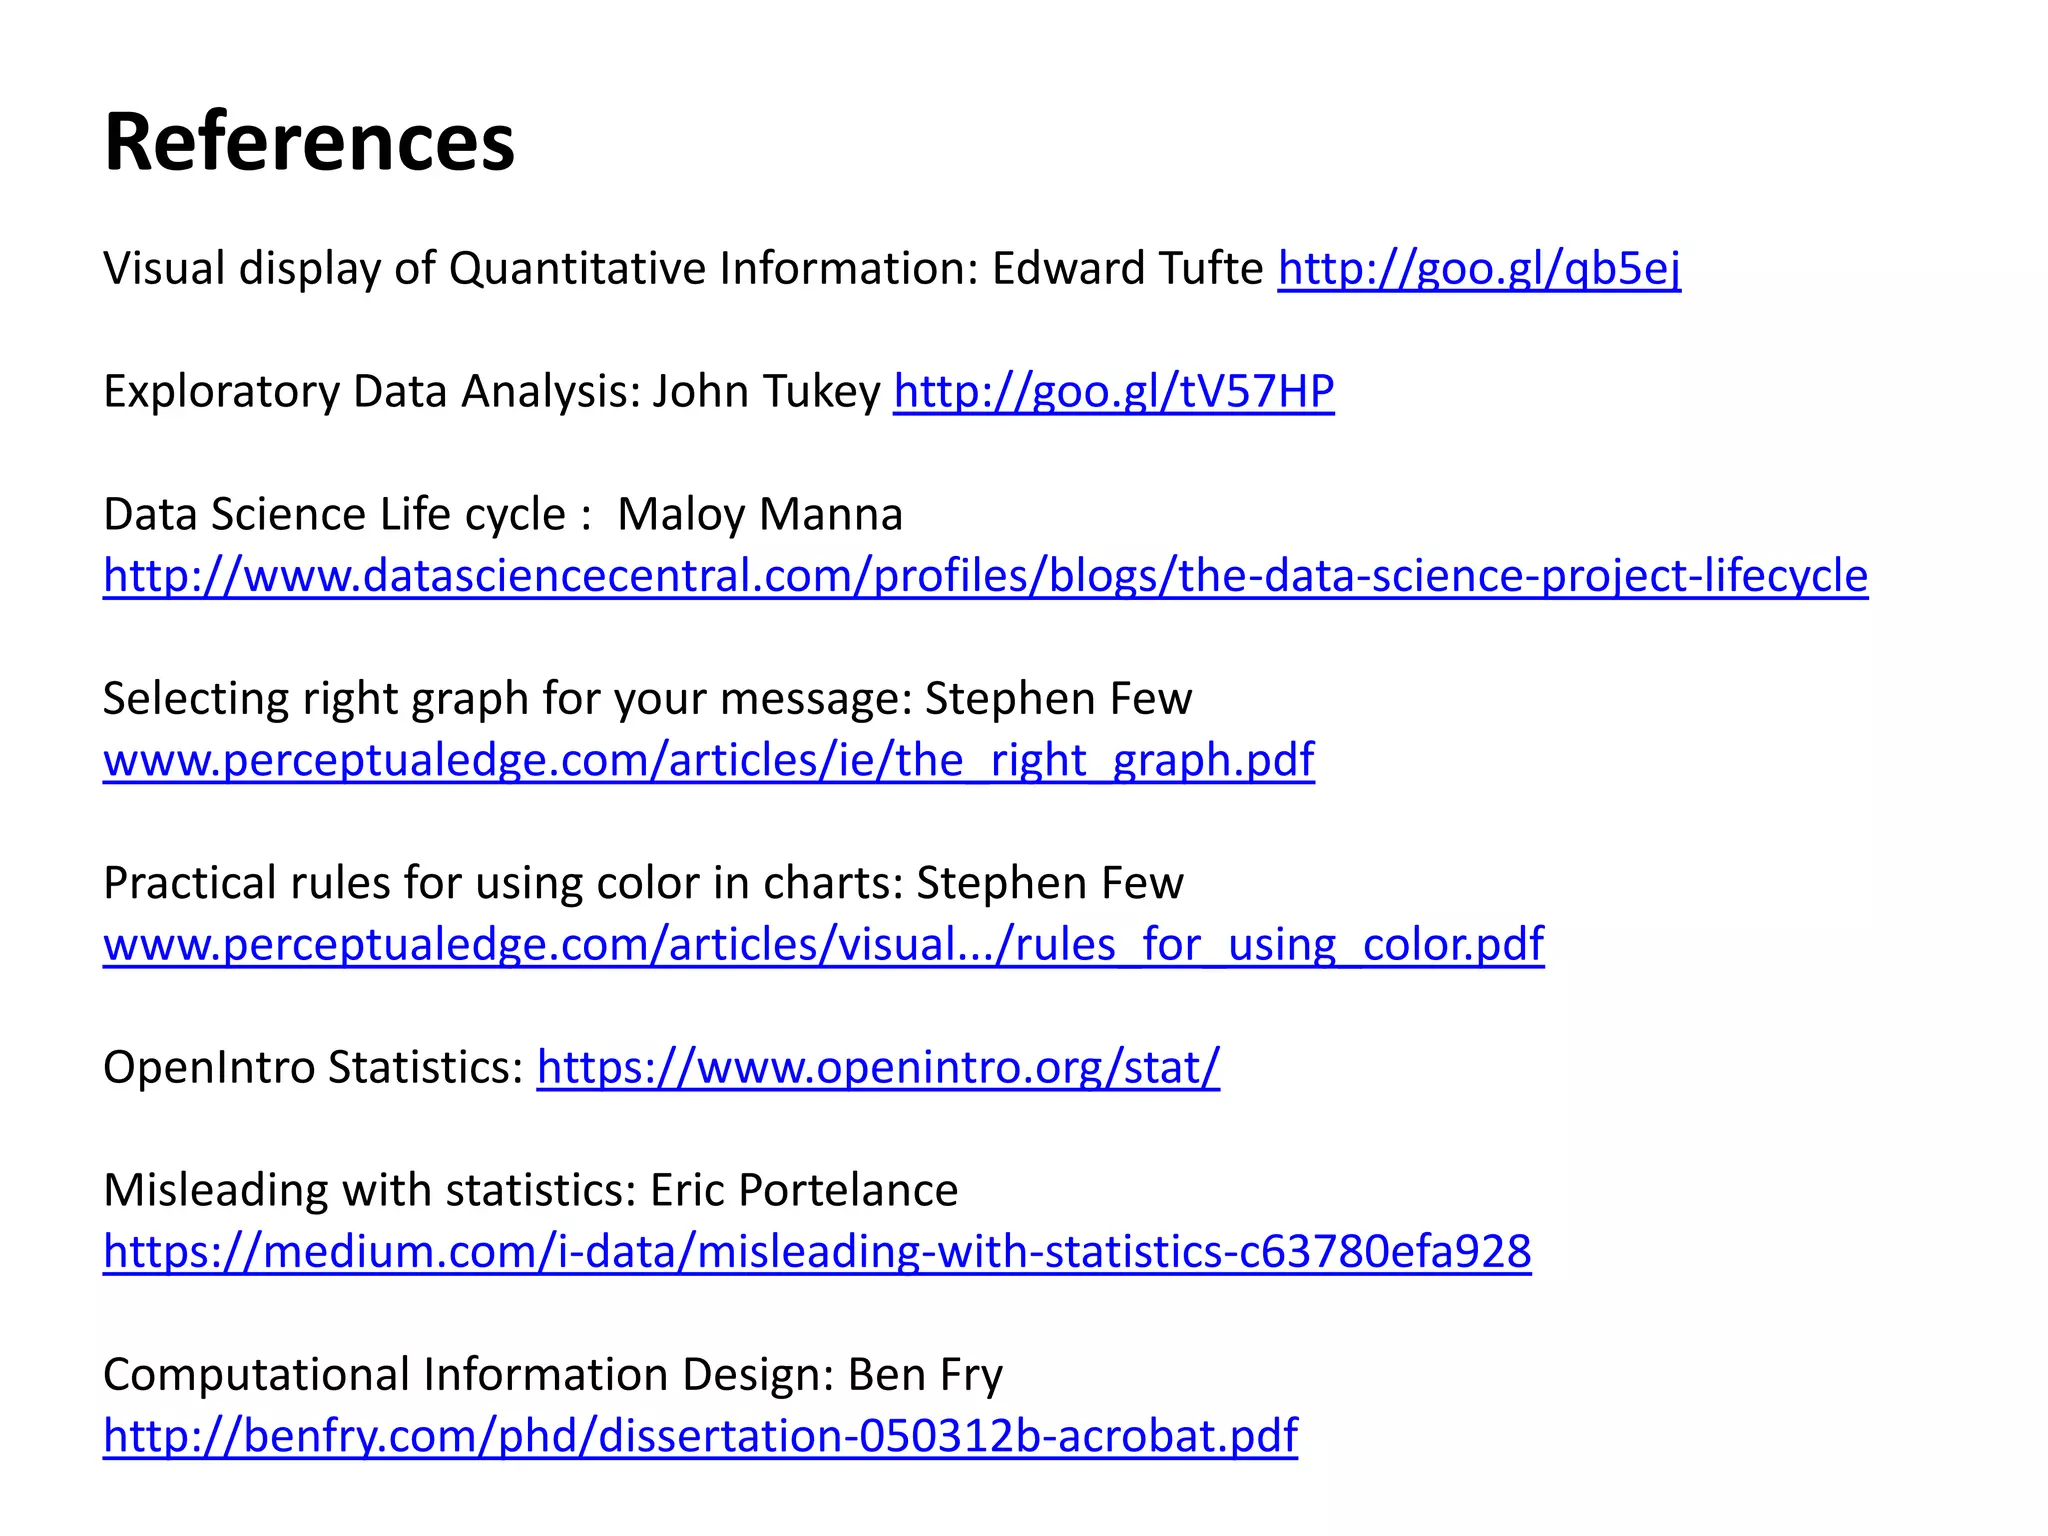
Cited works and resources for further reading on data visualization, exploratory data analysis, and selecting appropriate graphs.