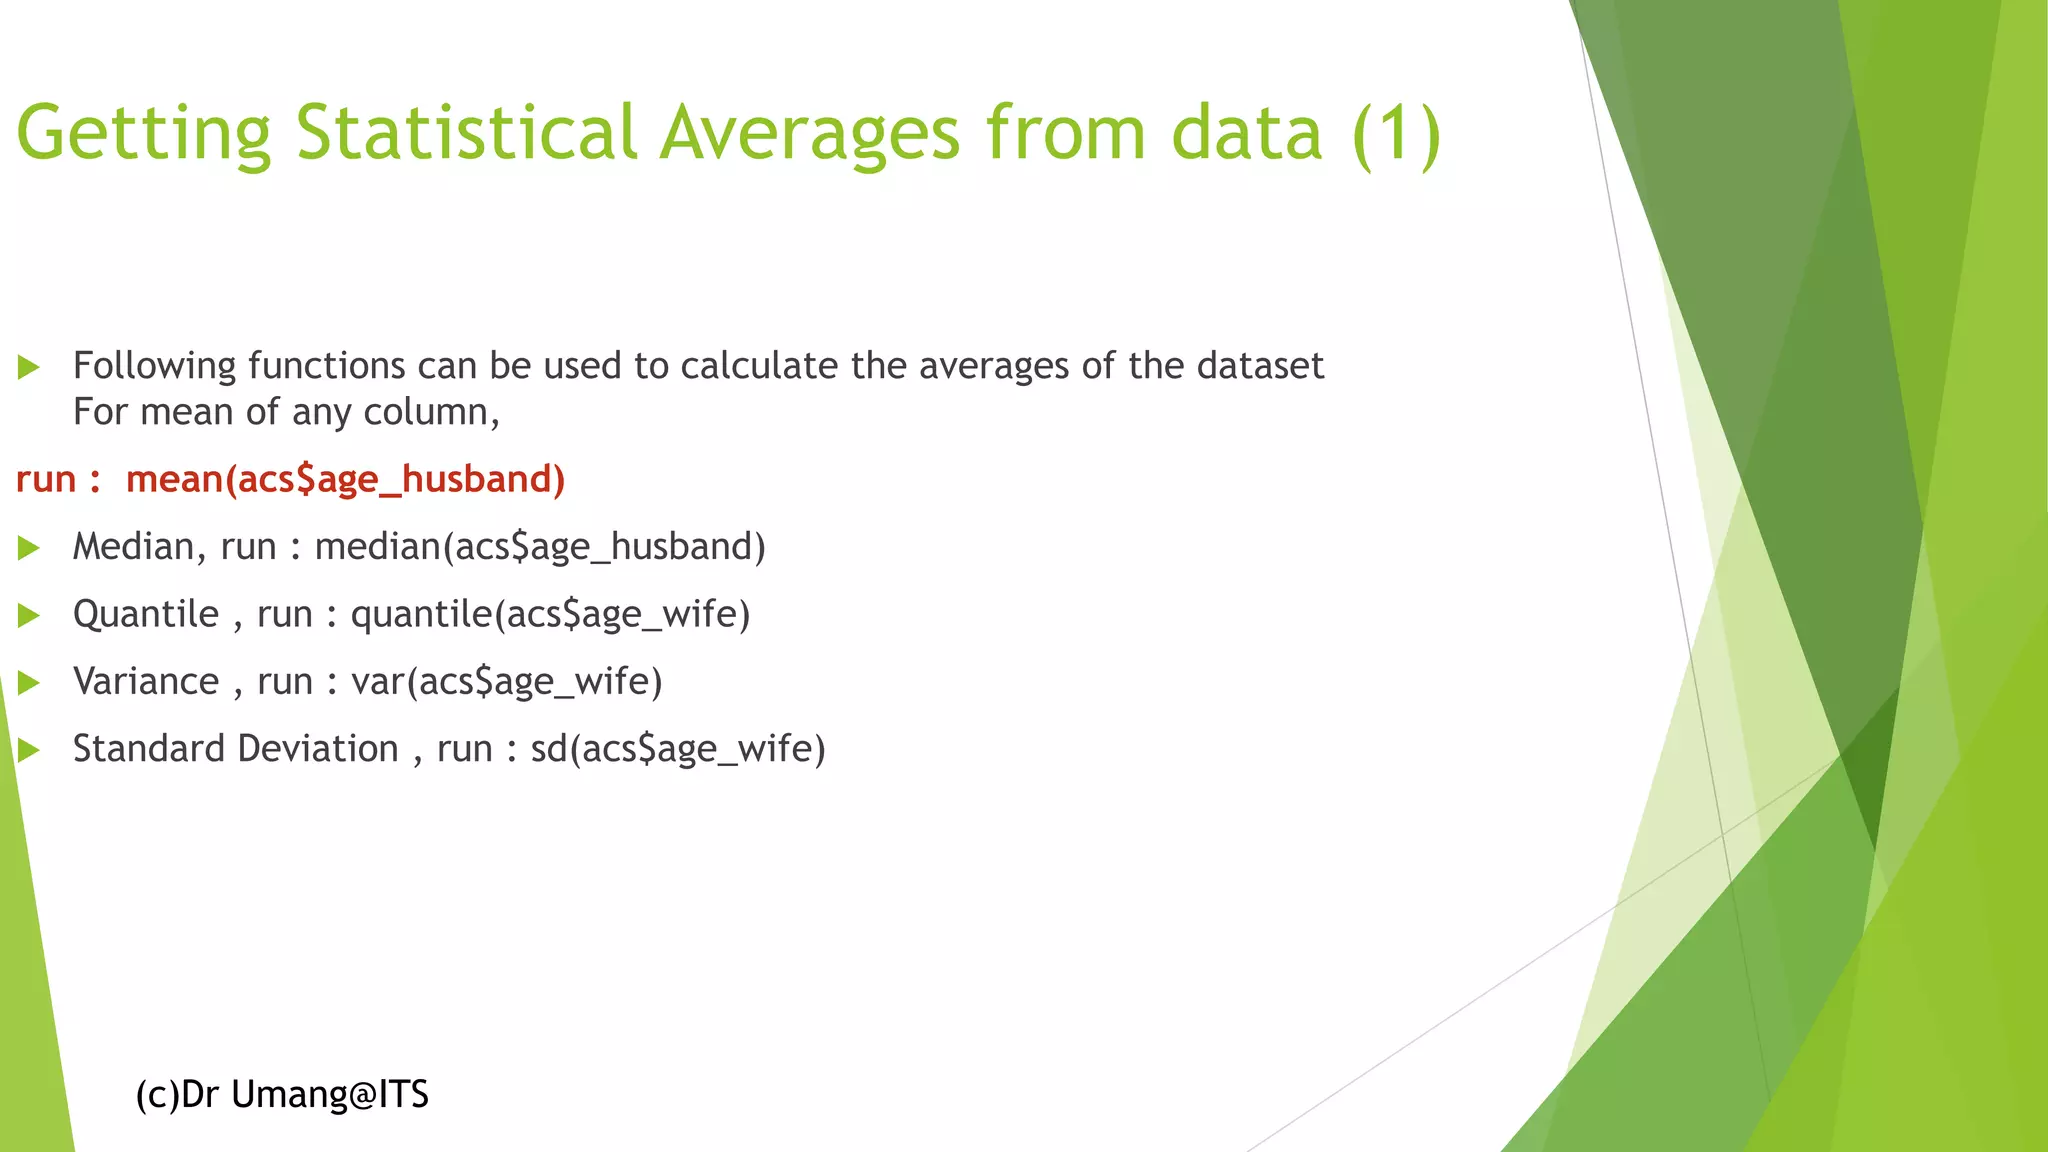
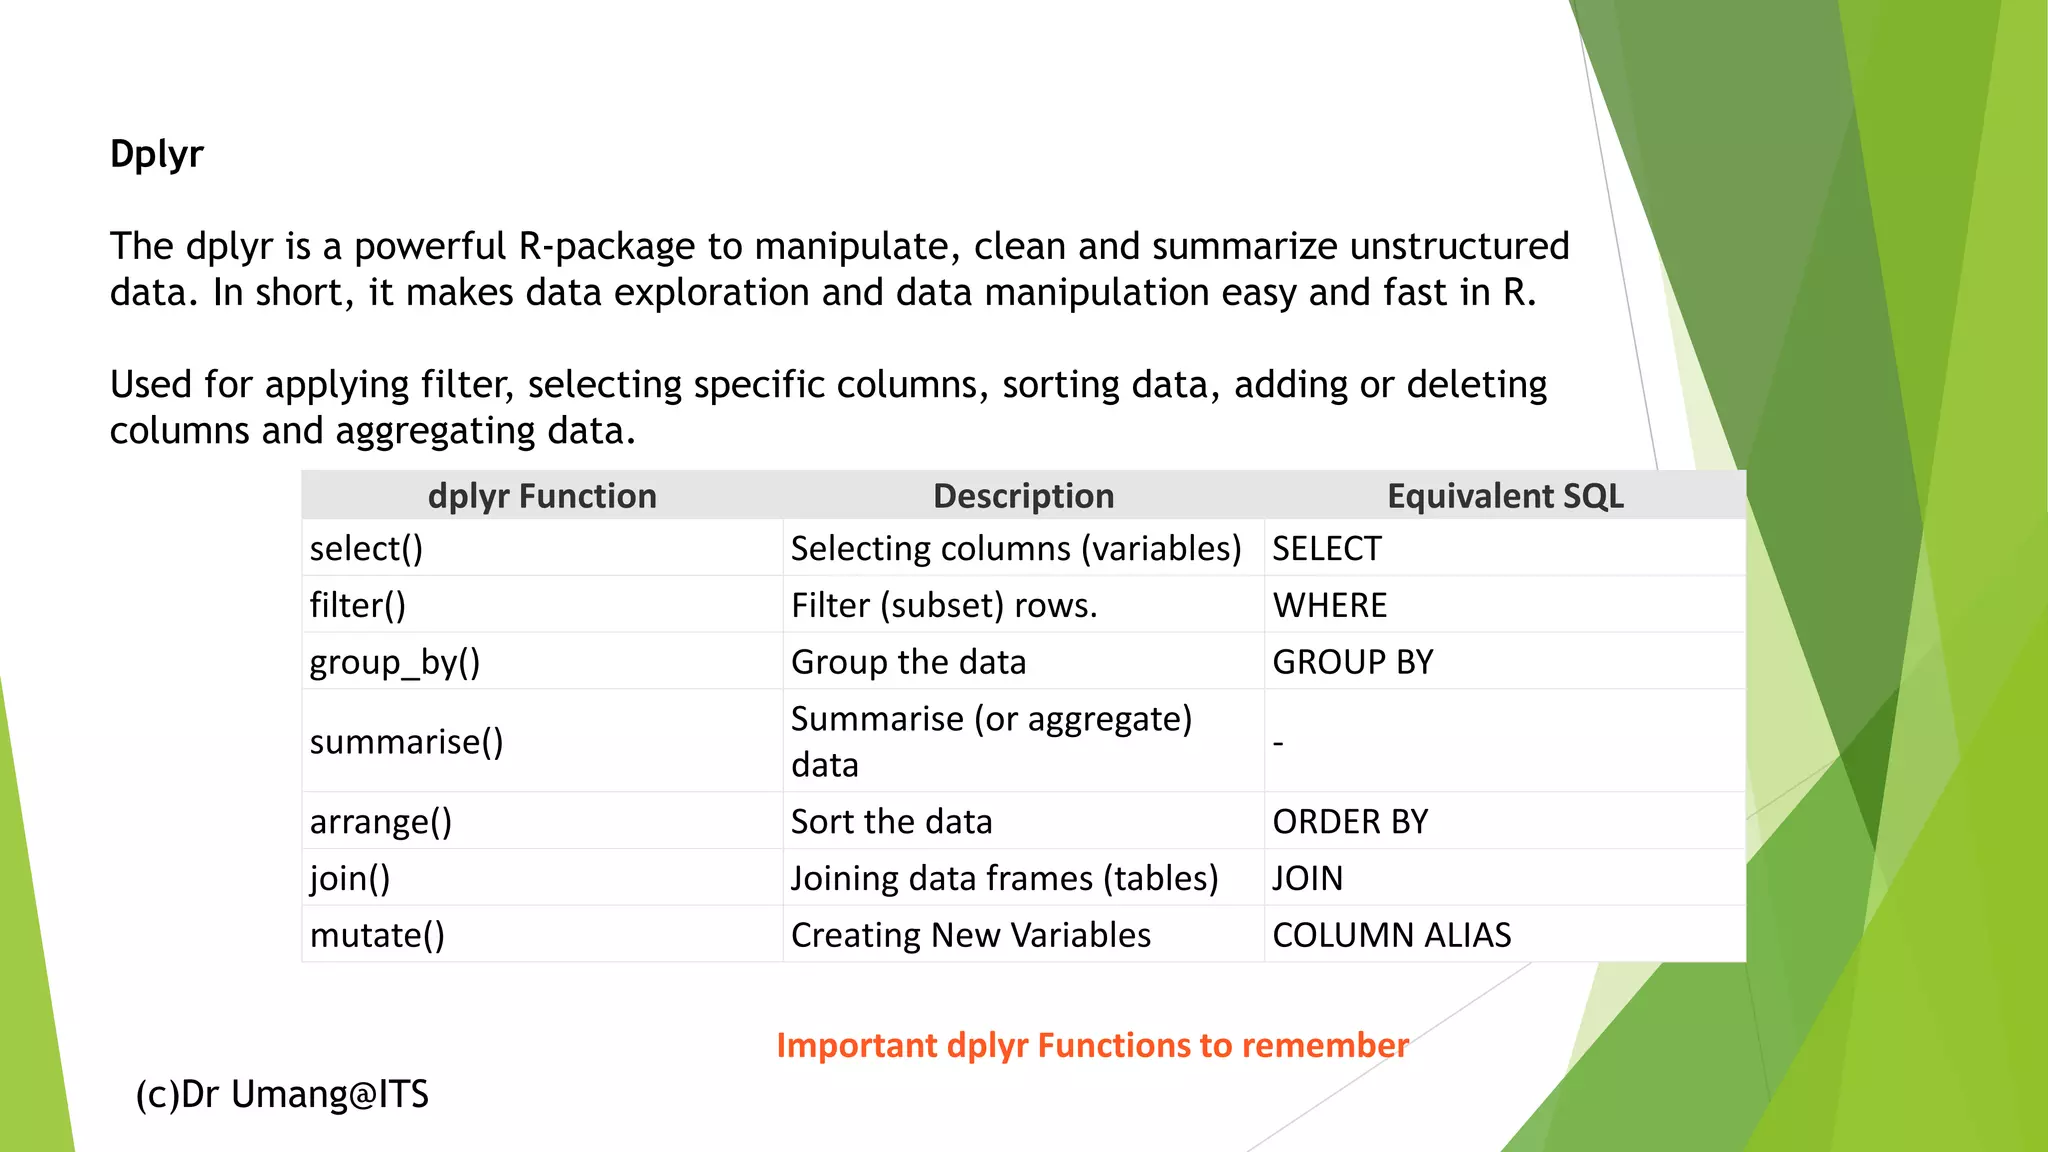
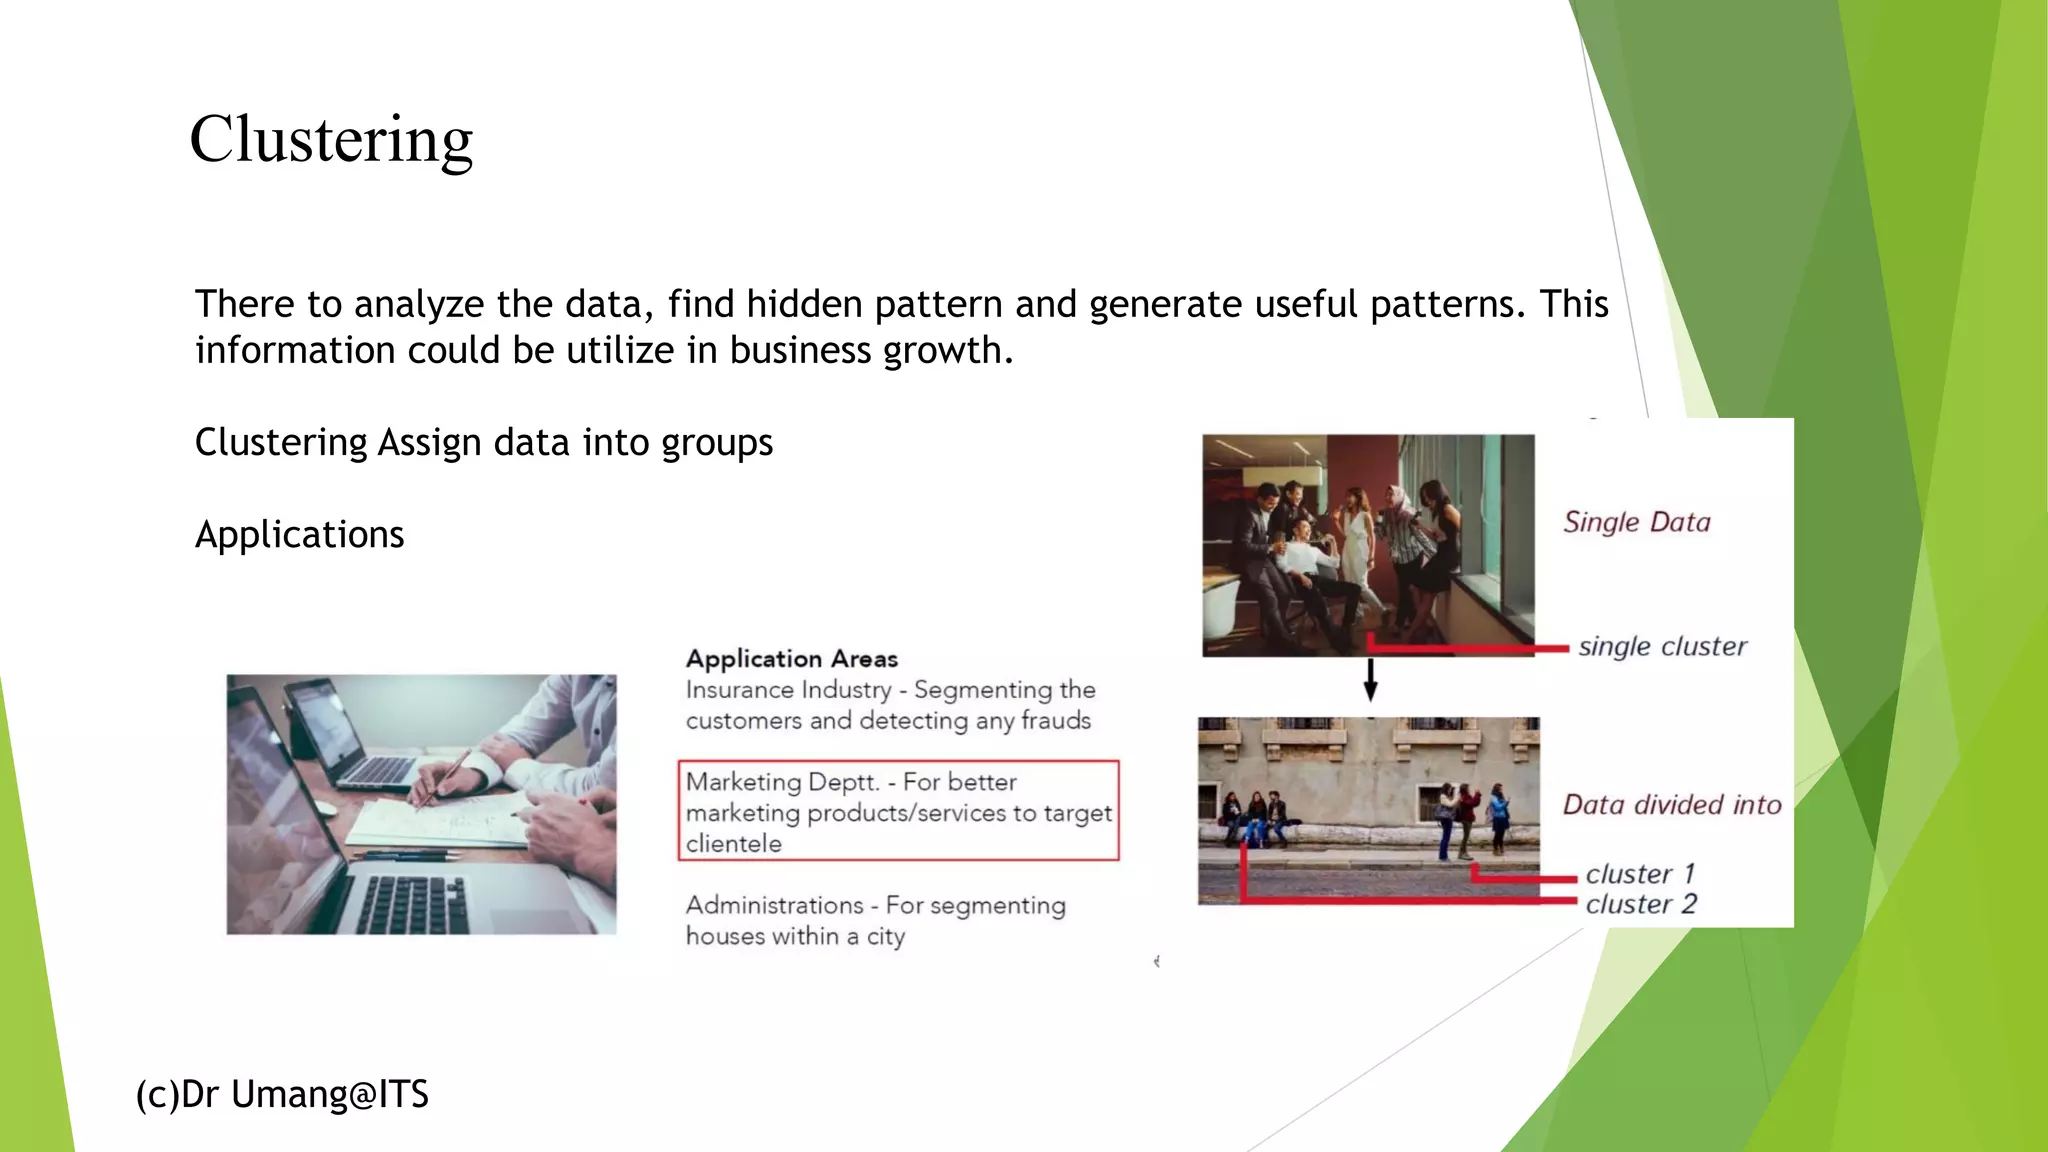
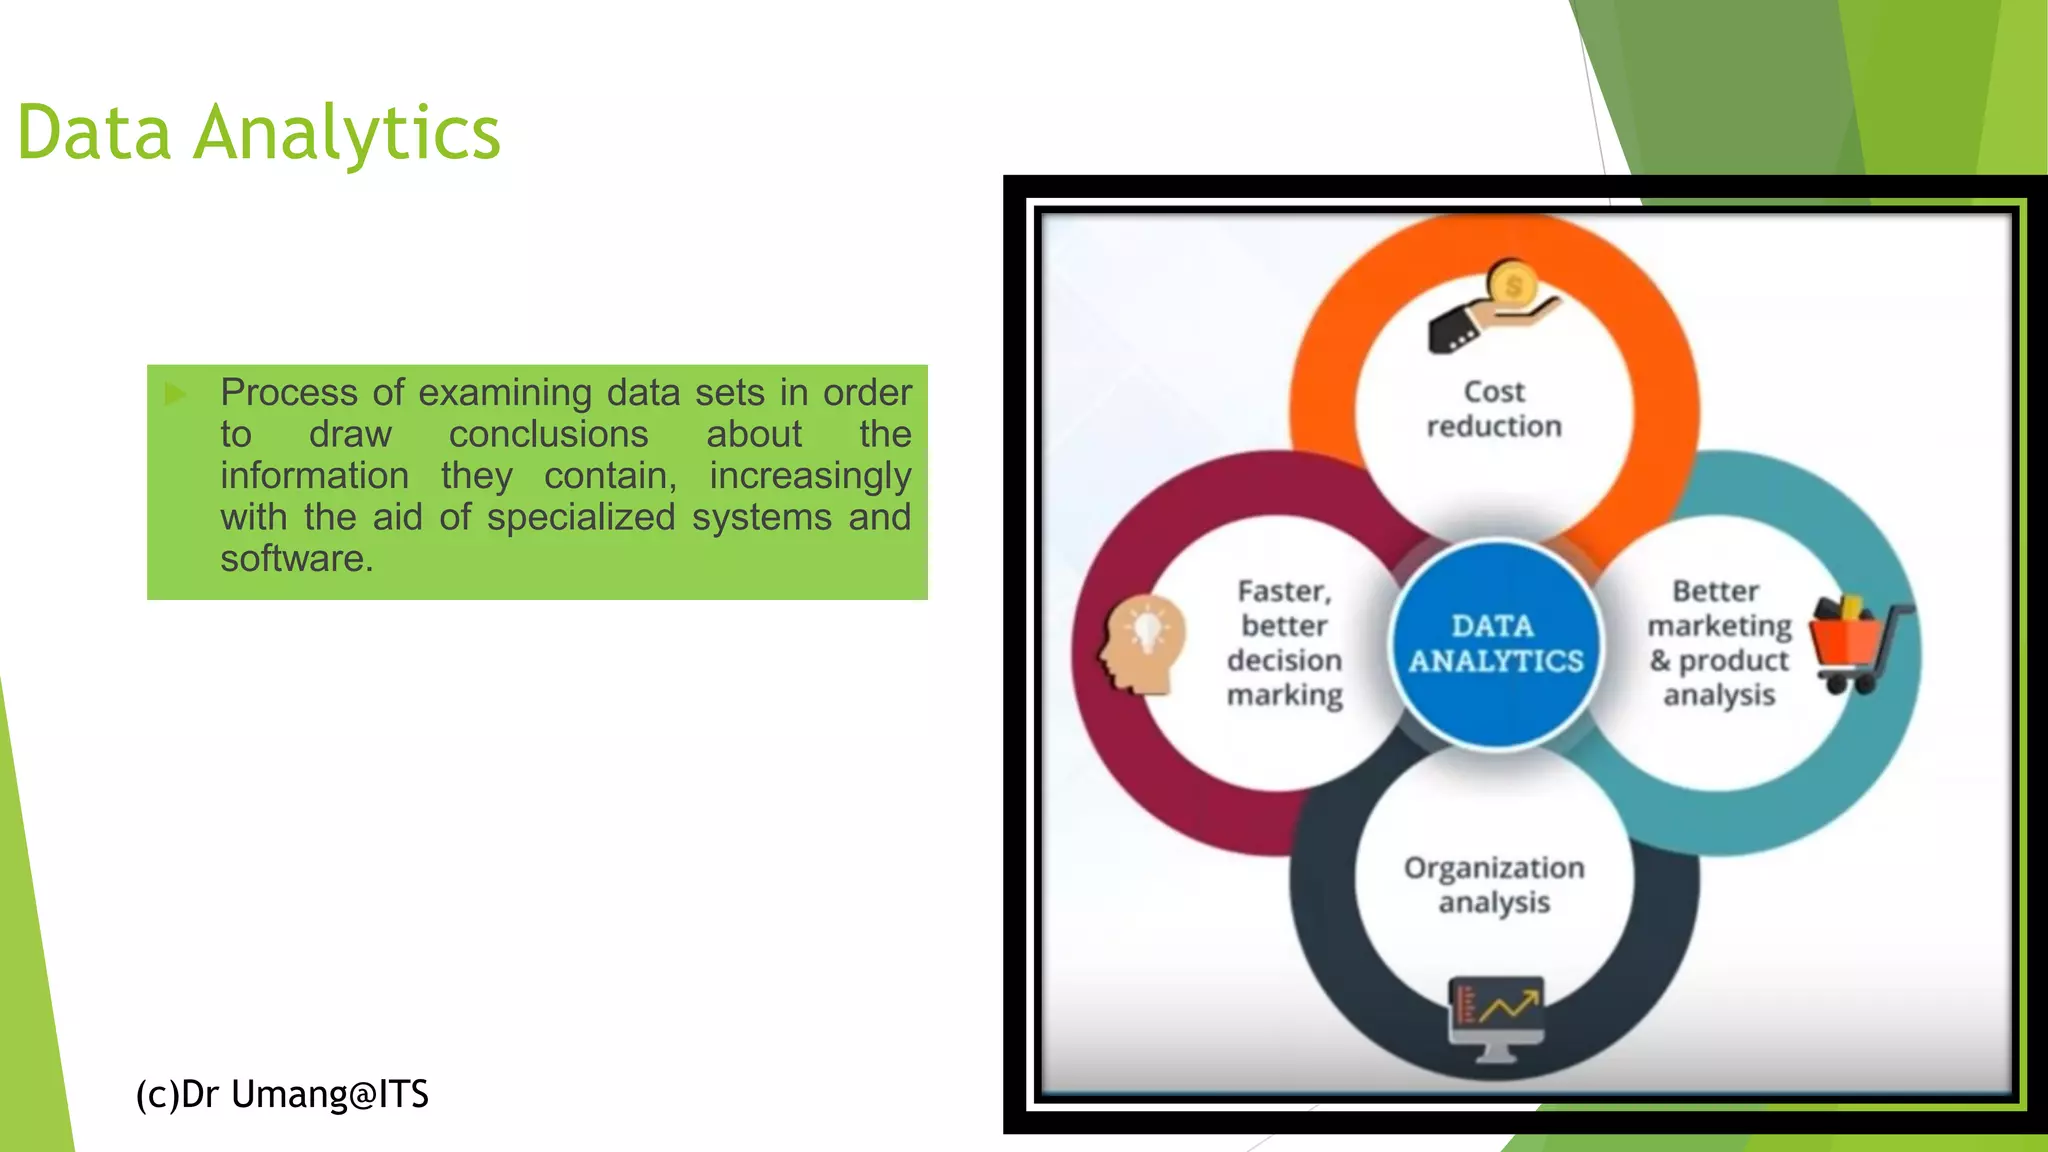
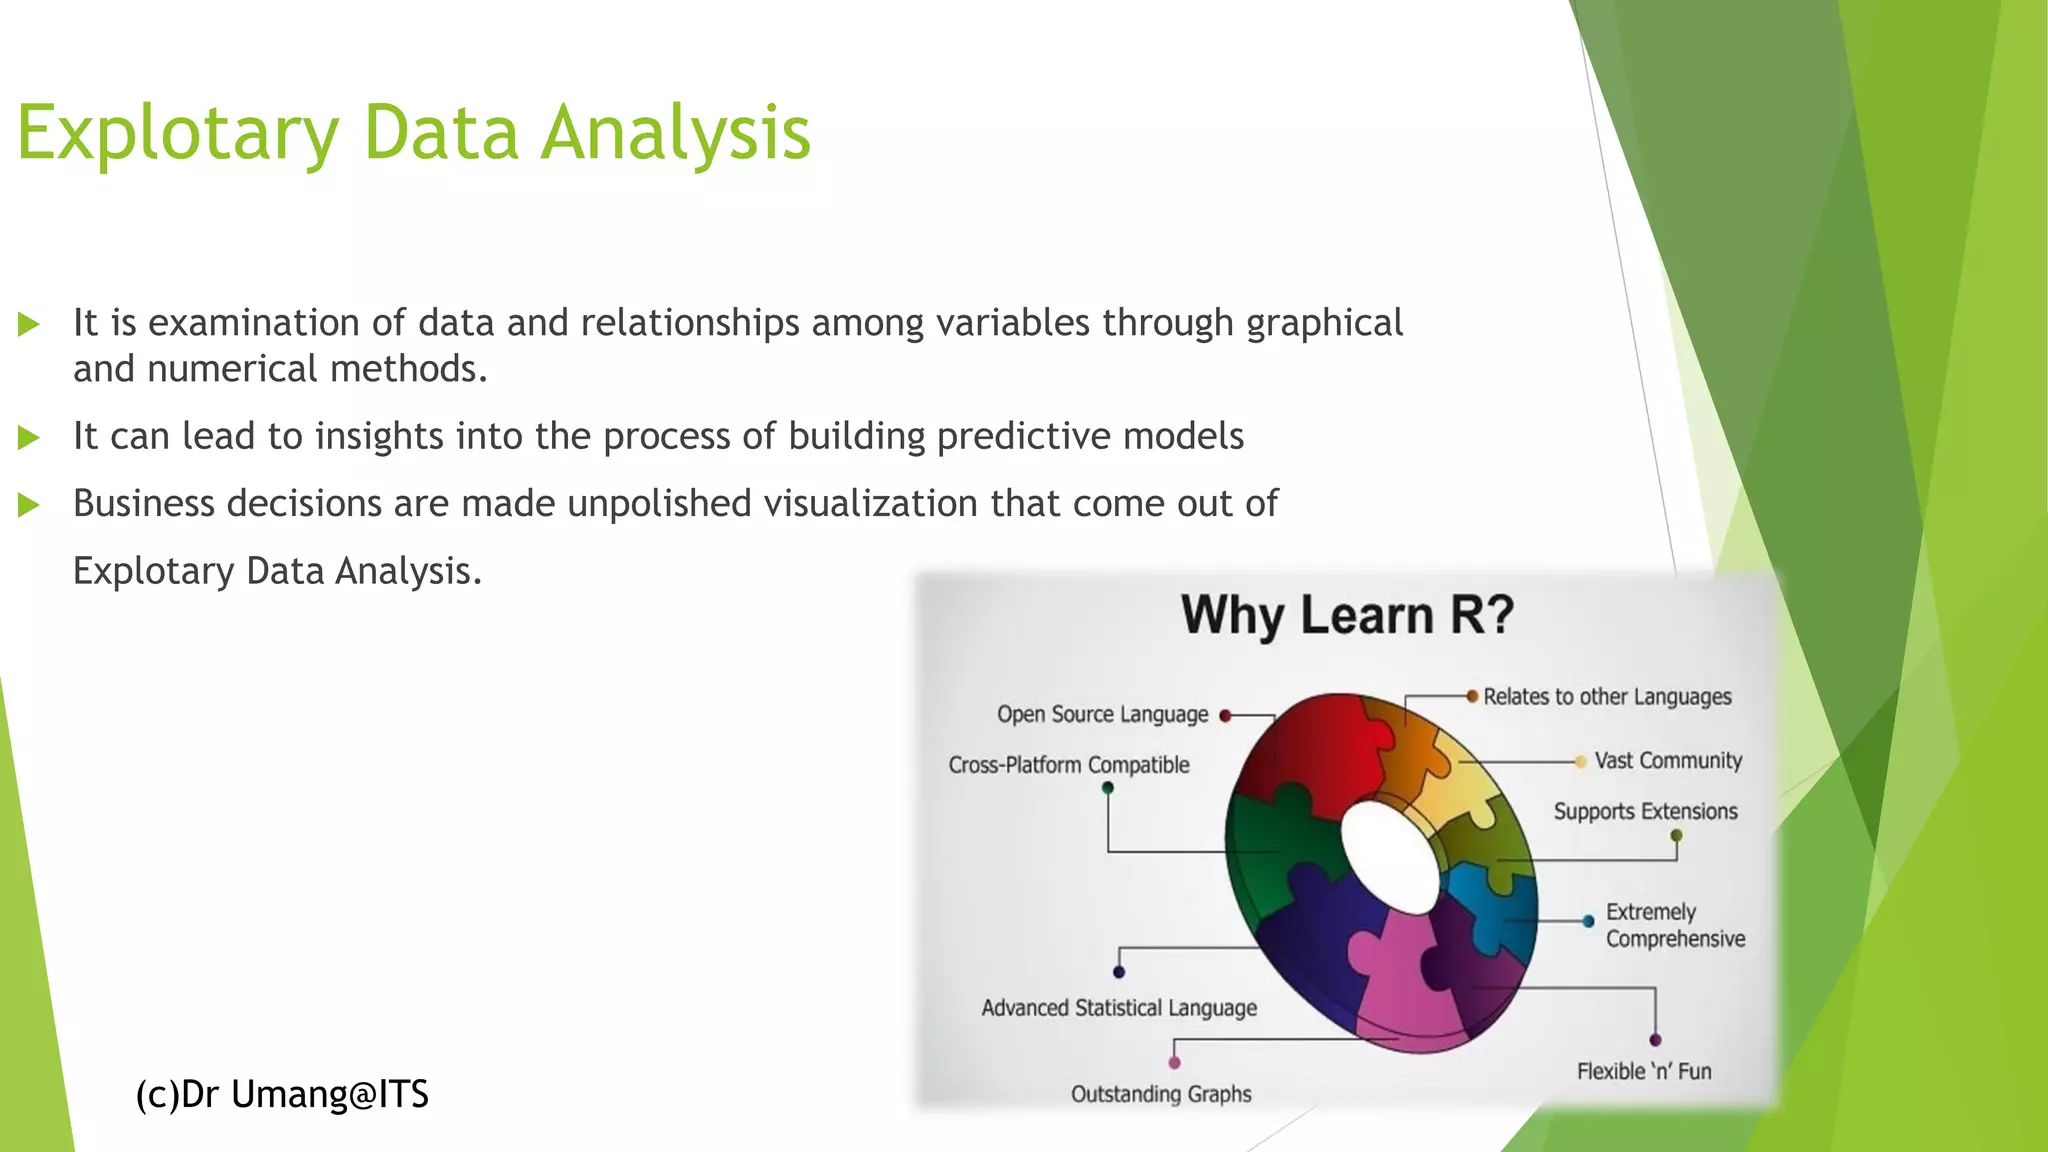
The document provides information about data analytics using R. It discusses how R is a widely used open-source statistical programming language and software environment for data analysis and visualization. It also discusses key concepts in R like importing and transforming data, conducting statistical analysis through functions like mean, median, and plotting graphs. The document further explains important R packages like dplyr for data manipulation and clustering algorithms for analyzing hidden patterns in data. Finally, it mentions some example projects and applications of R in areas like psychology, business, and machine learning.

![(c)Dr Umang@ITS Files Associated with R ➢ *.r - An R script. ➢ *.rmd - An R Markdown file. It is saved in format that enables creation of dynamic presentation, reports and documents. ➢ *.rnw - An R Sweave file. ➢ *.rds - A file containing a [single] R object; can be created using saveRDS(), and loaded using readRDS(). ➢ *.rdata - A file containing one or more R objects or workspaces; can be created using save(), and loaded using load(). SUMMARY R Reference Card](https://image.slidesharecdn.com/dataanalyticsusingrprogramming-200518110004/75/Data-analytics-using-R-programming-17-2048.jpg)
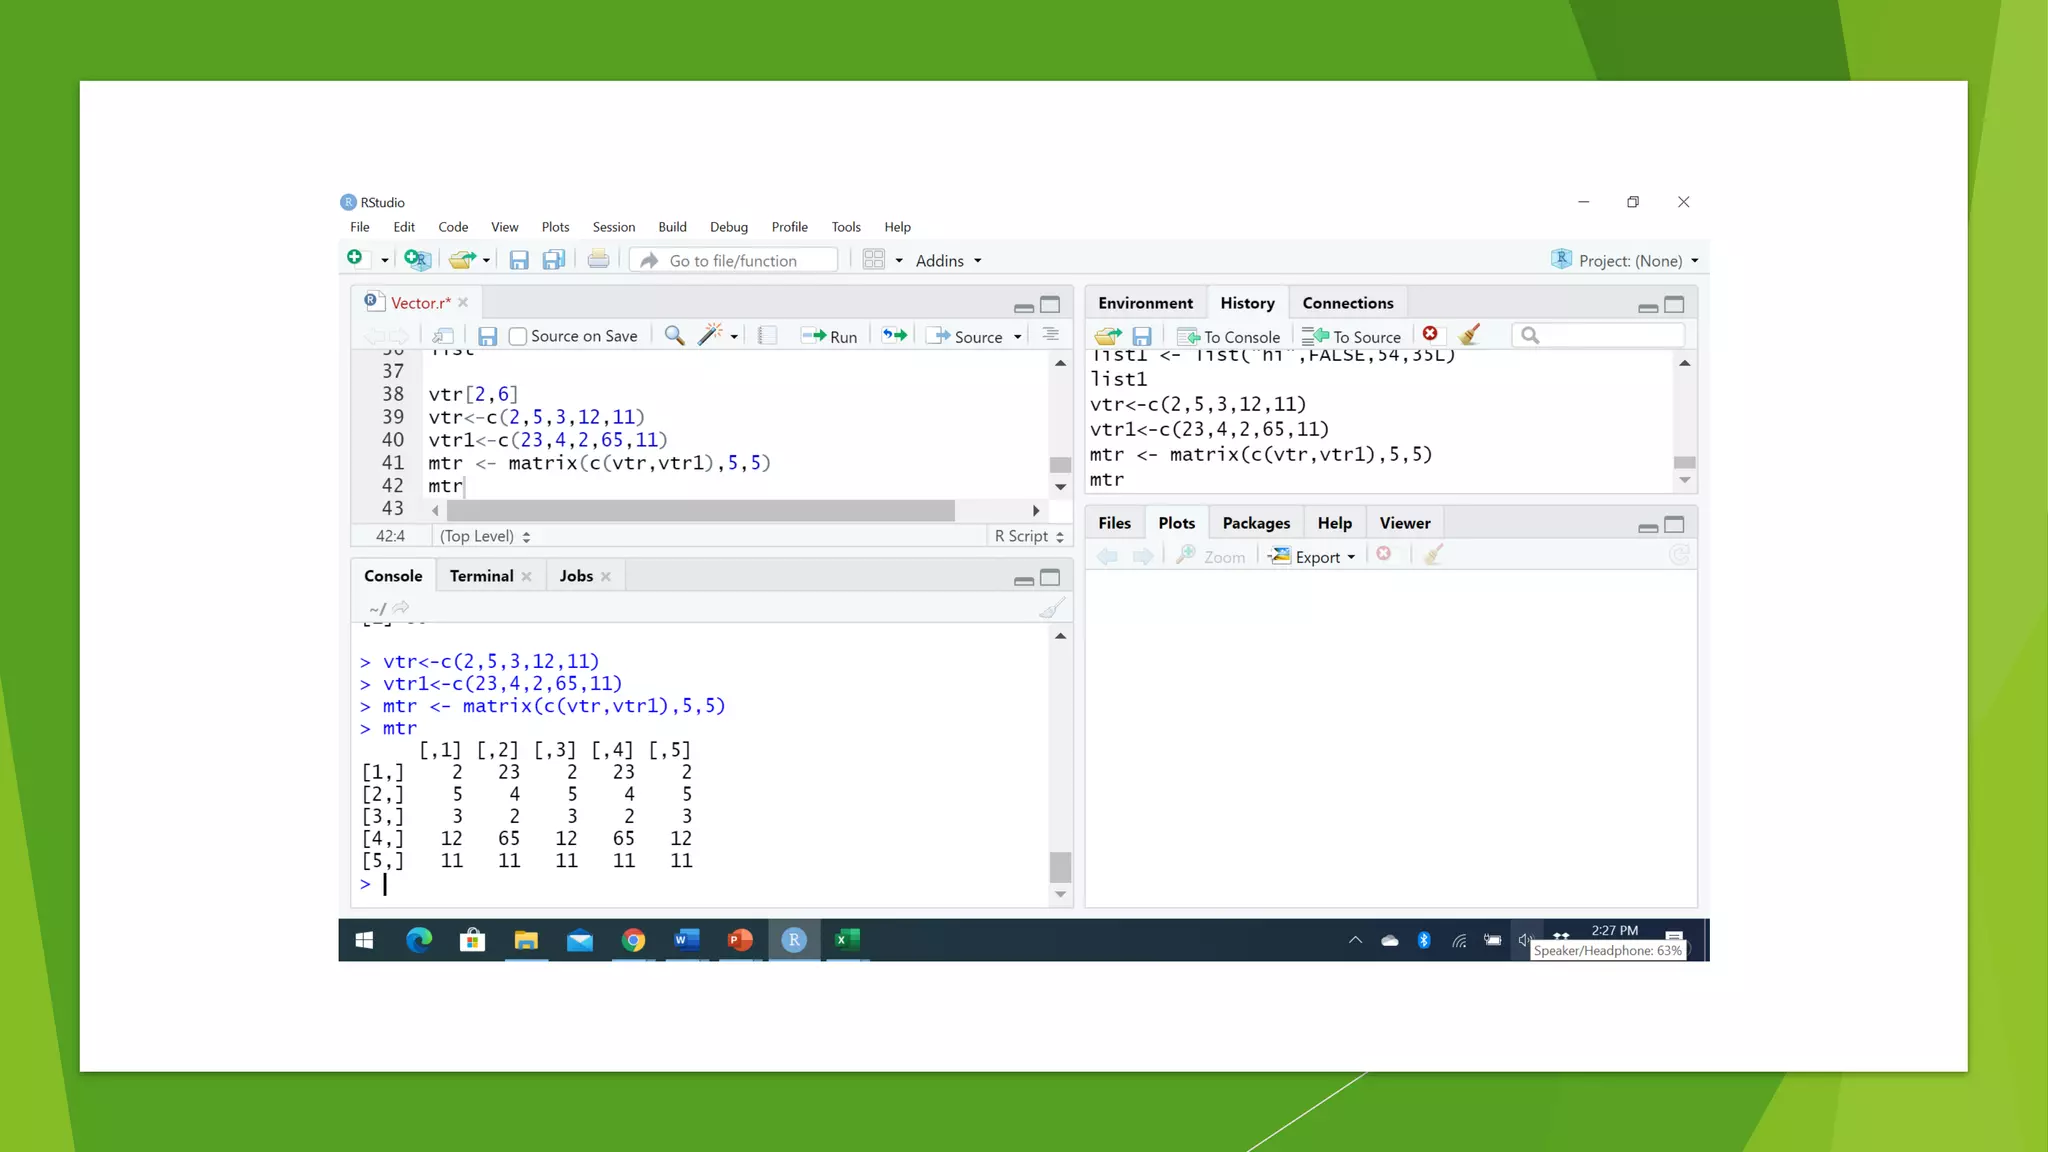
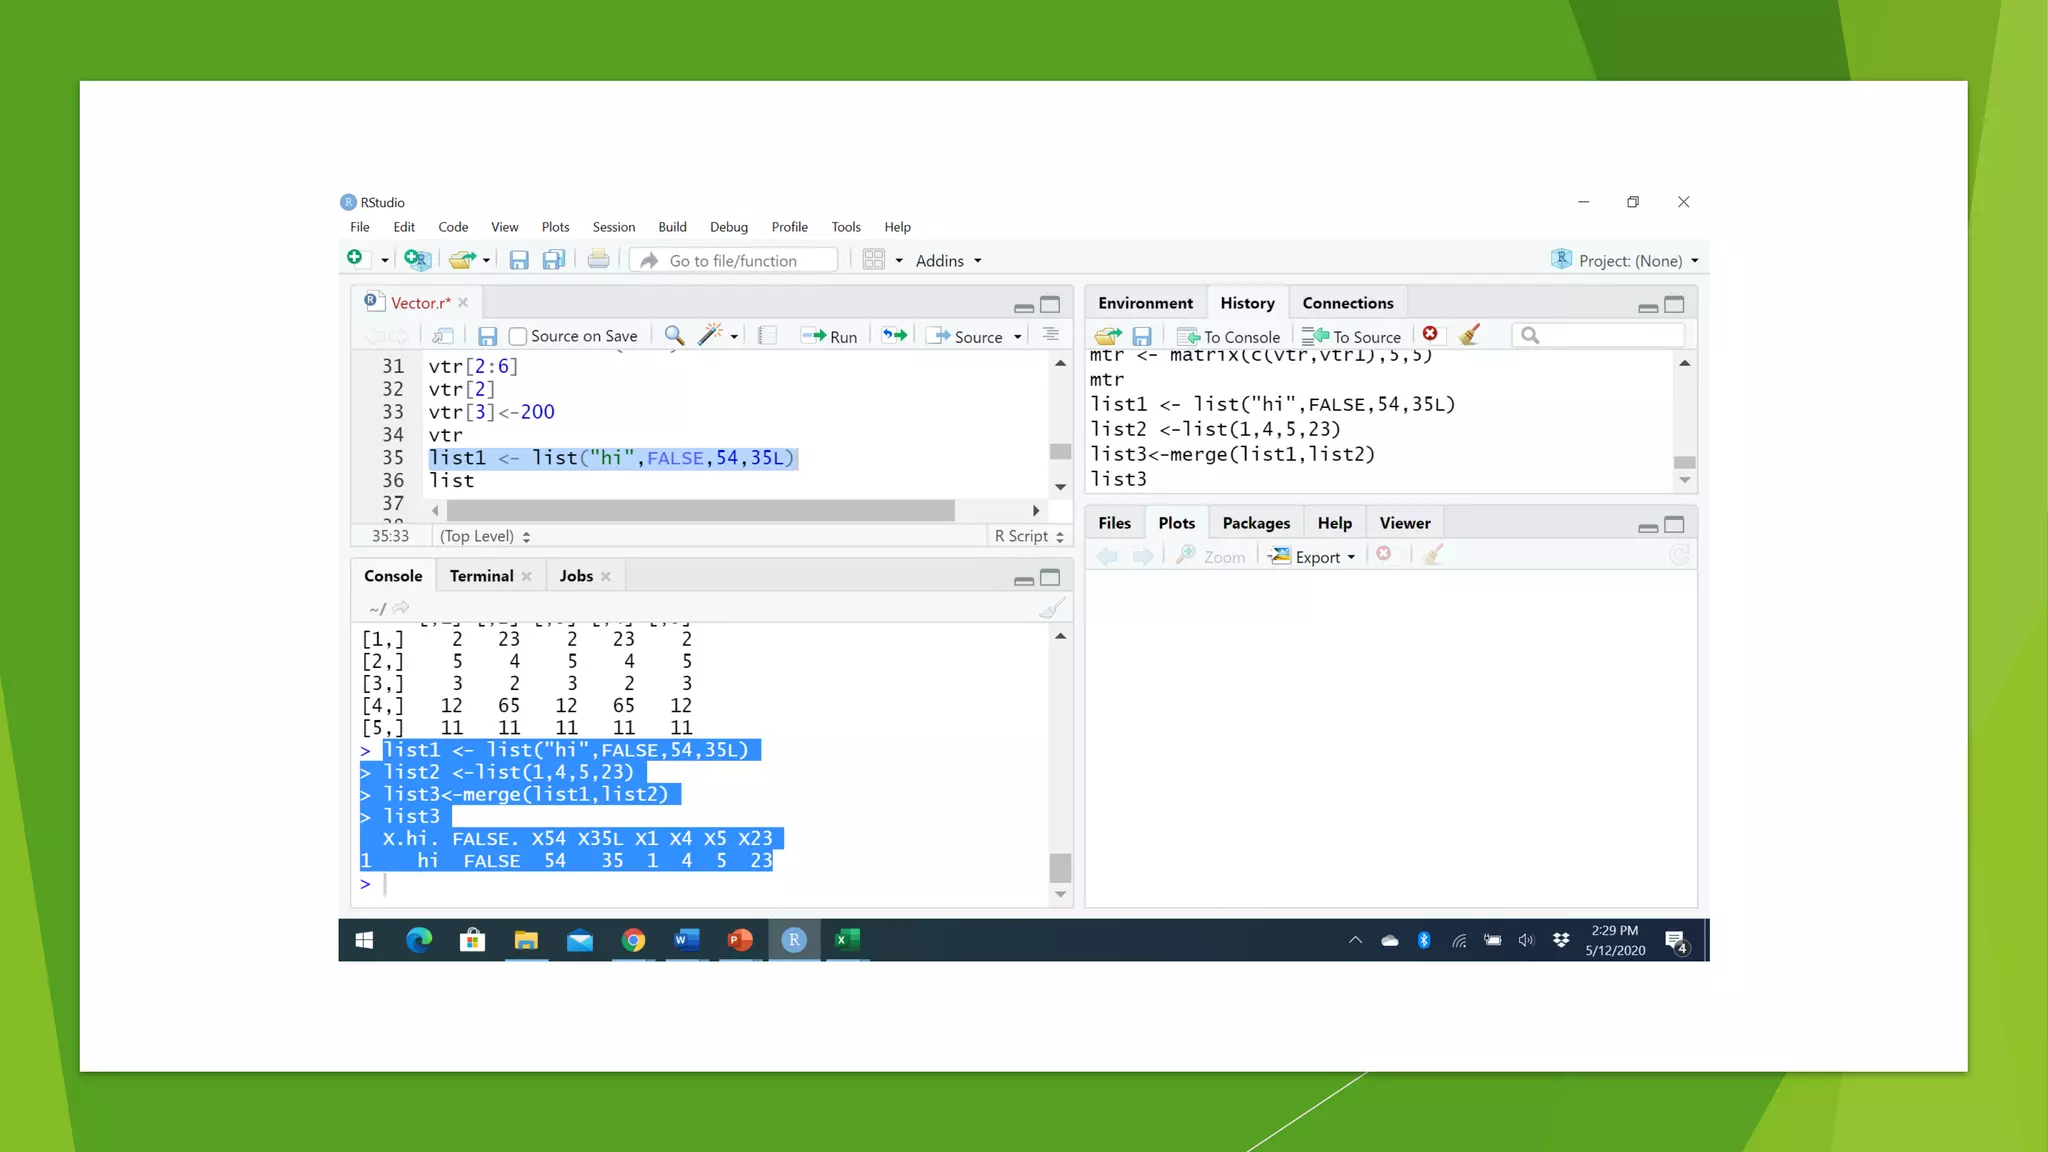
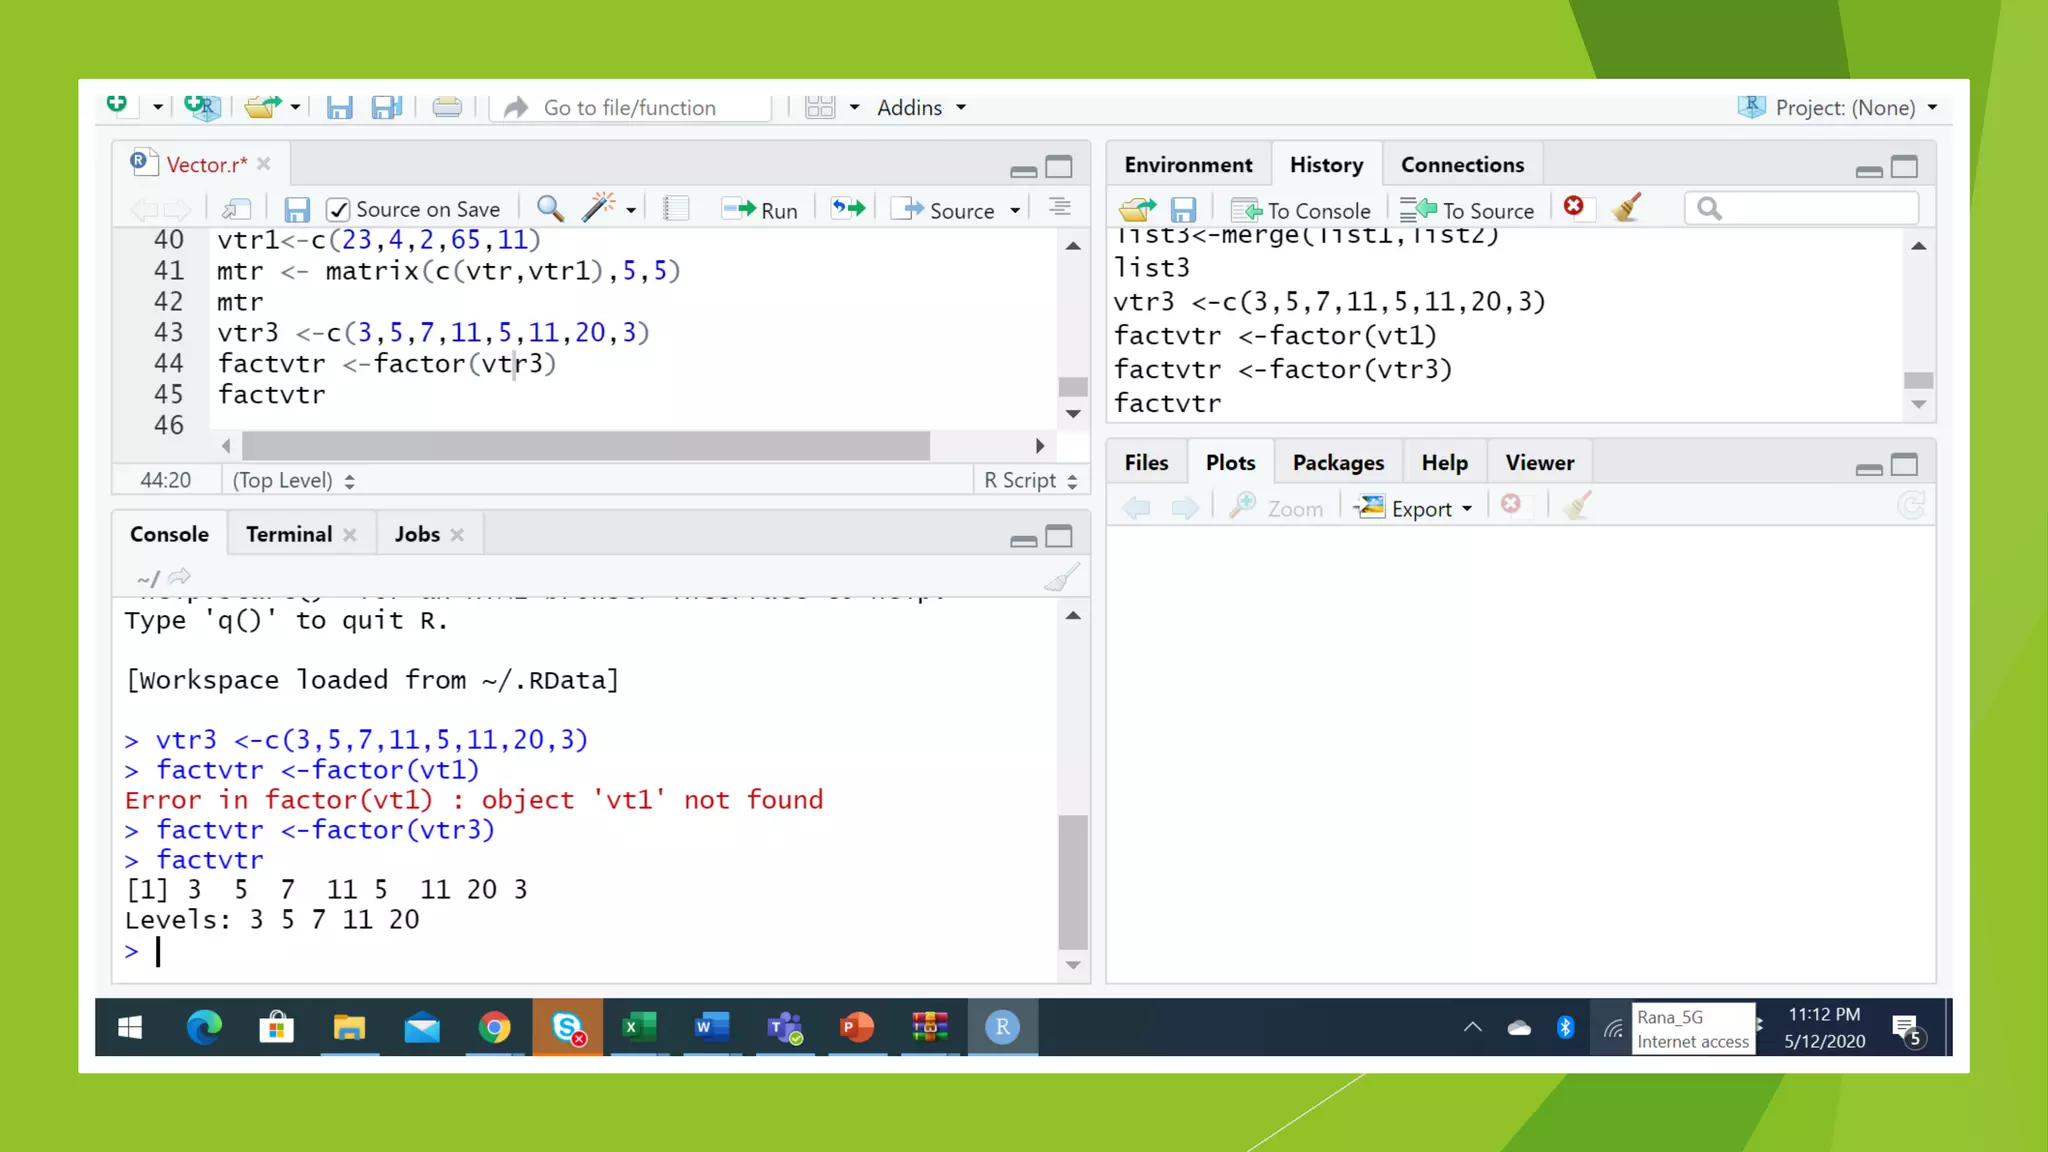
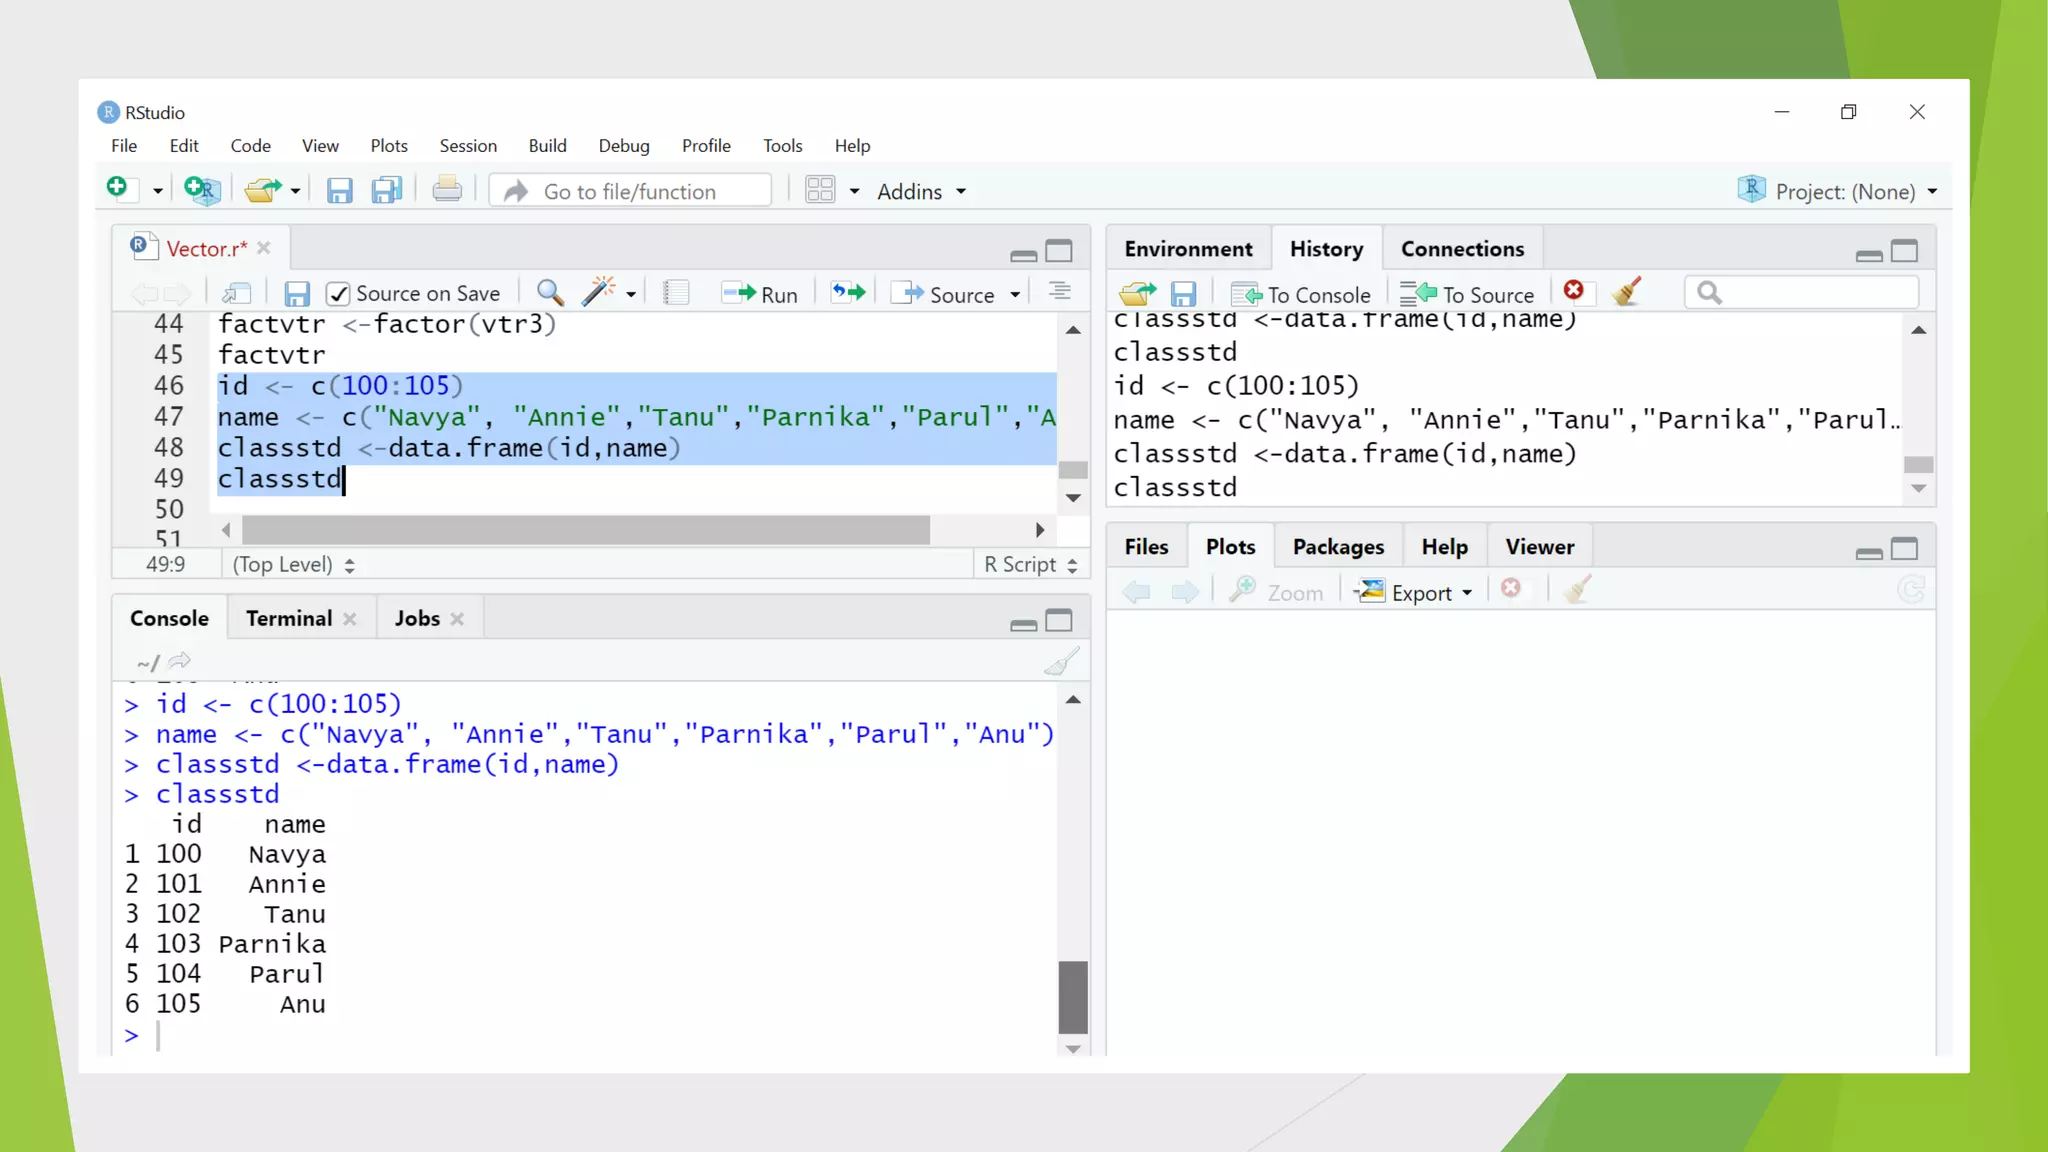
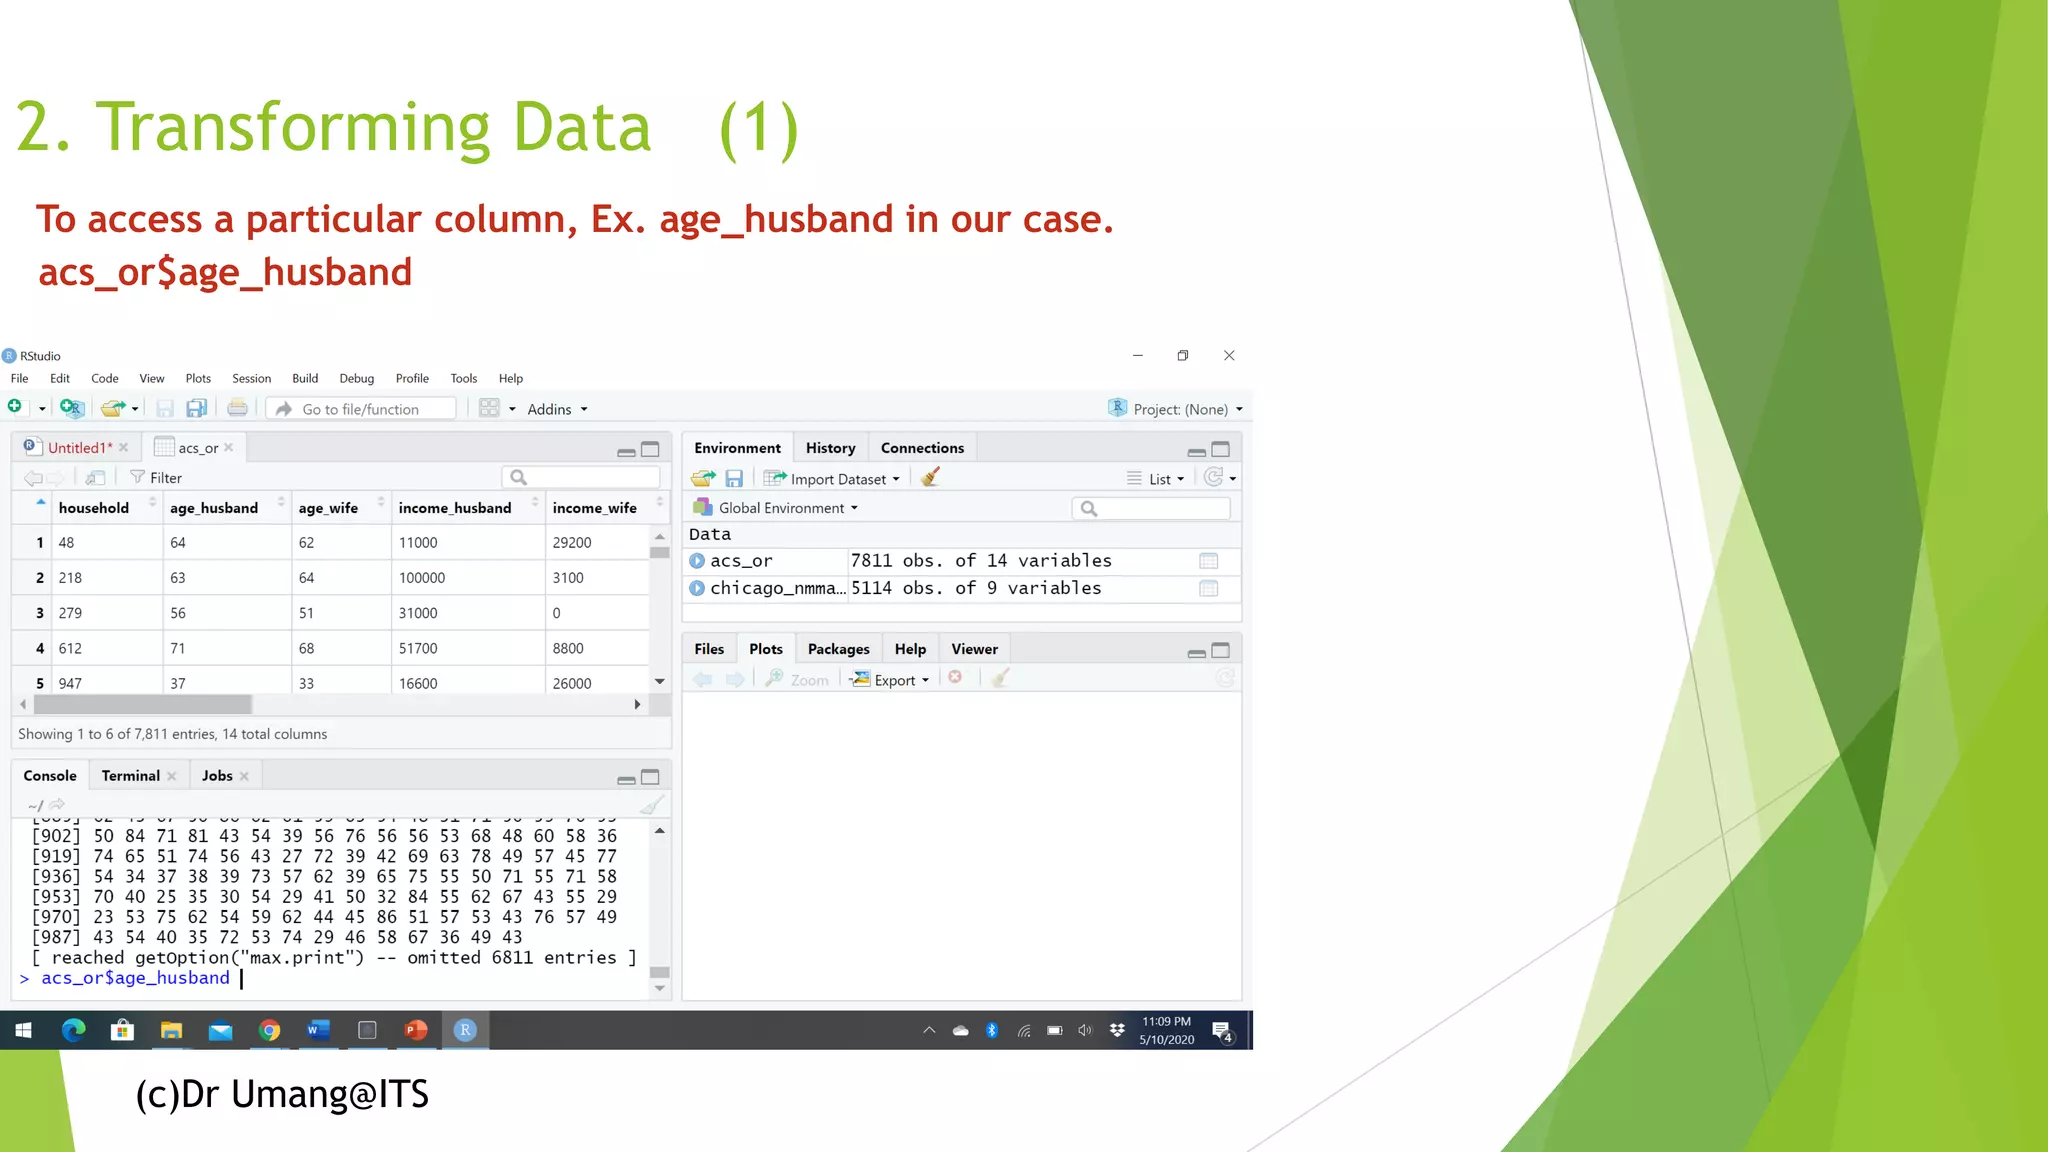
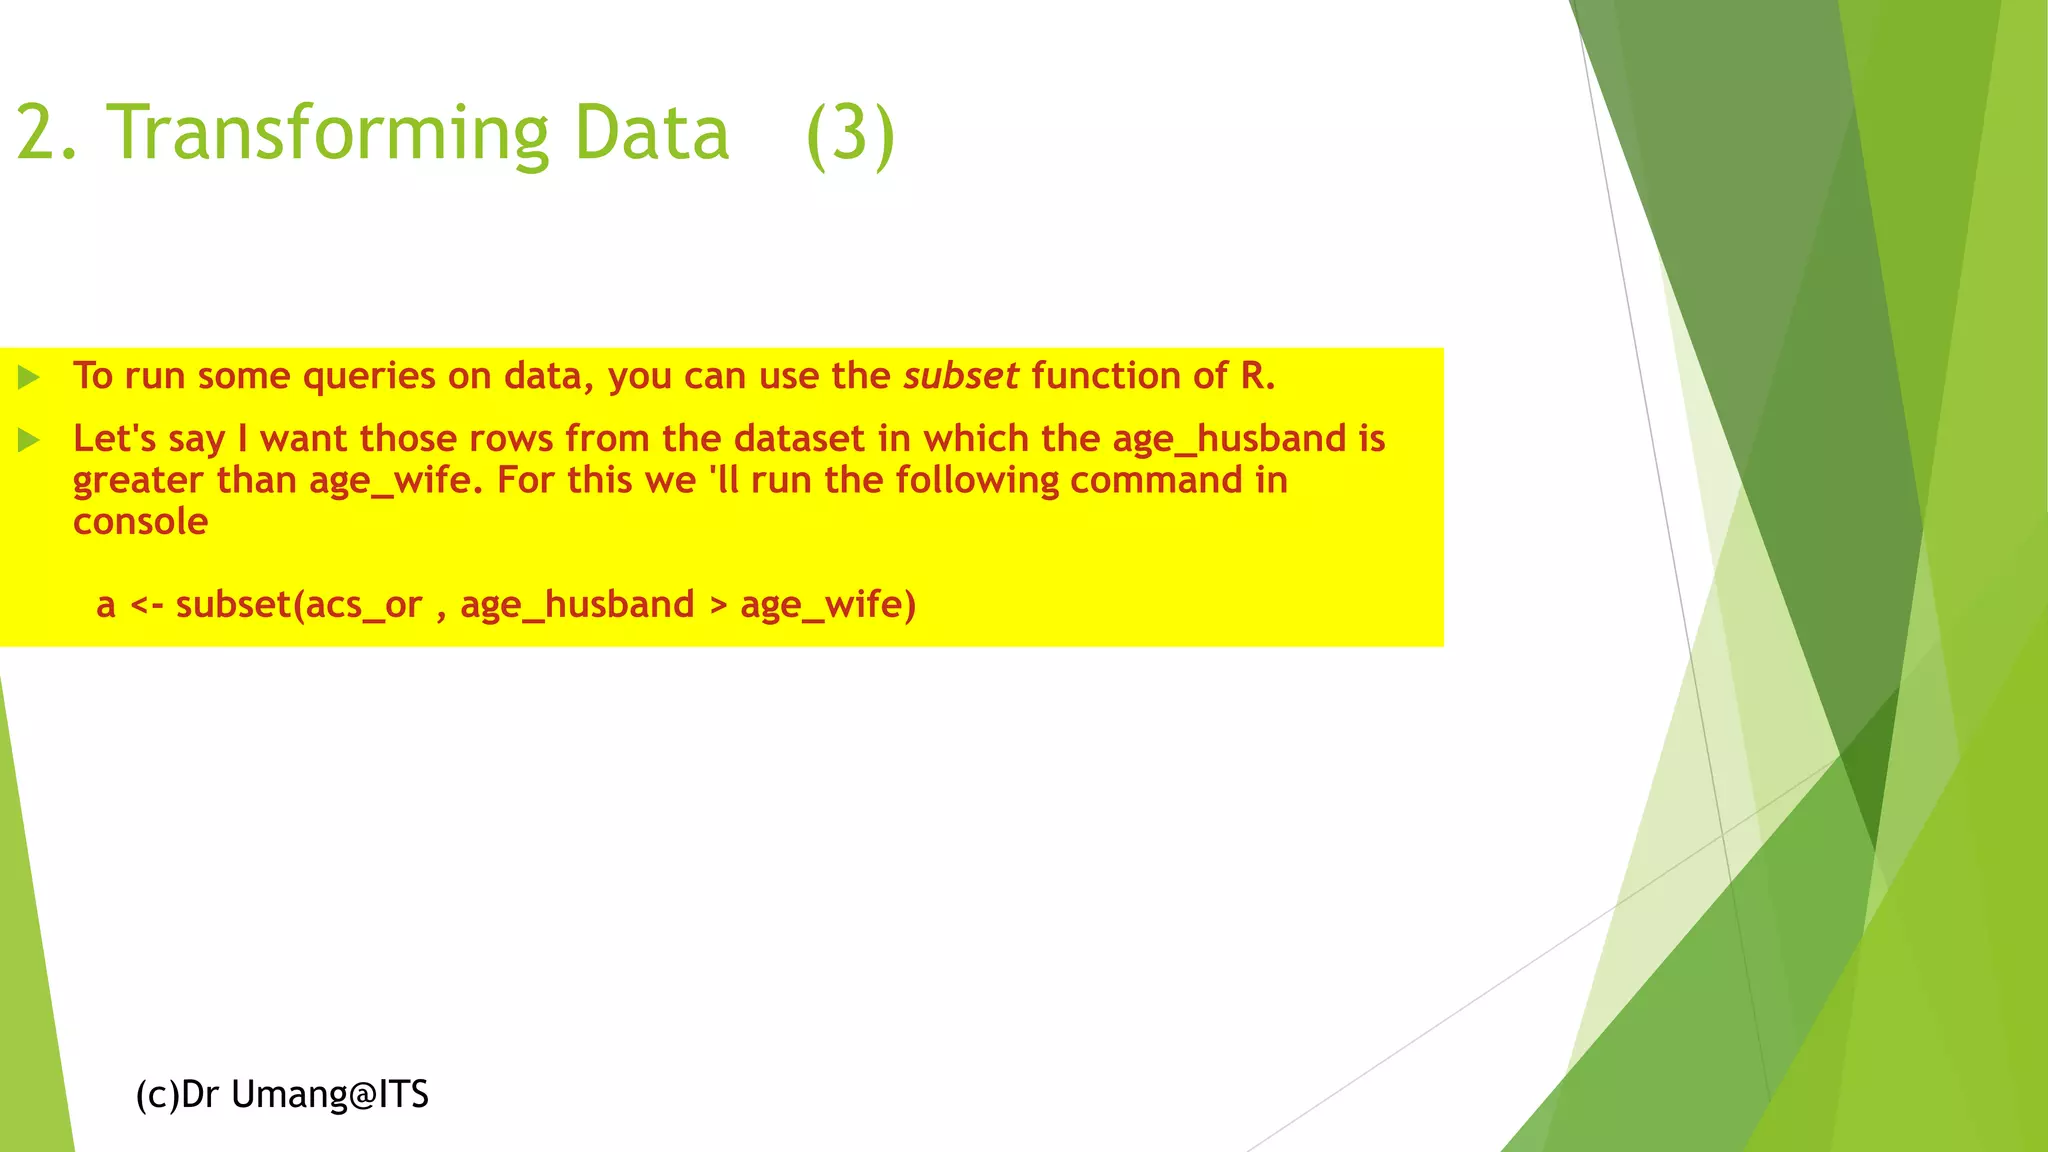
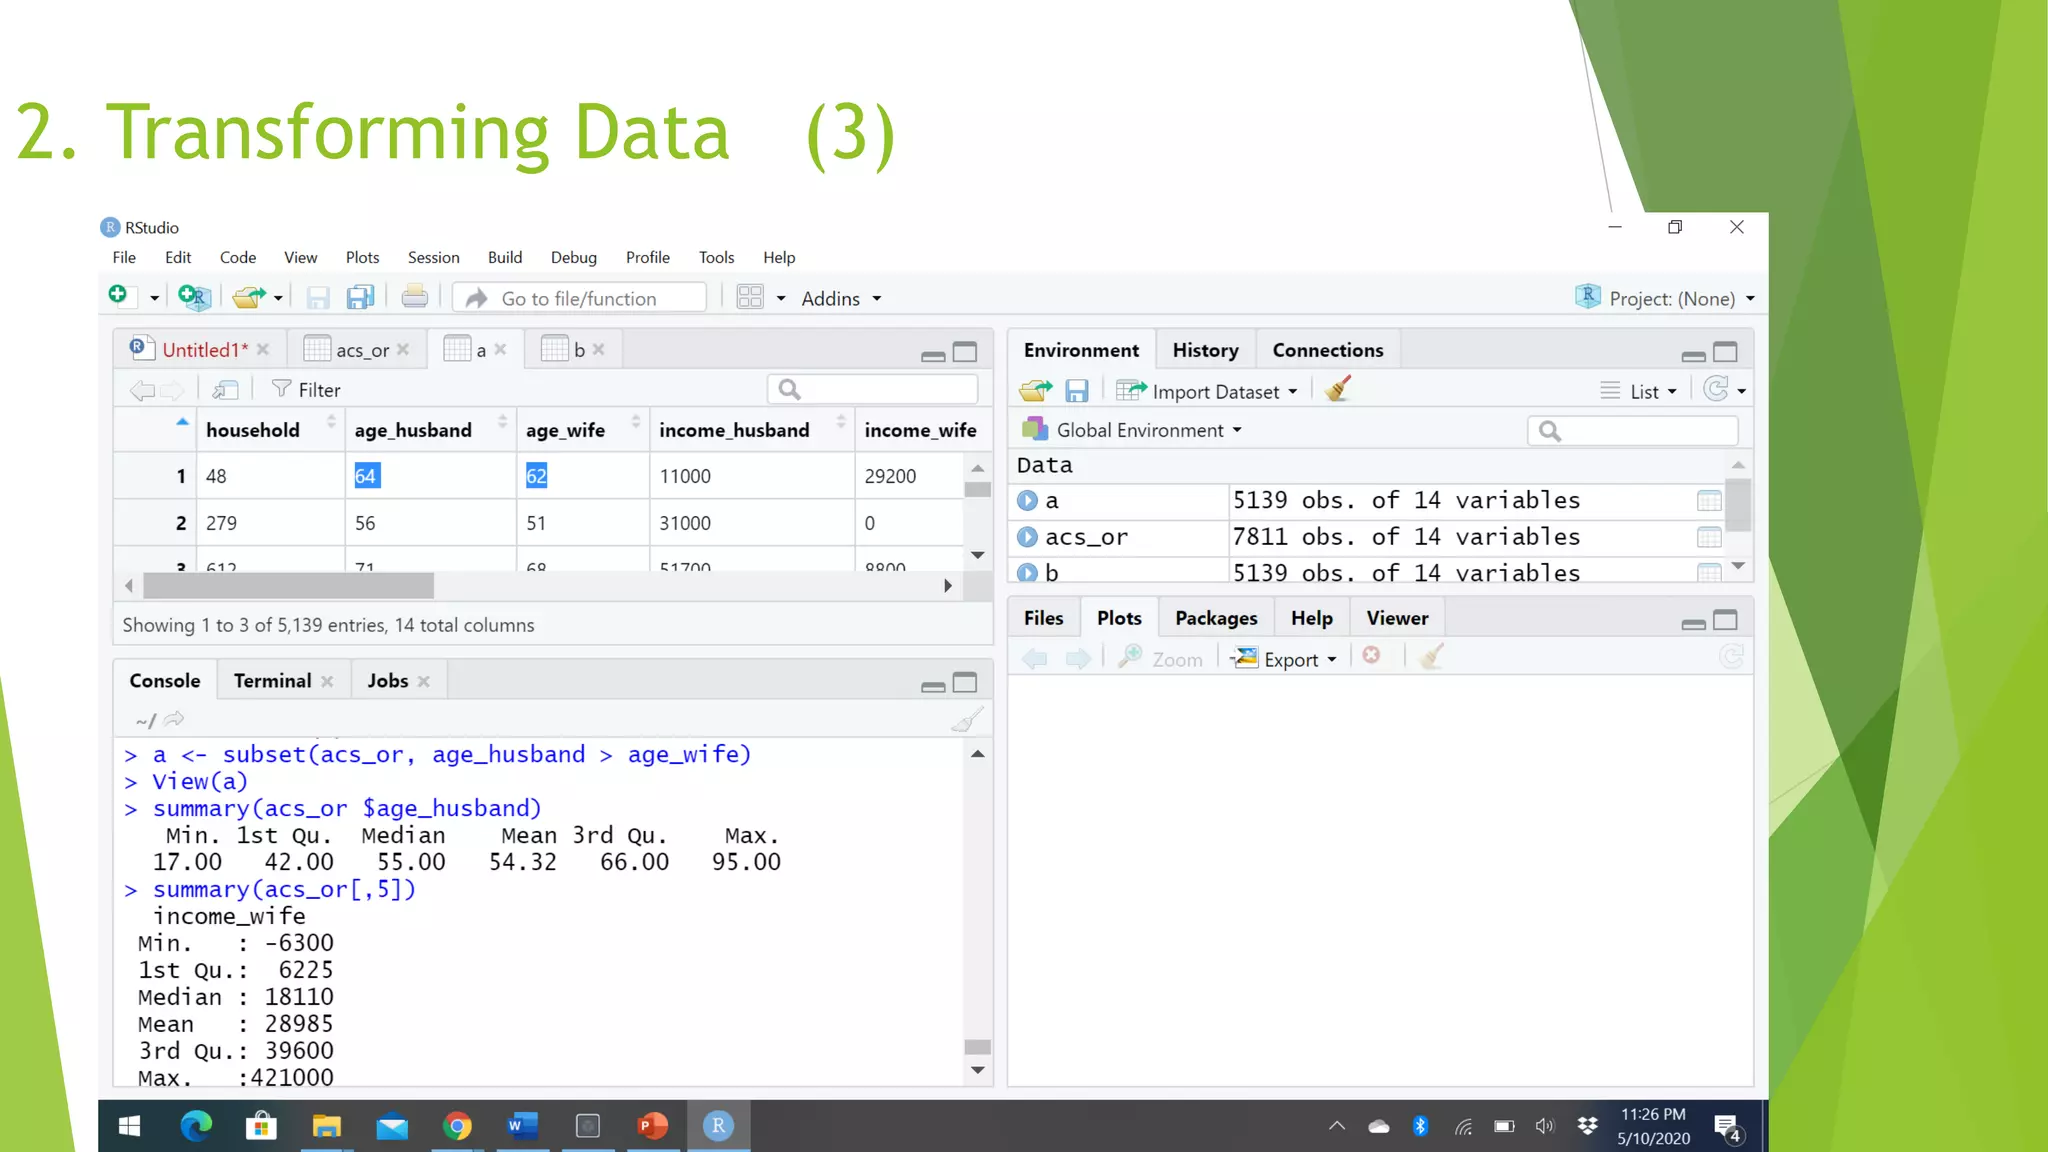
![(c)Dr Umang@ITS 2. Transforming Data (2) To access data as a vector acs_or[1,3]](https://image.slidesharecdn.com/dataanalyticsusingrprogramming-200518110004/75/Data-analytics-using-R-programming-49-2048.jpg)