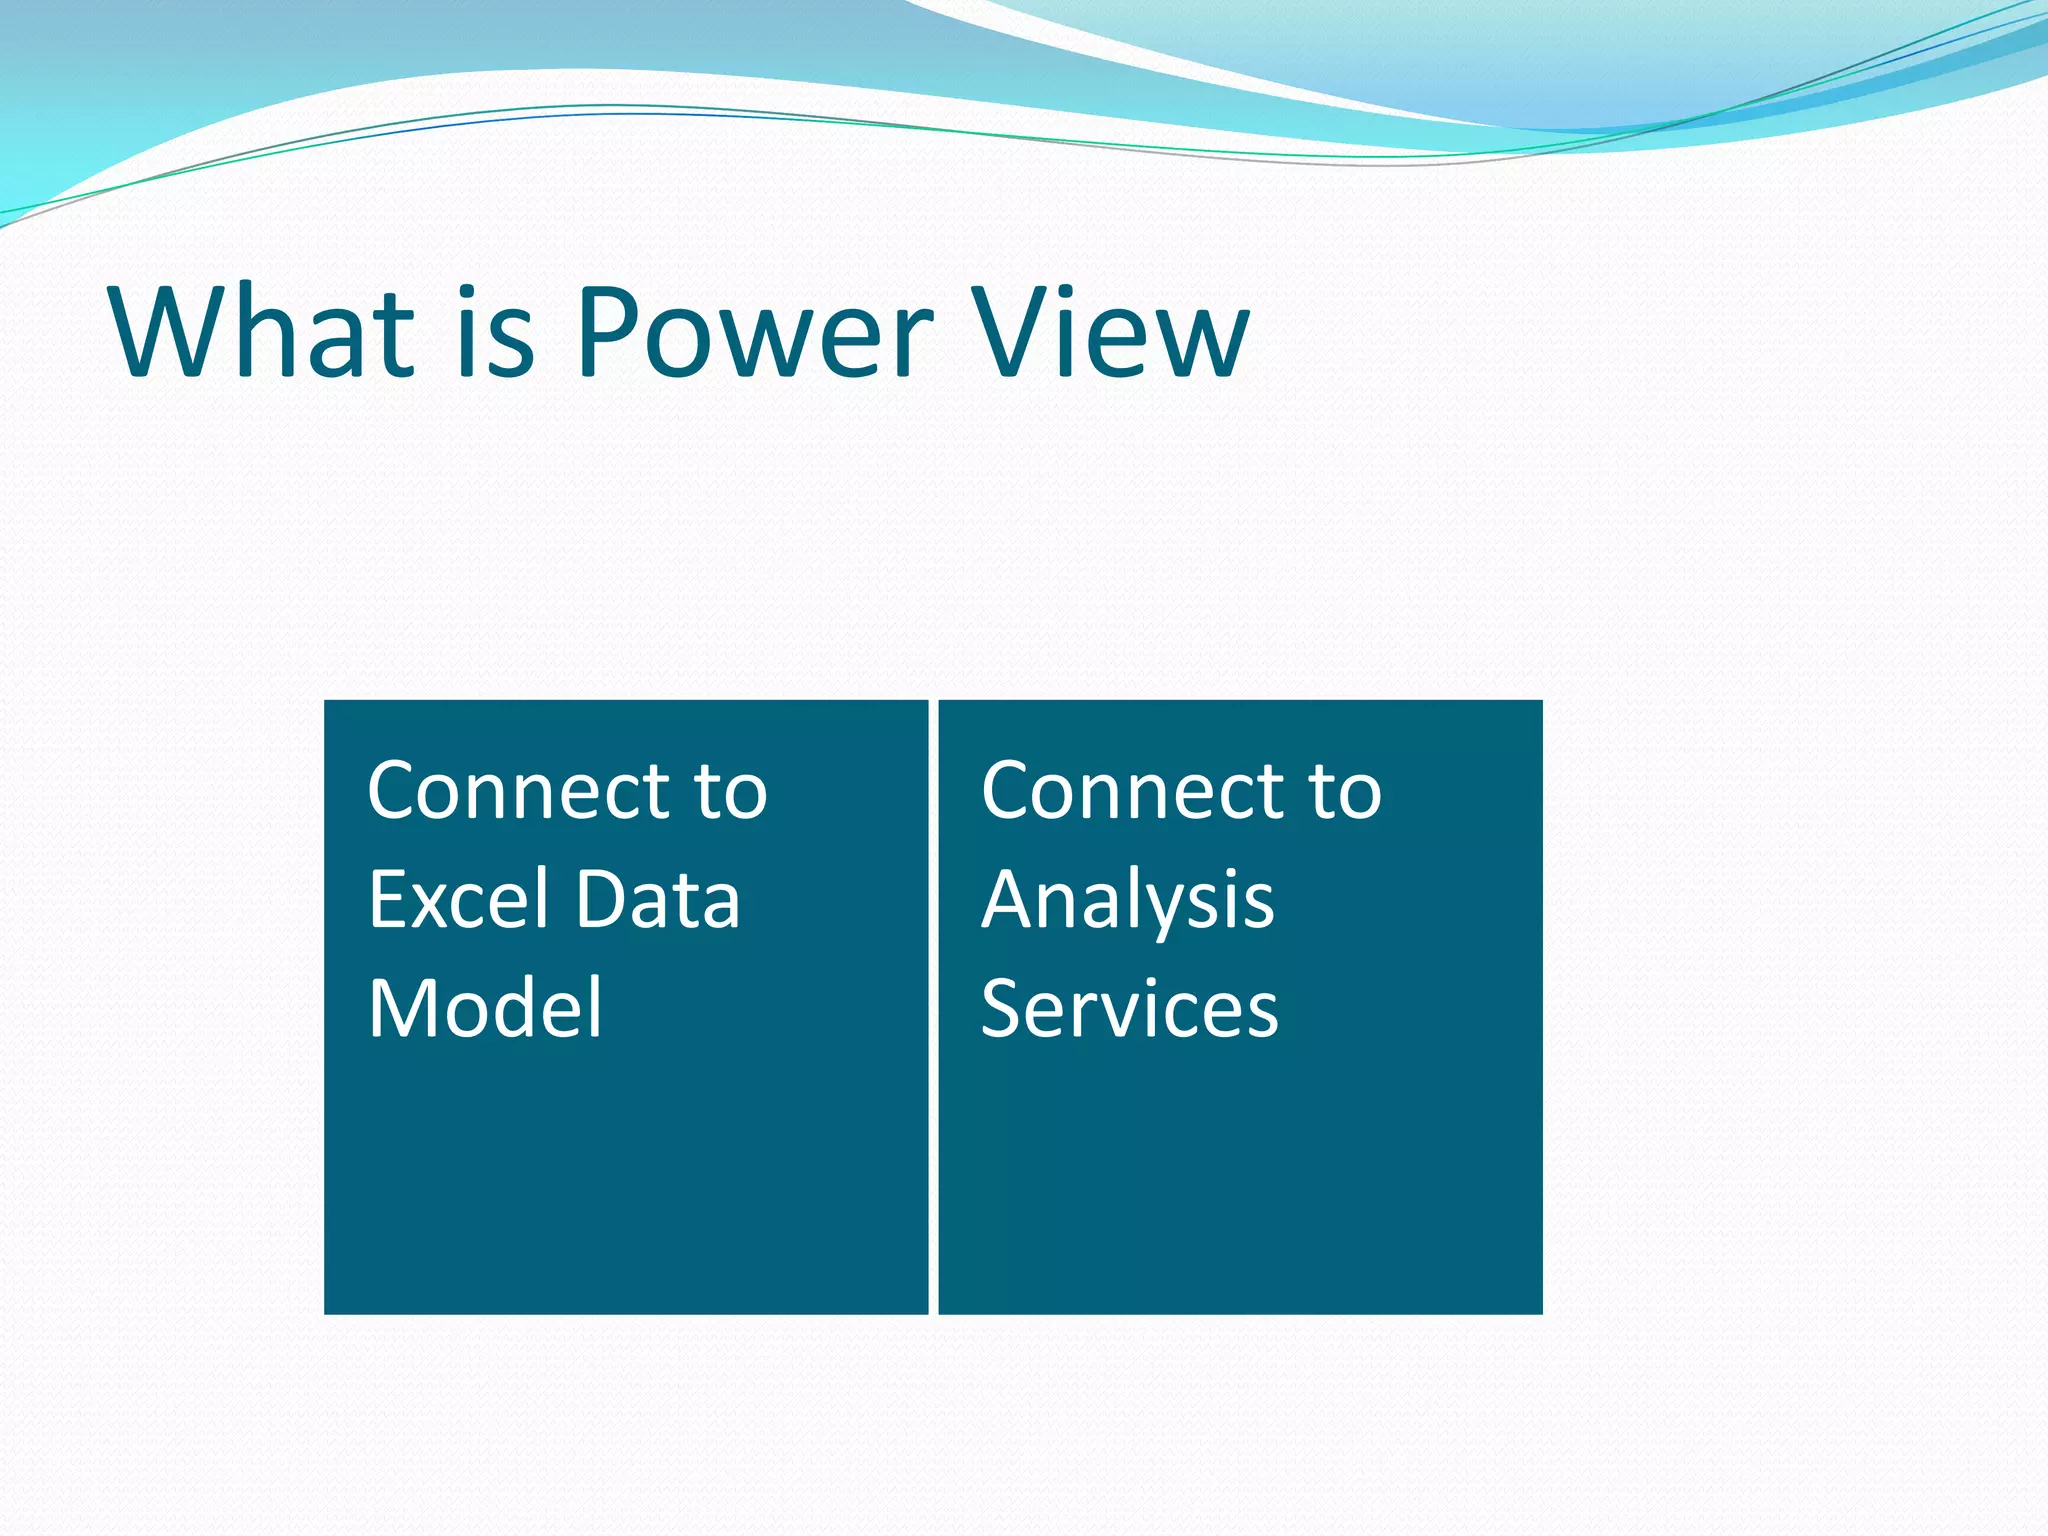
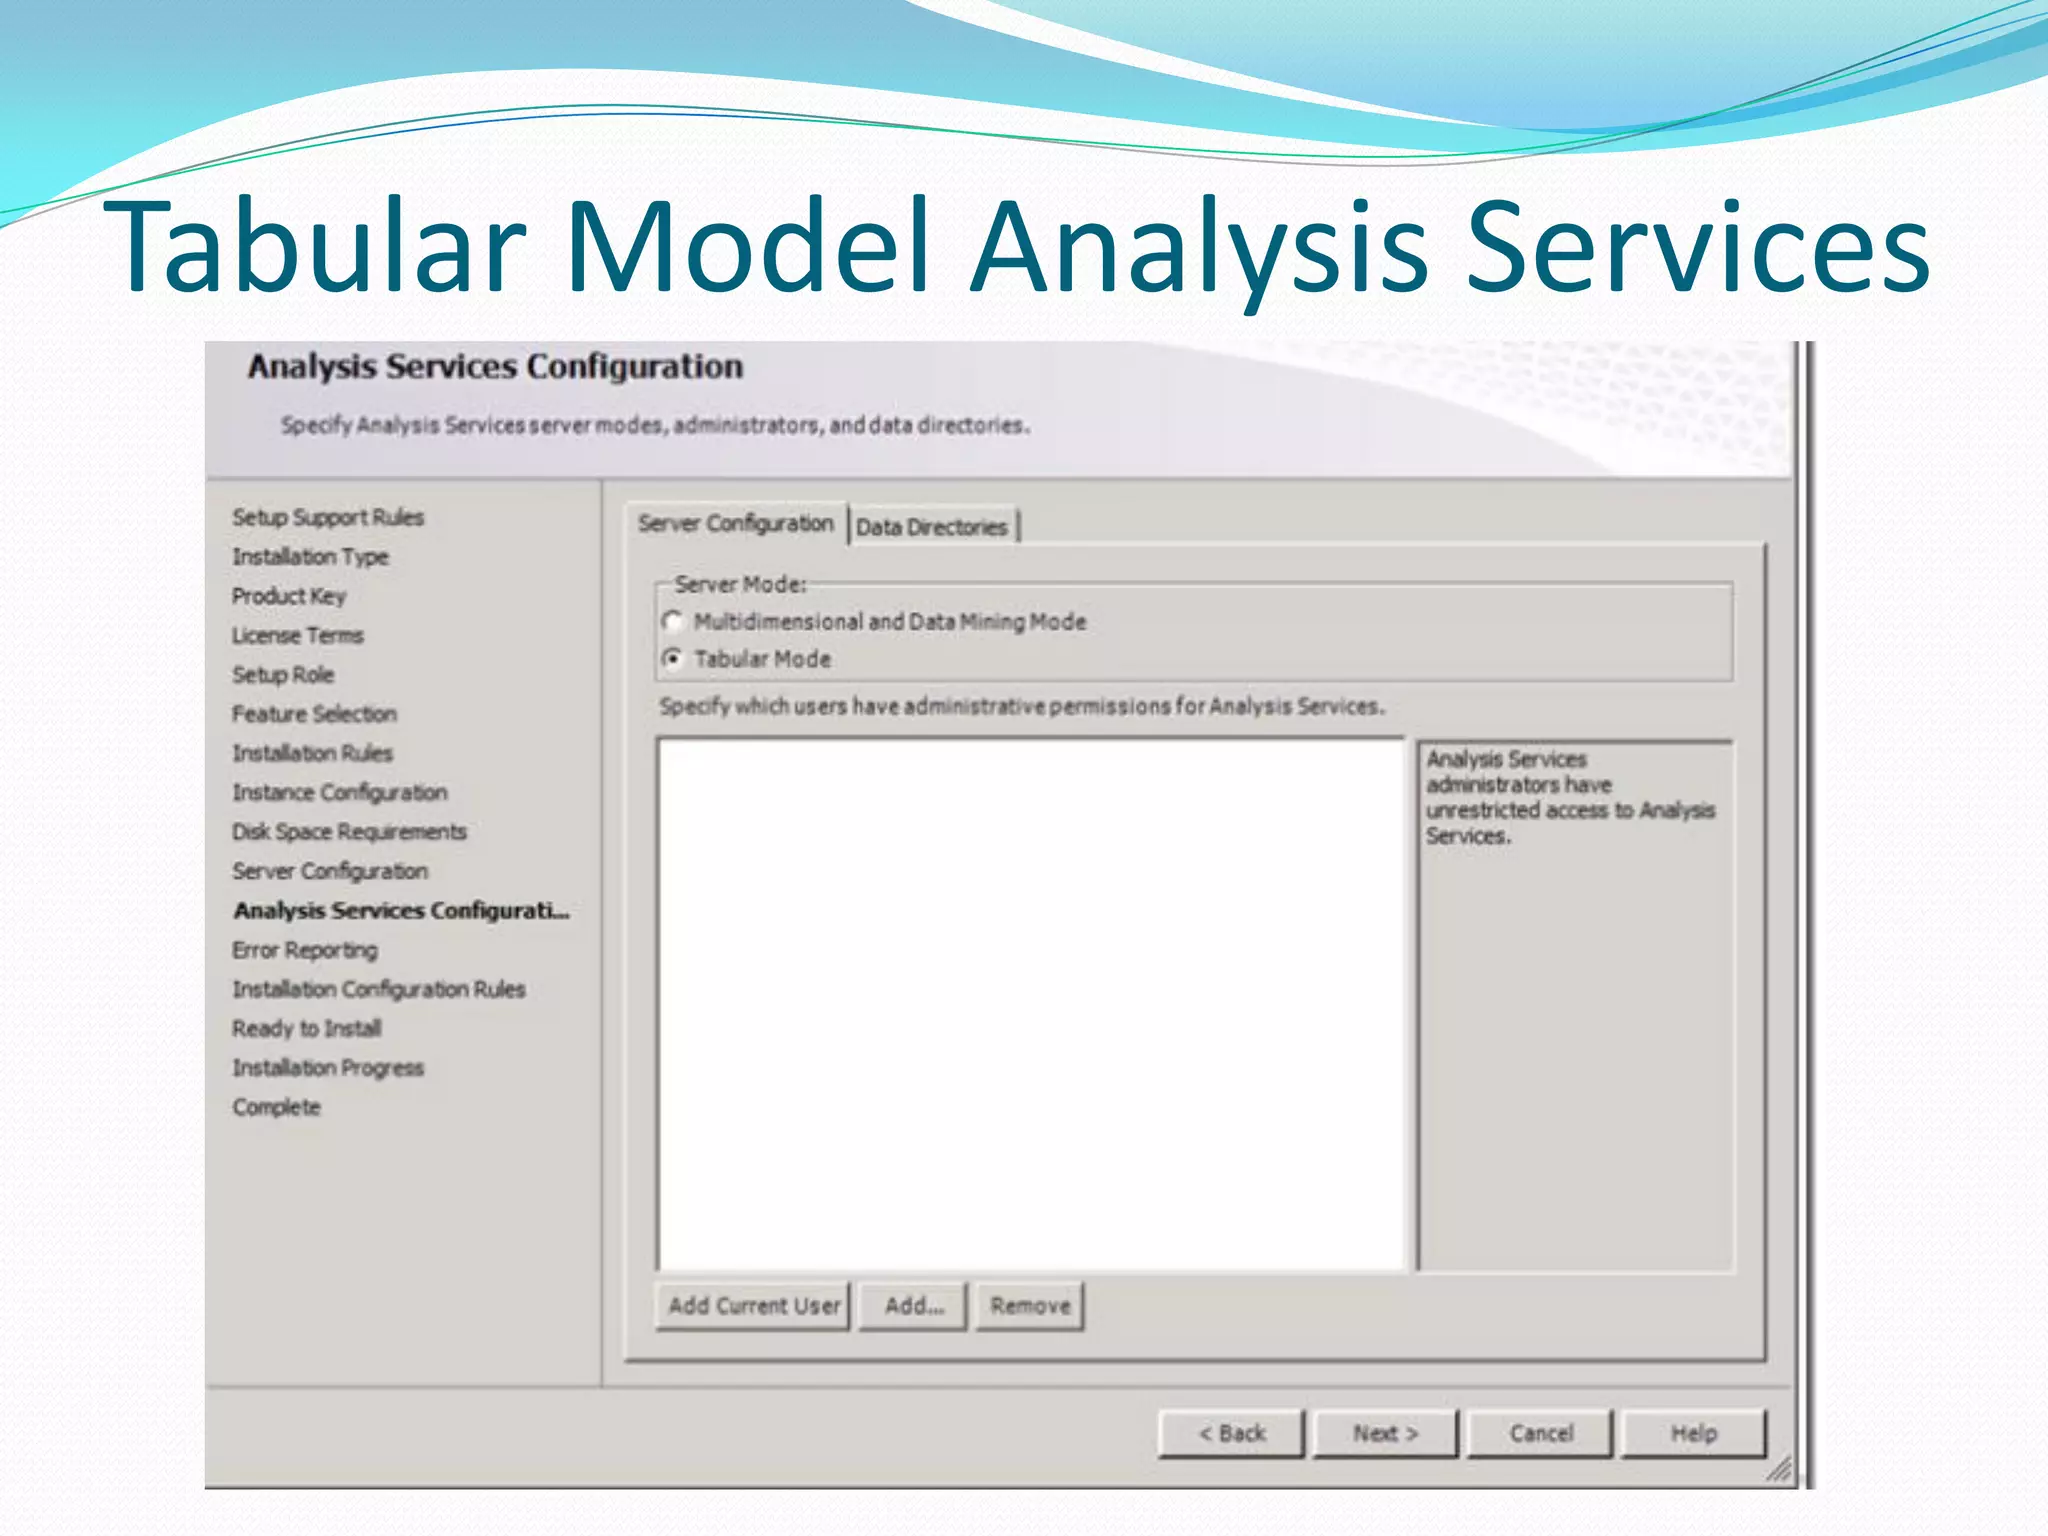
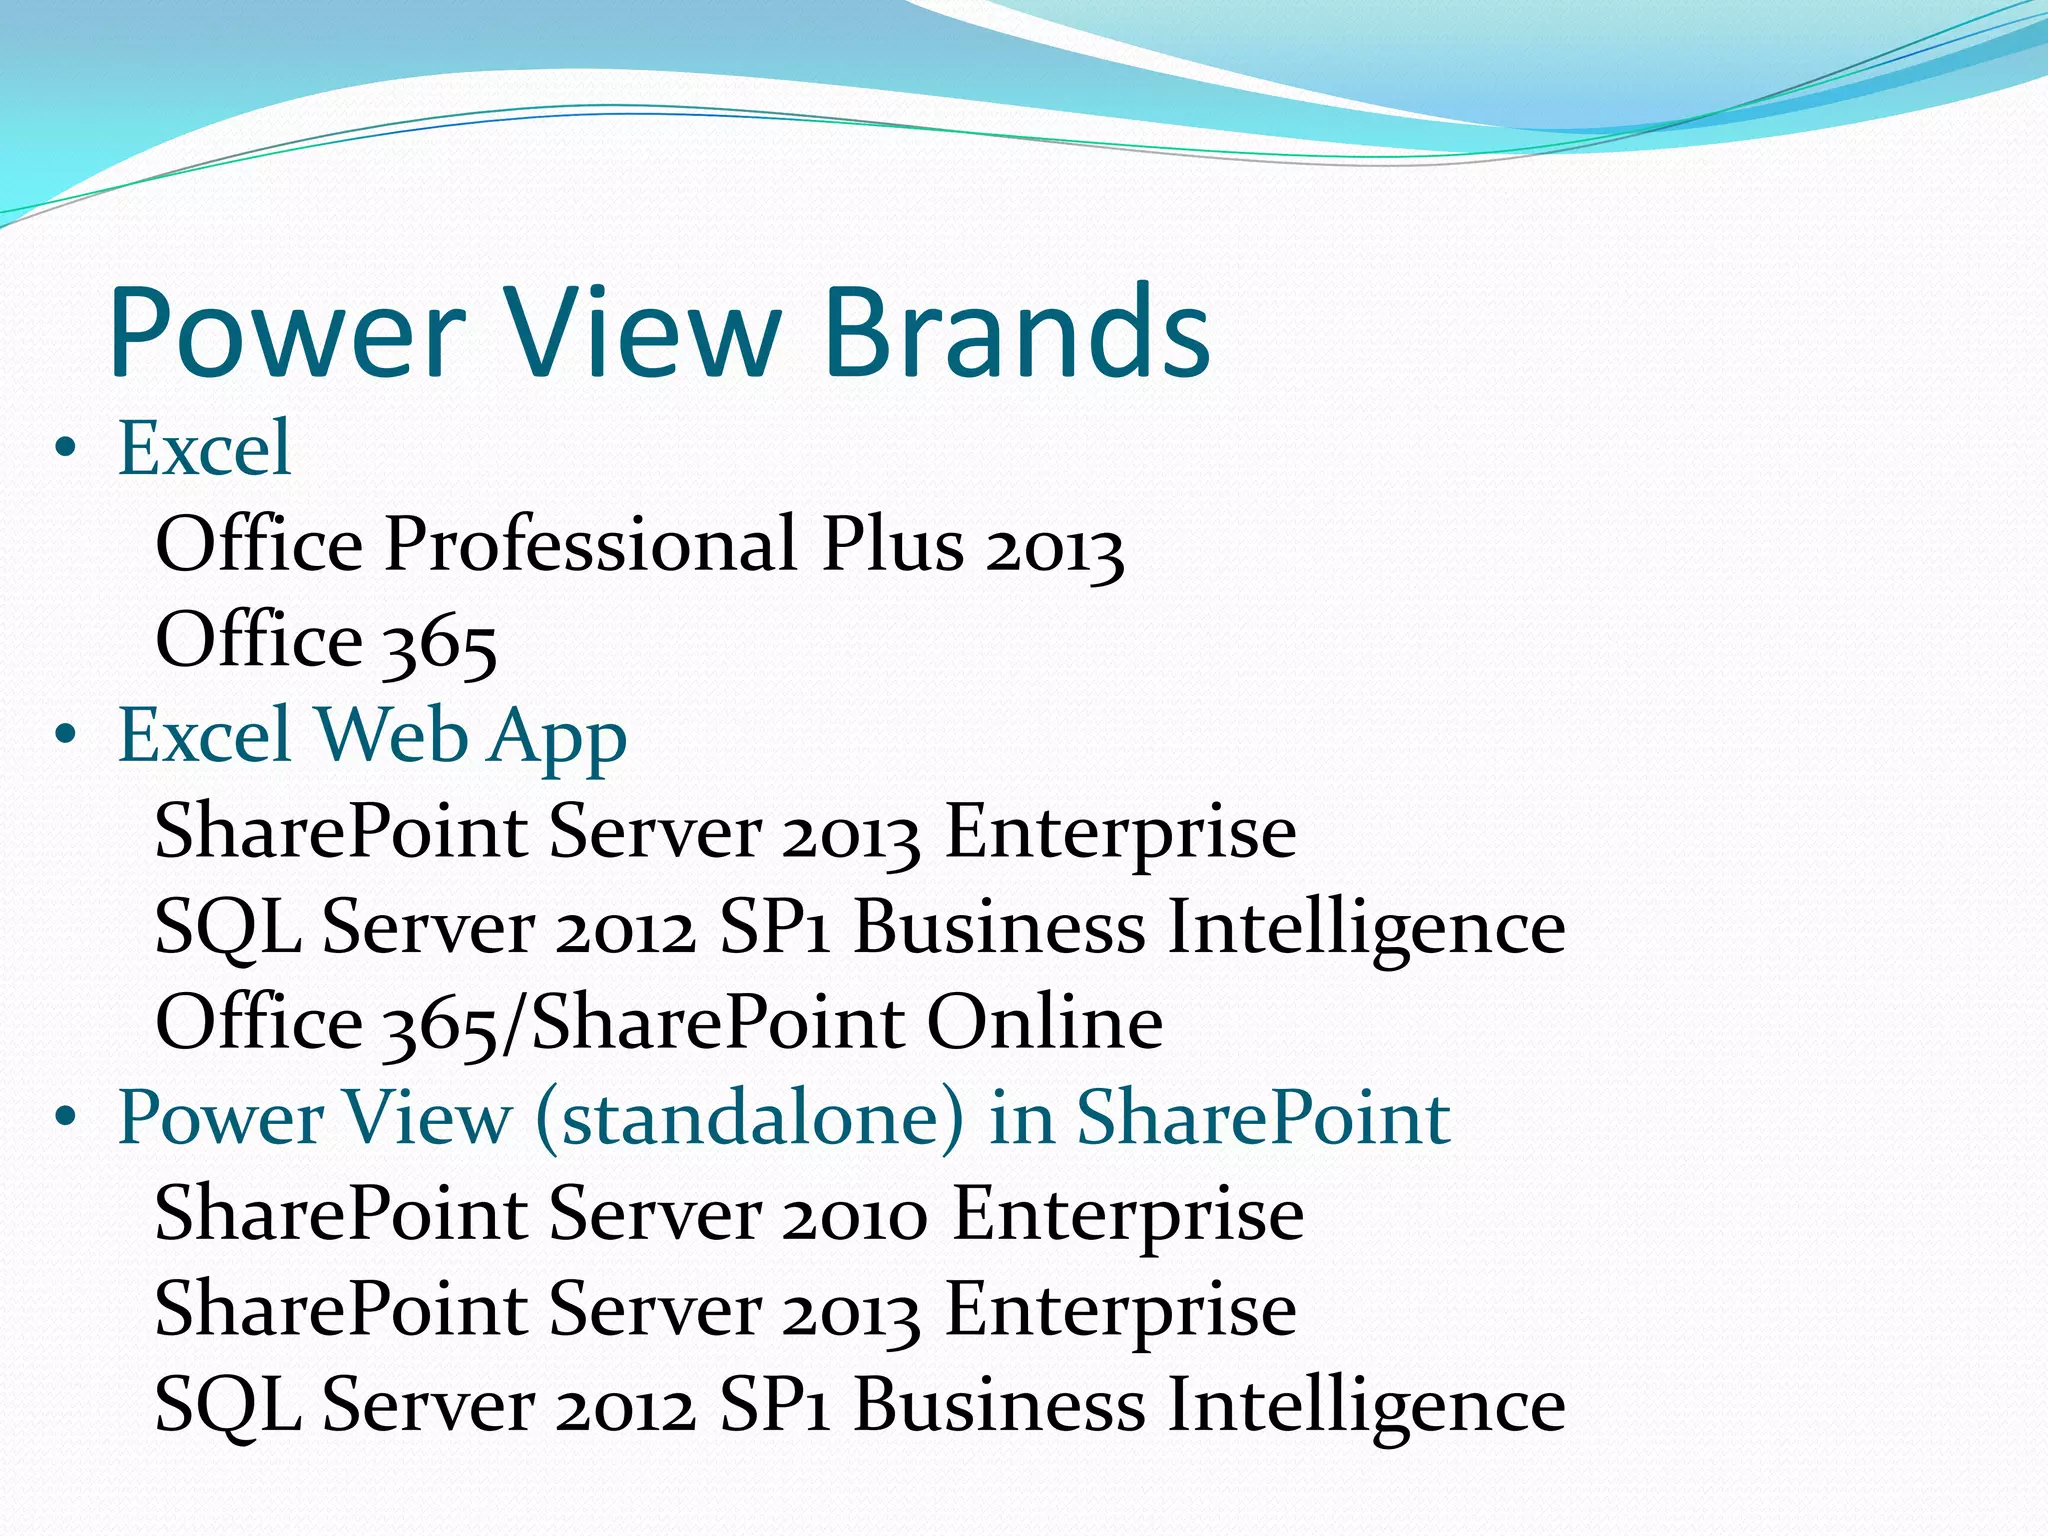
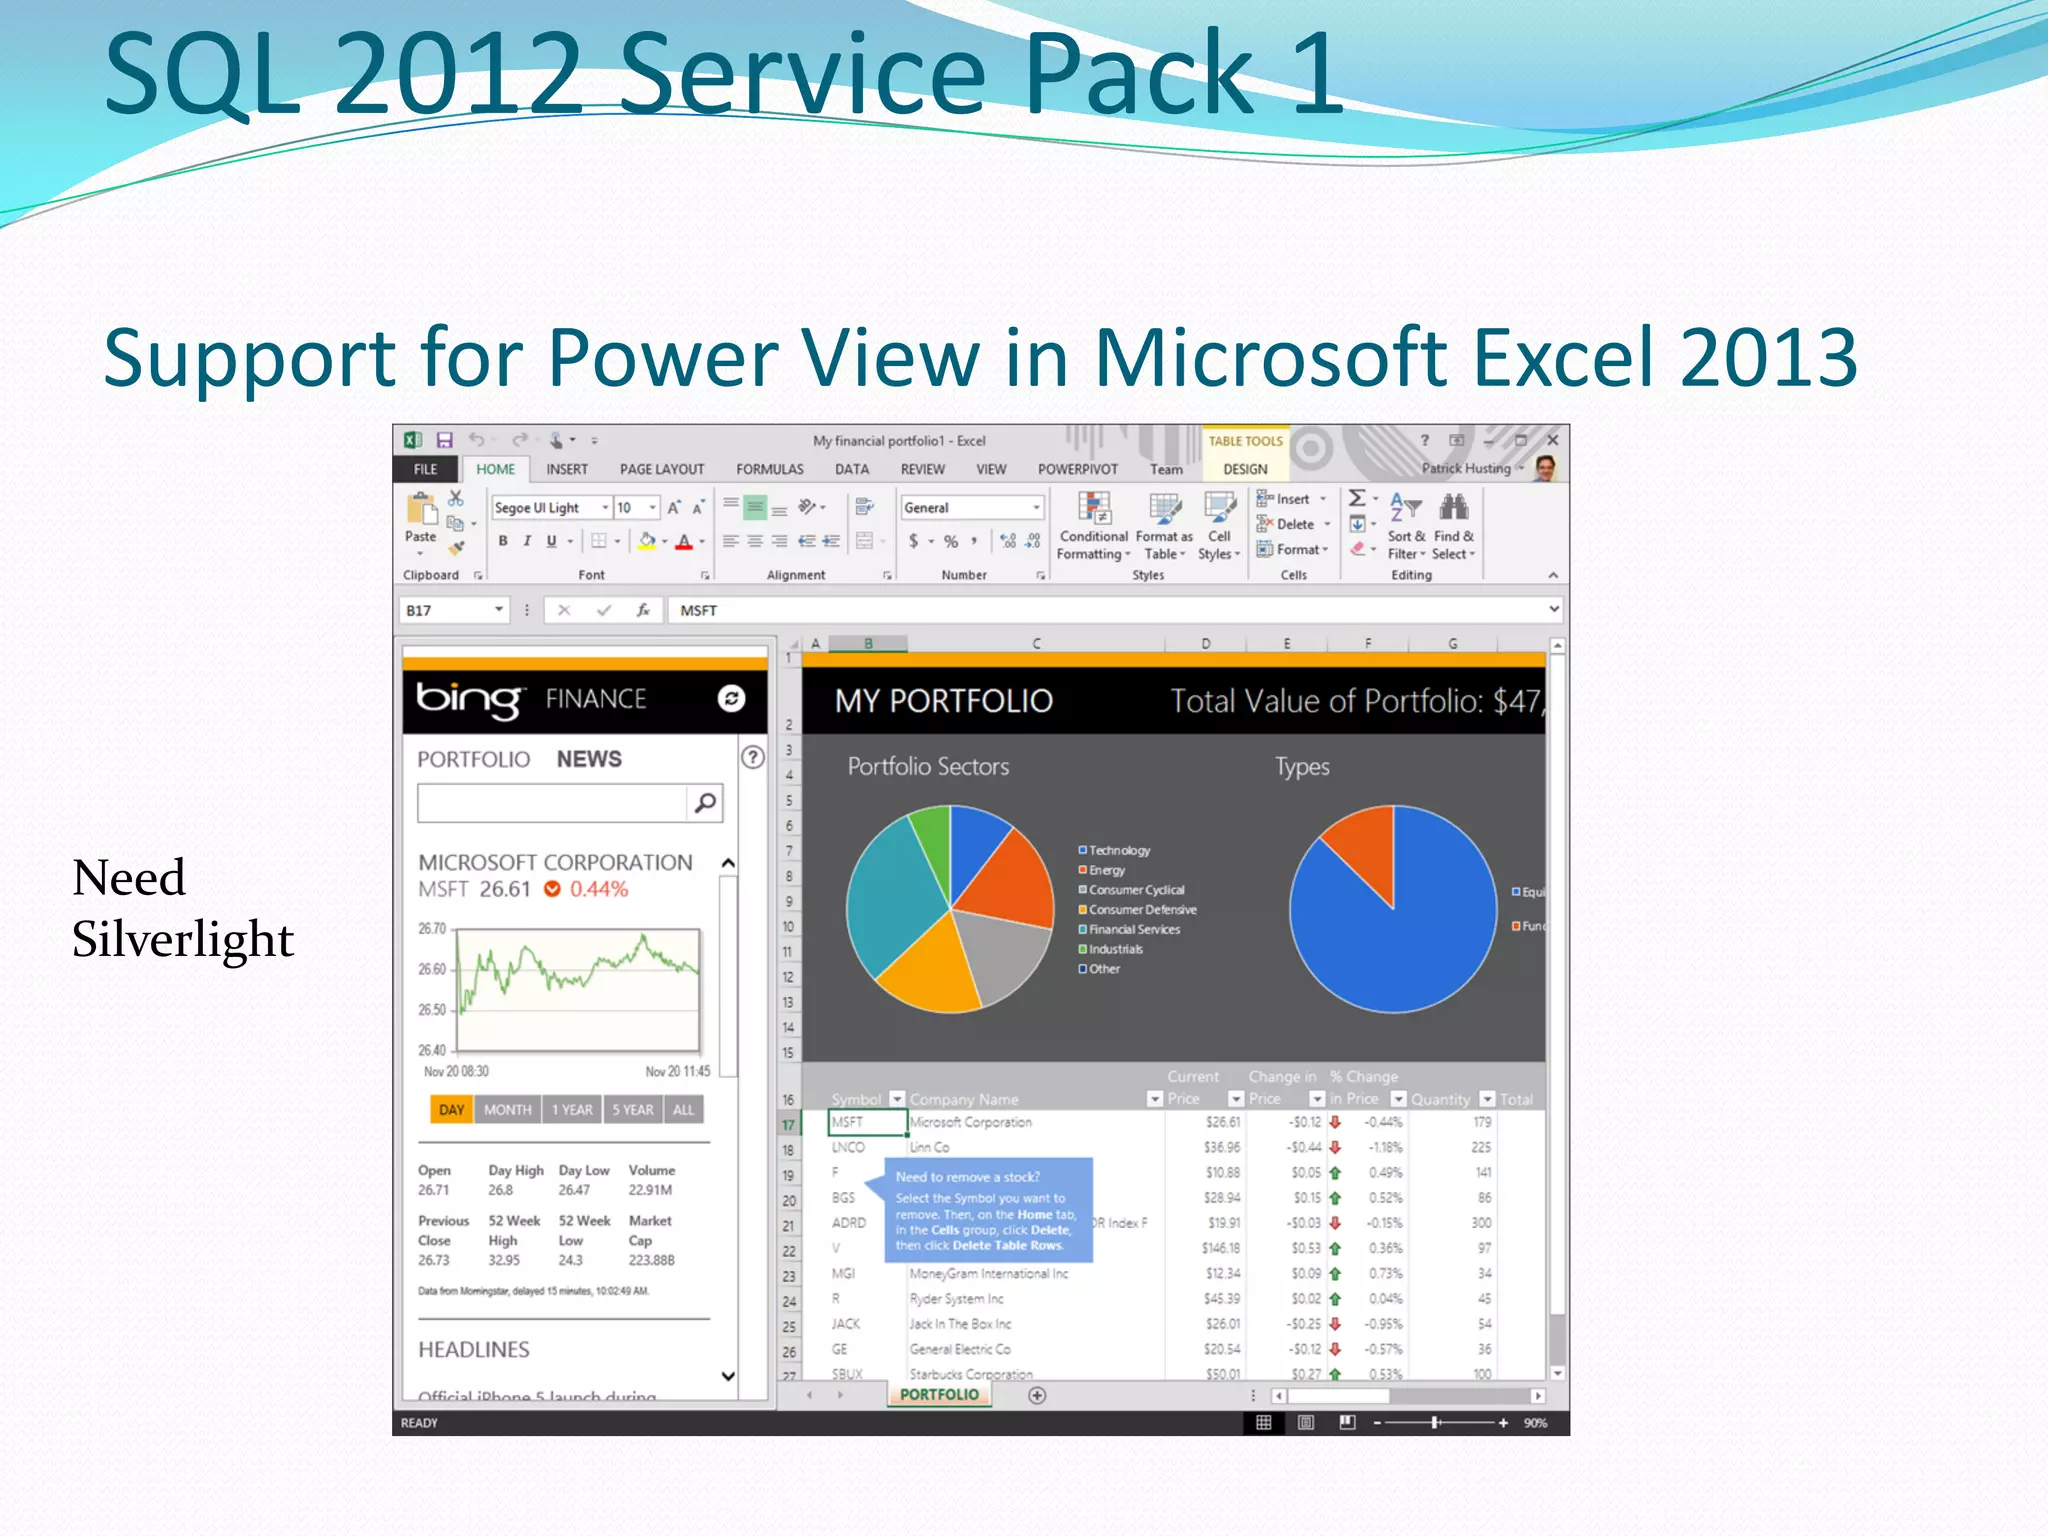
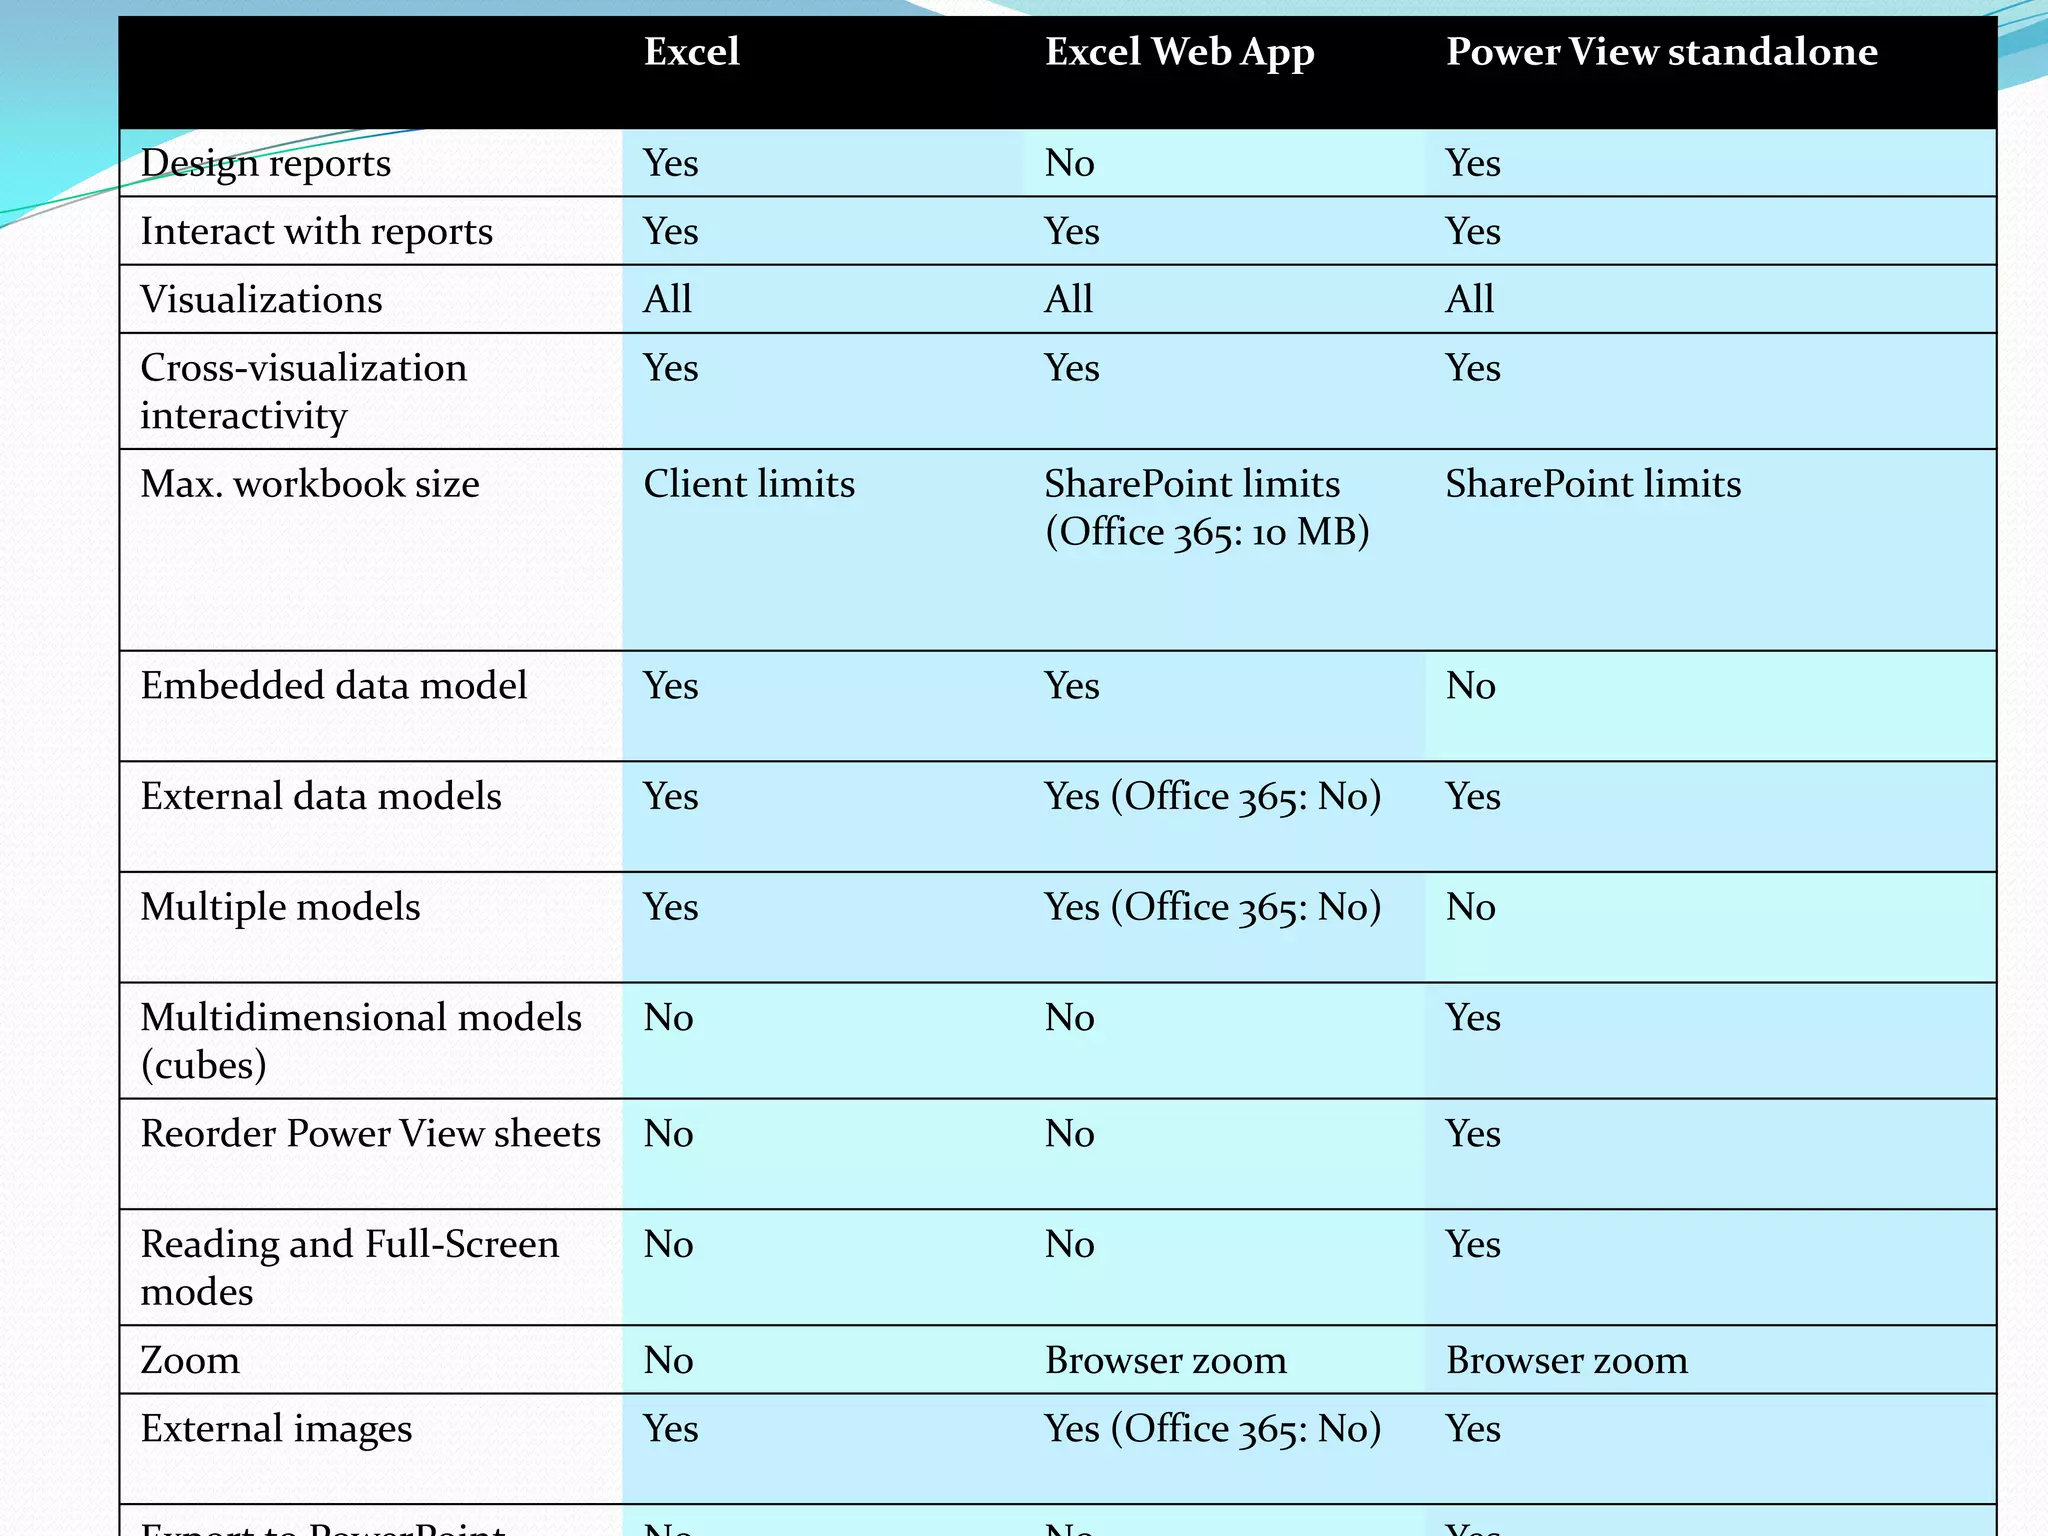
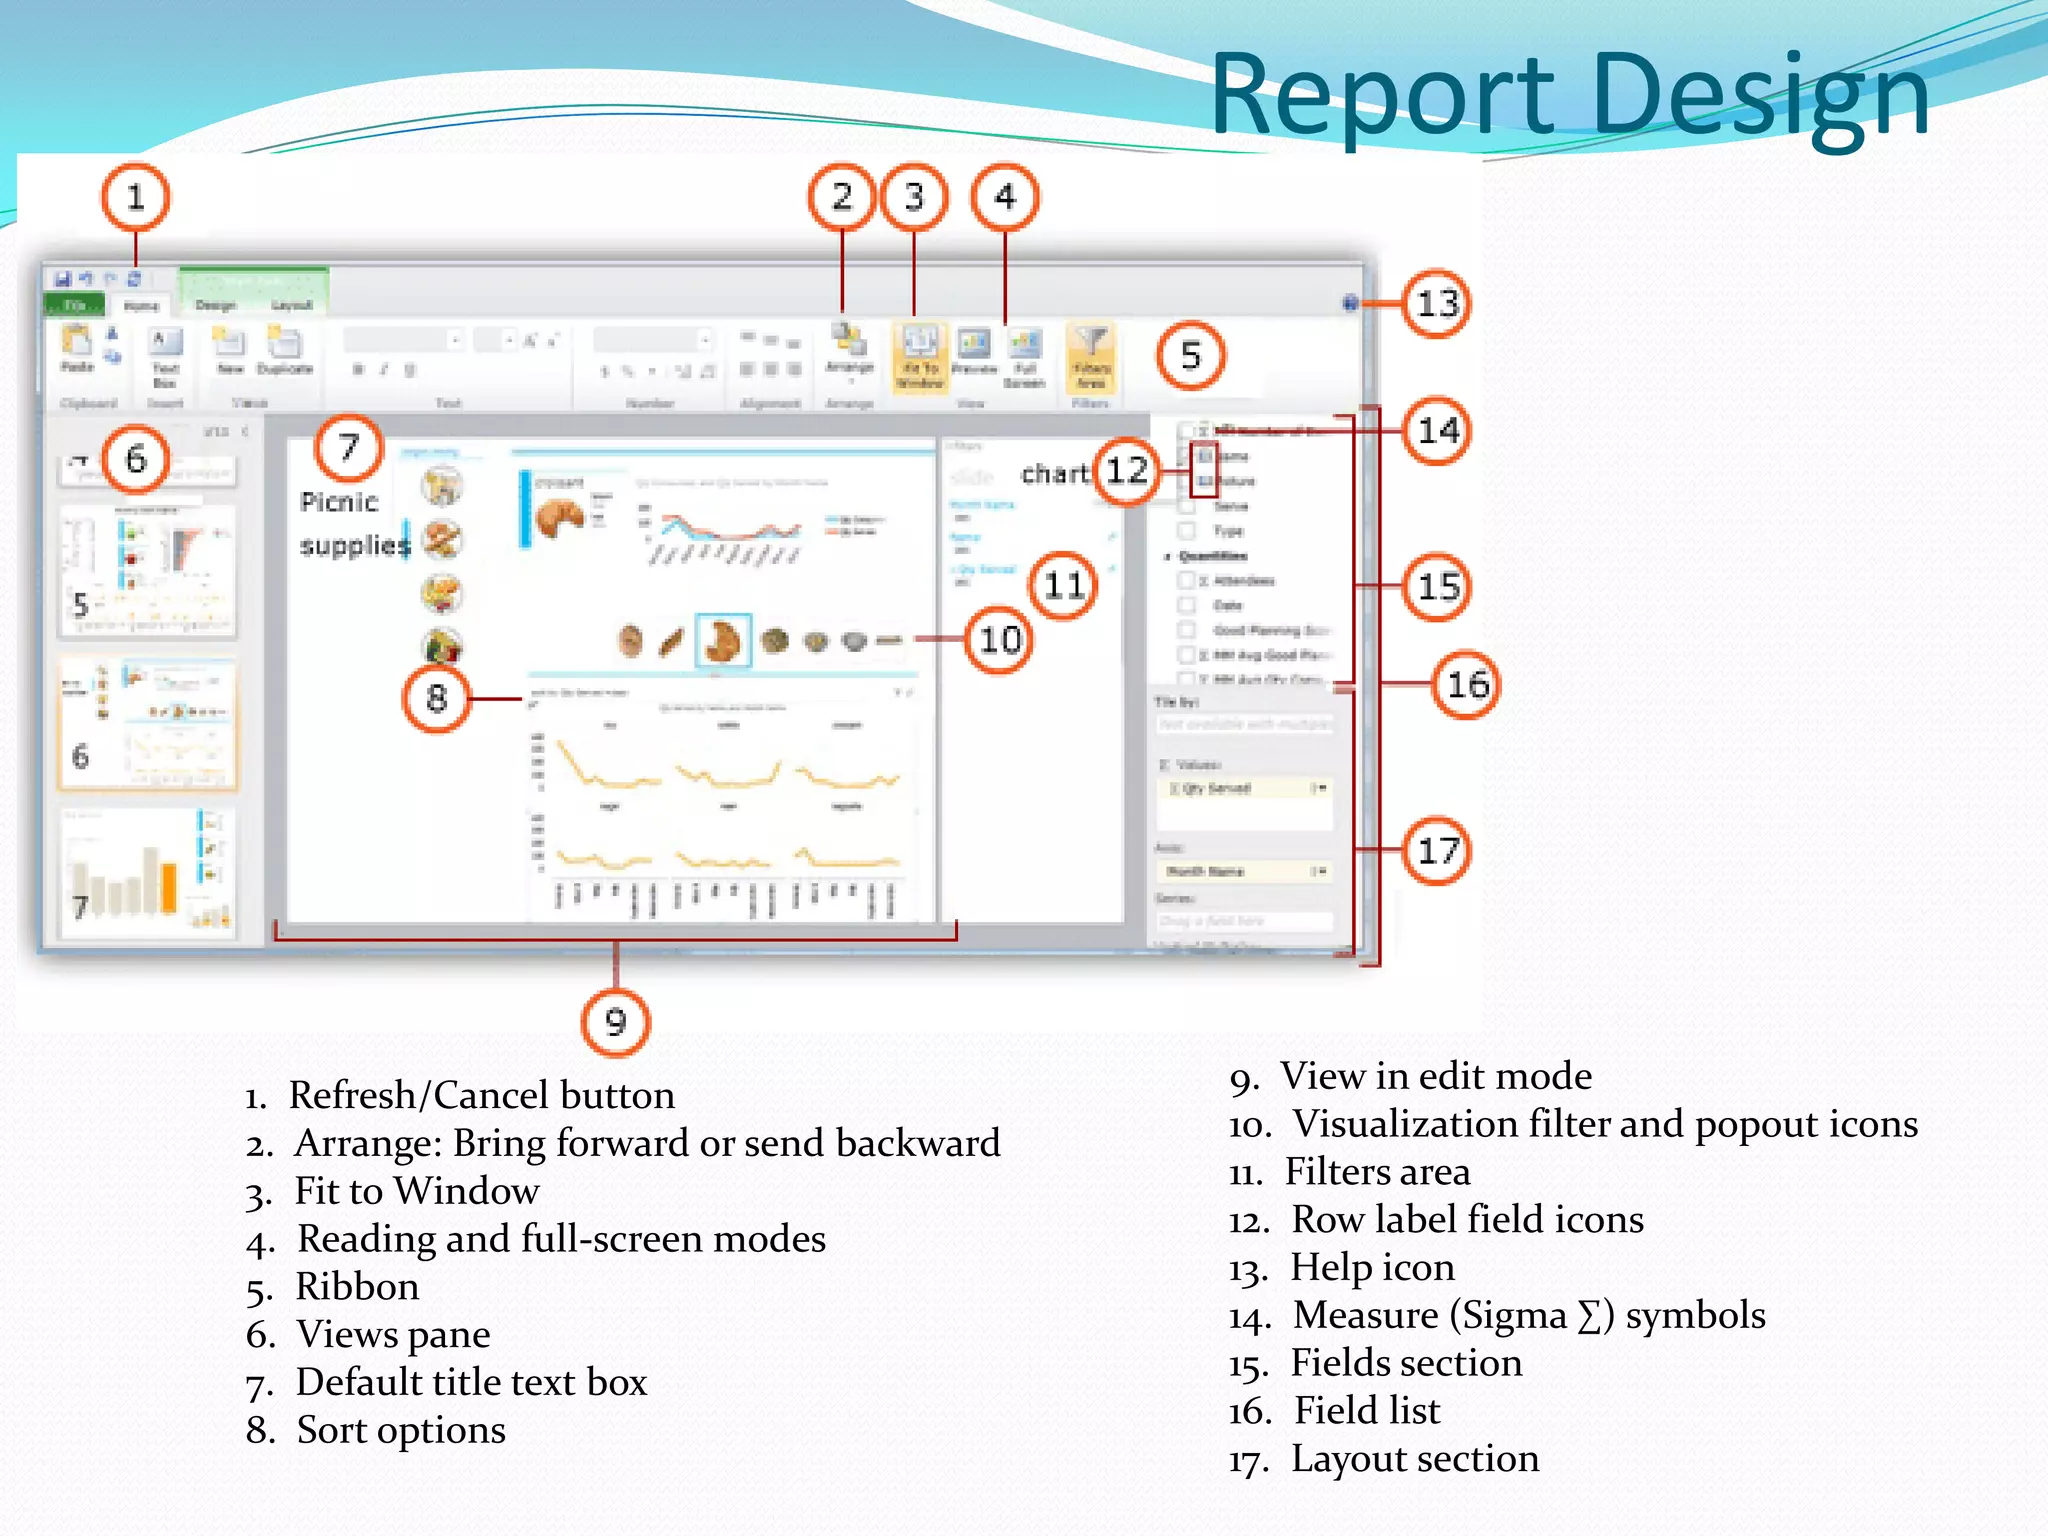
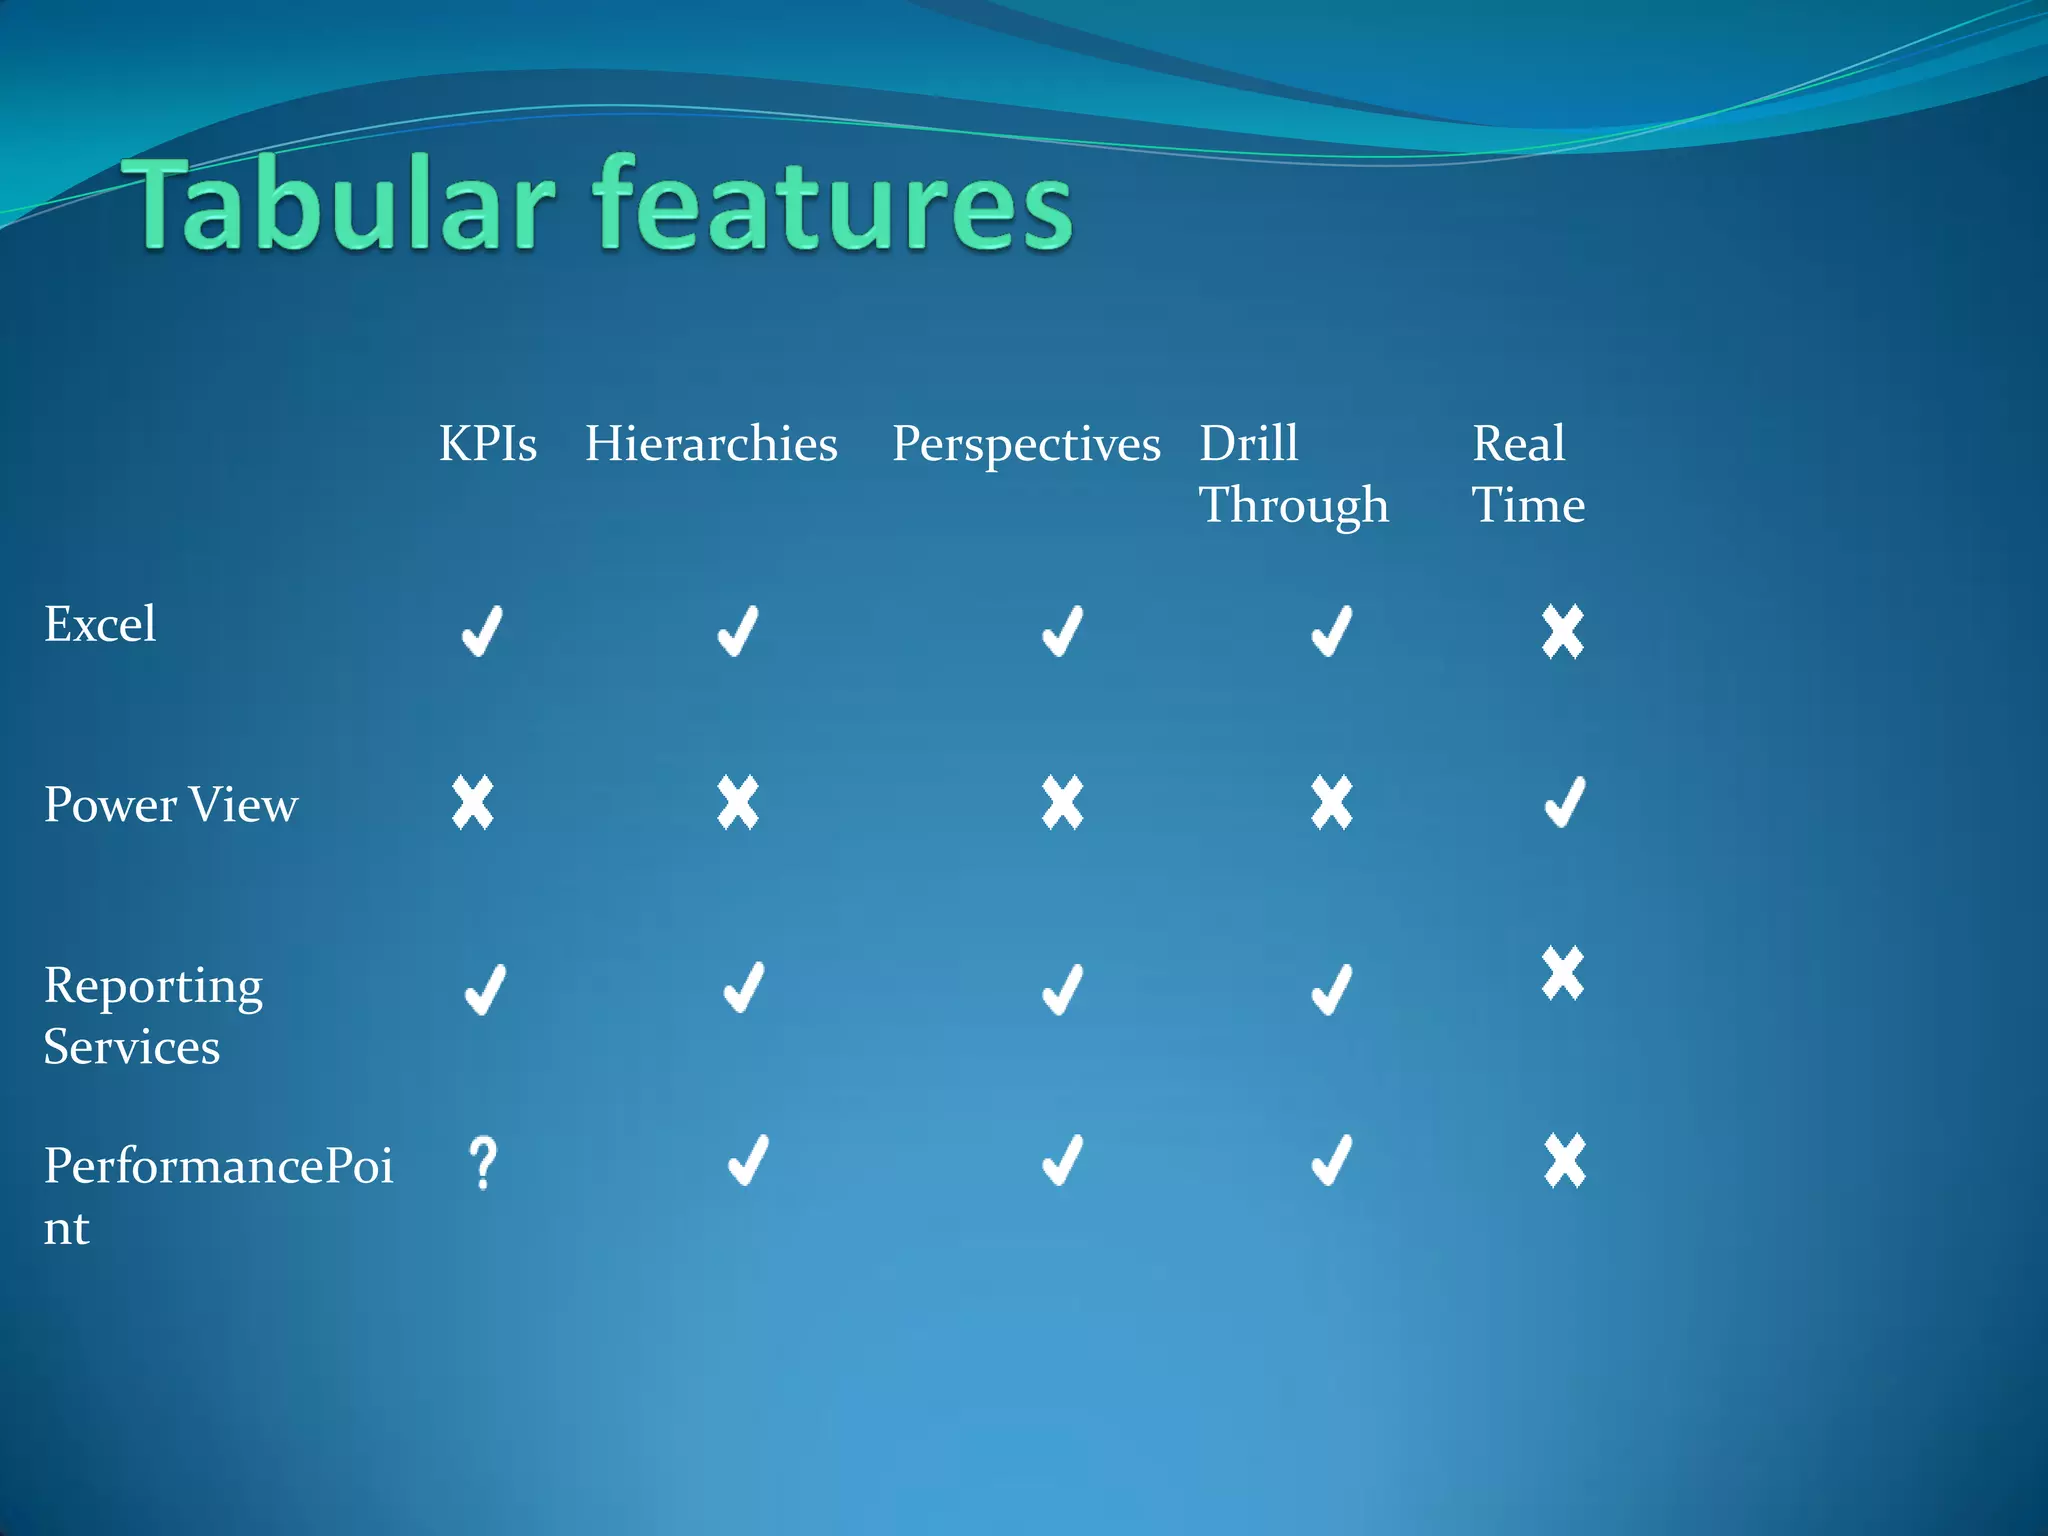
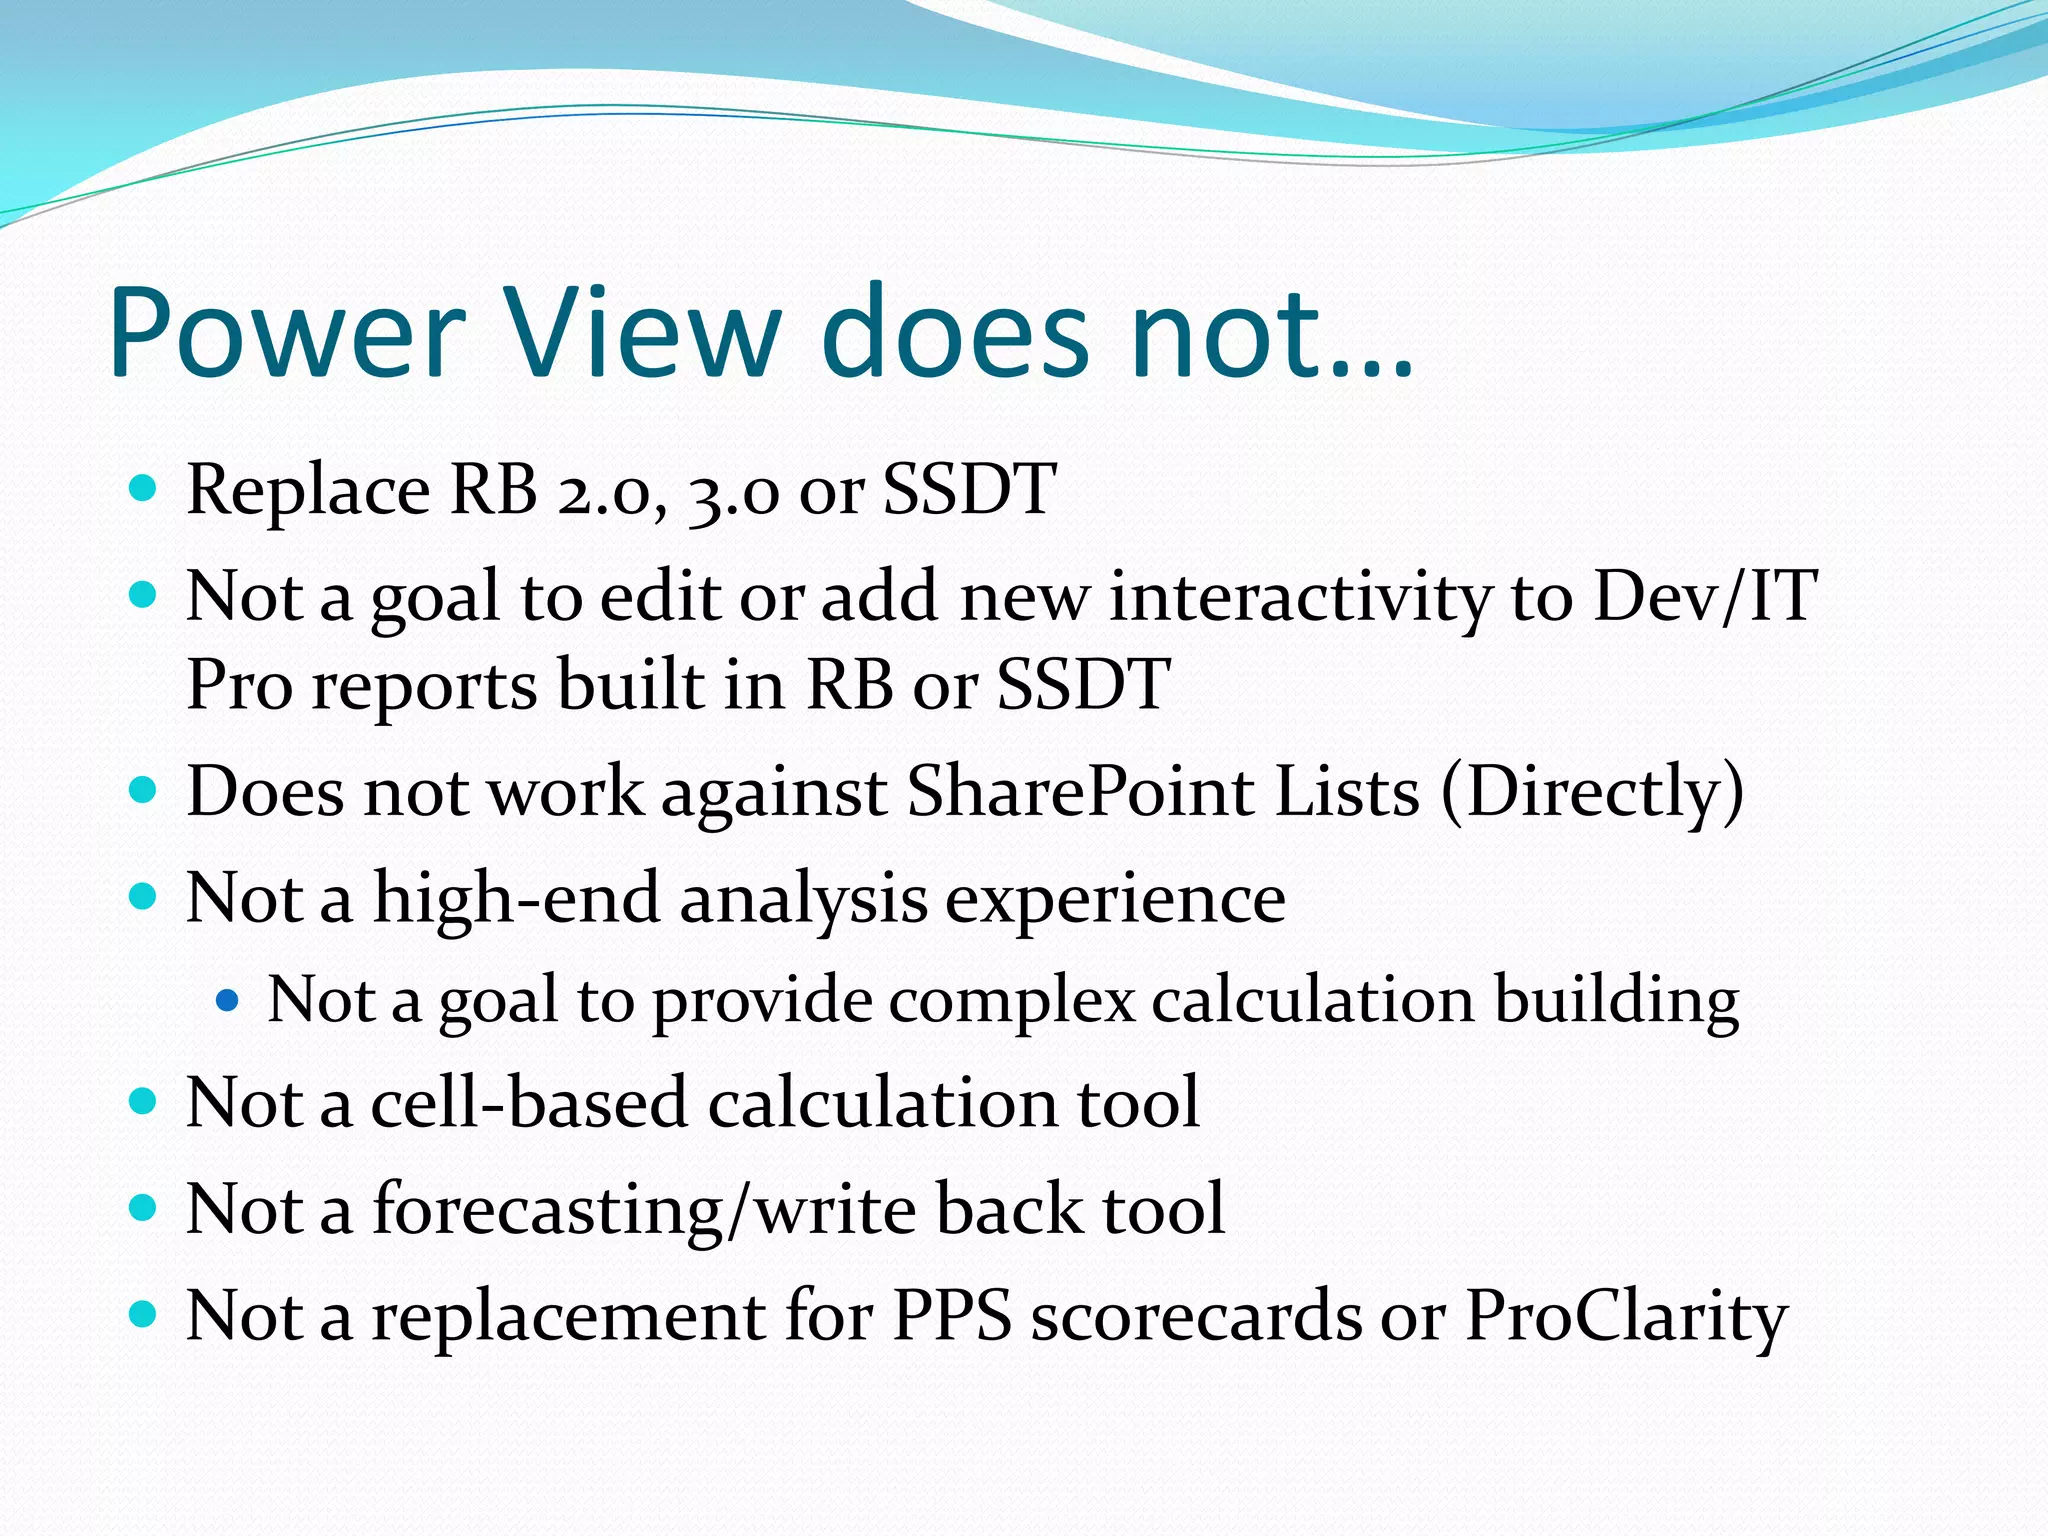
Peter Serzo SPTECHCON – San Francisco March 2013
 Peter Serzo, MCP, MCSD .Net, MCTS  High Monkey Consulting  Blog: monkeyblog.highmonkey.com  www.highmonkey.com  PSerzo@highmonkey.com  Twitter: pserzo  Author  Love to read and Love a Good Story
www.highmonkey.com Check out our new site!
What’s is today’s session about? What is it? Cool things you can do Infrastructure with Reports Power View Create a Data Source Report Configuration
Power View
What is Power View
What is Power View
What is Power View
Reporting Services Team Power View SSRS RB3.0
Power View utilizes Tabular Model
Tabular Model Analysis Services
Power View Brands • Excel Office Professional Plus 2013 Office 365 • Excel Web App SharePoint Server 2013 Enterprise SQL Server 2012 SP1 Business Intelligence Office 365/SharePoint Online • Power View (standalone) in SharePoint SharePoint Server 2010 Enterprise SharePoint Server 2013 Enterprise SQL Server 2012 SP1 Business Intelligence
Direct Query Mode DirectQuery mode for Analysis Services tabular models allows you to keep your data in a SQL Server relational database and still get the benefits of interactive reporting with Power View.
SQL 2012 Service Pack 1 Support for Power View in Microsoft Excel 2013 Need Silverlight
Power View Comparisons
Excel Excel Web App Power View standalone Design reports Yes No Yes Interact with reports Yes Yes Yes Visualizations All All All Cross-visualization Yes Yes Yes interactivity Max. workbook size Client limits SharePoint limits SharePoint limits (Office 365: 10 MB) Embedded data model Yes Yes No External data models Yes Yes (Office 365: No) Yes Multiple models Yes Yes (Office 365: No) No Multidimensional models No No Yes (cubes) Reorder Power View sheets No No Yes Reading and Full-Screen No No Yes modes Zoom No Browser zoom Browser zoom External images Yes Yes (Office 365: No) Yes
Power View Infrastructure/Configuration
Infrastructure
SQL RS Add-in
Site Collection Feature
Creating a Data source…
Creating a Data source… PowerPivot Gallery BISM Connection Power View Data Source Report/xslx
Creating a Data source PowerPivot Gallery…
Creating a Data source Infrastructure…
Creating a Data source PowerPivot Gallery…
You don’t need PowerPivot
Creating a Data source…
Report Design 1. Refresh/Cancel button 9. View in edit mode 2. Arrange: Bring forward or send backward 10. Visualization filter and popout icons 3. Fit to Window 11. Filters area 4. Reading and full-screen modes 12. Row label field icons 5. Ribbon 13. Help icon 6. Views pane 14. Measure (Sigma ∑) symbols 7. Default title text box 15. Fields section 8. Sort options 16. Field list 17. Layout section
KPIs Hierarchies Perspectives Drill Real Through Time Excel Power View Reporting Services PerformancePoi nt
Power View does not…  Replace RB 2.0, 3.0 or SSDT  Not a goal to edit or add new interactivity to Dev/IT Pro reports built in RB or SSDT  Does not work against SharePoint Lists (Directly)  Not a high-end analysis experience  Not a goal to provide complex calculation building  Not a cell-based calculation tool  Not a forecasting/write back tool  Not a replacement for PPS scorecards or ProClarity
Questions

Create Dynamic Interactive Reports Using Power View by Peter Serzo - SPTechCon

  • 1.
    Peter Serzo SPTECHCON –San Francisco March 2013
  • 2.
     Peter Serzo,MCP, MCSD .Net, MCTS  High Monkey Consulting  Blog: monkeyblog.highmonkey.com  www.highmonkey.com  PSerzo@highmonkey.com  Twitter: pserzo  Author  Love to read and Love a Good Story
  • 3.
  • 5.
    What’s is today’ssession about? What is it? Cool things you can do Infrastructure with Reports Power View Create a Data Source Report Configuration
  • 6.
  • 8.
  • 9.
  • 10.
  • 11.
    Reporting Services Team Power View SSRS RB3.0
  • 12.
    Power View utilizes Tabular Model
  • 13.
  • 14.
    Power View Brands •Excel Office Professional Plus 2013 Office 365 • Excel Web App SharePoint Server 2013 Enterprise SQL Server 2012 SP1 Business Intelligence Office 365/SharePoint Online • Power View (standalone) in SharePoint SharePoint Server 2010 Enterprise SharePoint Server 2013 Enterprise SQL Server 2012 SP1 Business Intelligence
  • 15.
    Direct Query Mode DirectQuery mode for Analysis Services tabular models allows you to keep your data in a SQL Server relational database and still get the benefits of interactive reporting with Power View.
  • 16.
    SQL 2012 ServicePack 1 Support for Power View in Microsoft Excel 2013 Need Silverlight
  • 17.
  • 18.
    Excel Excel Web App Power View standalone Design reports Yes No Yes Interact with reports Yes Yes Yes Visualizations All All All Cross-visualization Yes Yes Yes interactivity Max. workbook size Client limits SharePoint limits SharePoint limits (Office 365: 10 MB) Embedded data model Yes Yes No External data models Yes Yes (Office 365: No) Yes Multiple models Yes Yes (Office 365: No) No Multidimensional models No No Yes (cubes) Reorder Power View sheets No No Yes Reading and Full-Screen No No Yes modes Zoom No Browser zoom Browser zoom External images Yes Yes (Office 365: No) Yes
  • 19.
  • 20.
  • 21.
  • 22.
  • 23.
    Creating a Datasource…
  • 24.
    Creating a Datasource… PowerPivot Gallery BISM Connection Power View Data Source Report/xslx
  • 25.
    Creating a Datasource PowerPivot Gallery…
  • 26.
    Creating a Datasource Infrastructure…
  • 27.
    Creating a Datasource PowerPivot Gallery…
  • 28.
    Creating a Datasource PowerPivot Gallery…
  • 29.
    You don’t needPowerPivot
  • 30.
    Creating a Datasource…
  • 32.
    Report Design 1. Refresh/Cancelbutton 9. View in edit mode 2. Arrange: Bring forward or send backward 10. Visualization filter and popout icons 3. Fit to Window 11. Filters area 4. Reading and full-screen modes 12. Row label field icons 5. Ribbon 13. Help icon 6. Views pane 14. Measure (Sigma ∑) symbols 7. Default title text box 15. Fields section 8. Sort options 16. Field list 17. Layout section
  • 34.
    KPIs Hierarchies Perspectives Drill Real Through Time Excel Power View Reporting Services PerformancePoi nt
  • 35.
    Power View doesnot…  Replace RB 2.0, 3.0 or SSDT  Not a goal to edit or add new interactivity to Dev/IT Pro reports built in RB or SSDT  Does not work against SharePoint Lists (Directly)  Not a high-end analysis experience  Not a goal to provide complex calculation building  Not a cell-based calculation tool  Not a forecasting/write back tool  Not a replacement for PPS scorecards or ProClarity
  • 36.