Download to read offline

![The Plan • What are the use cases for charts? • What tools are available today? • Why do charts in JavaScript rather than [OTHERTECH]? • What is d3.js? • Exploring Dimple.js](https://image.slidesharecdn.com/chartinginyourbrowserwithhtml5andjavascript-141217081723-conversion-gate02/75/Charting-in-your-browser-with-html5-and-java-script-3-2048.jpg)
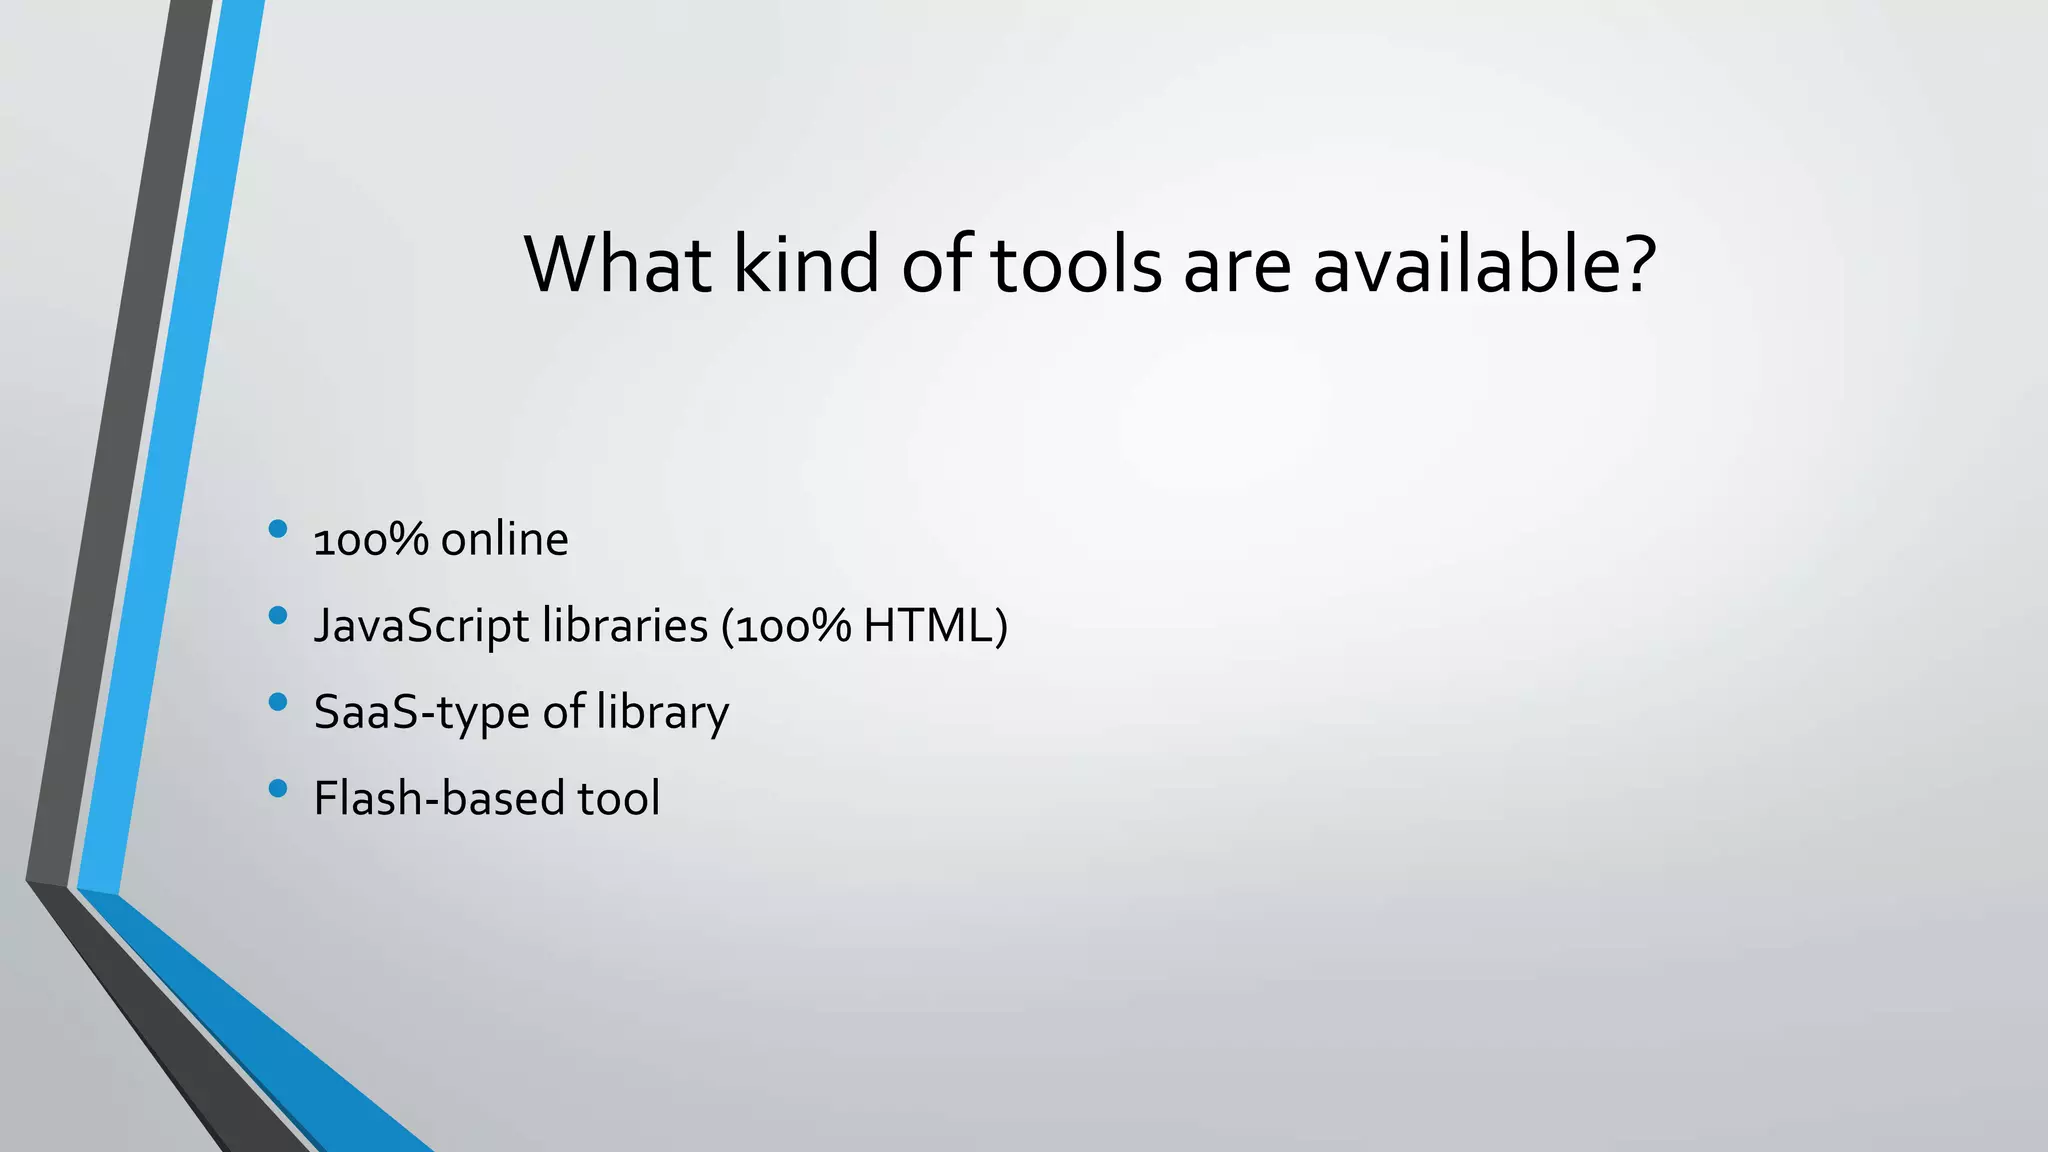
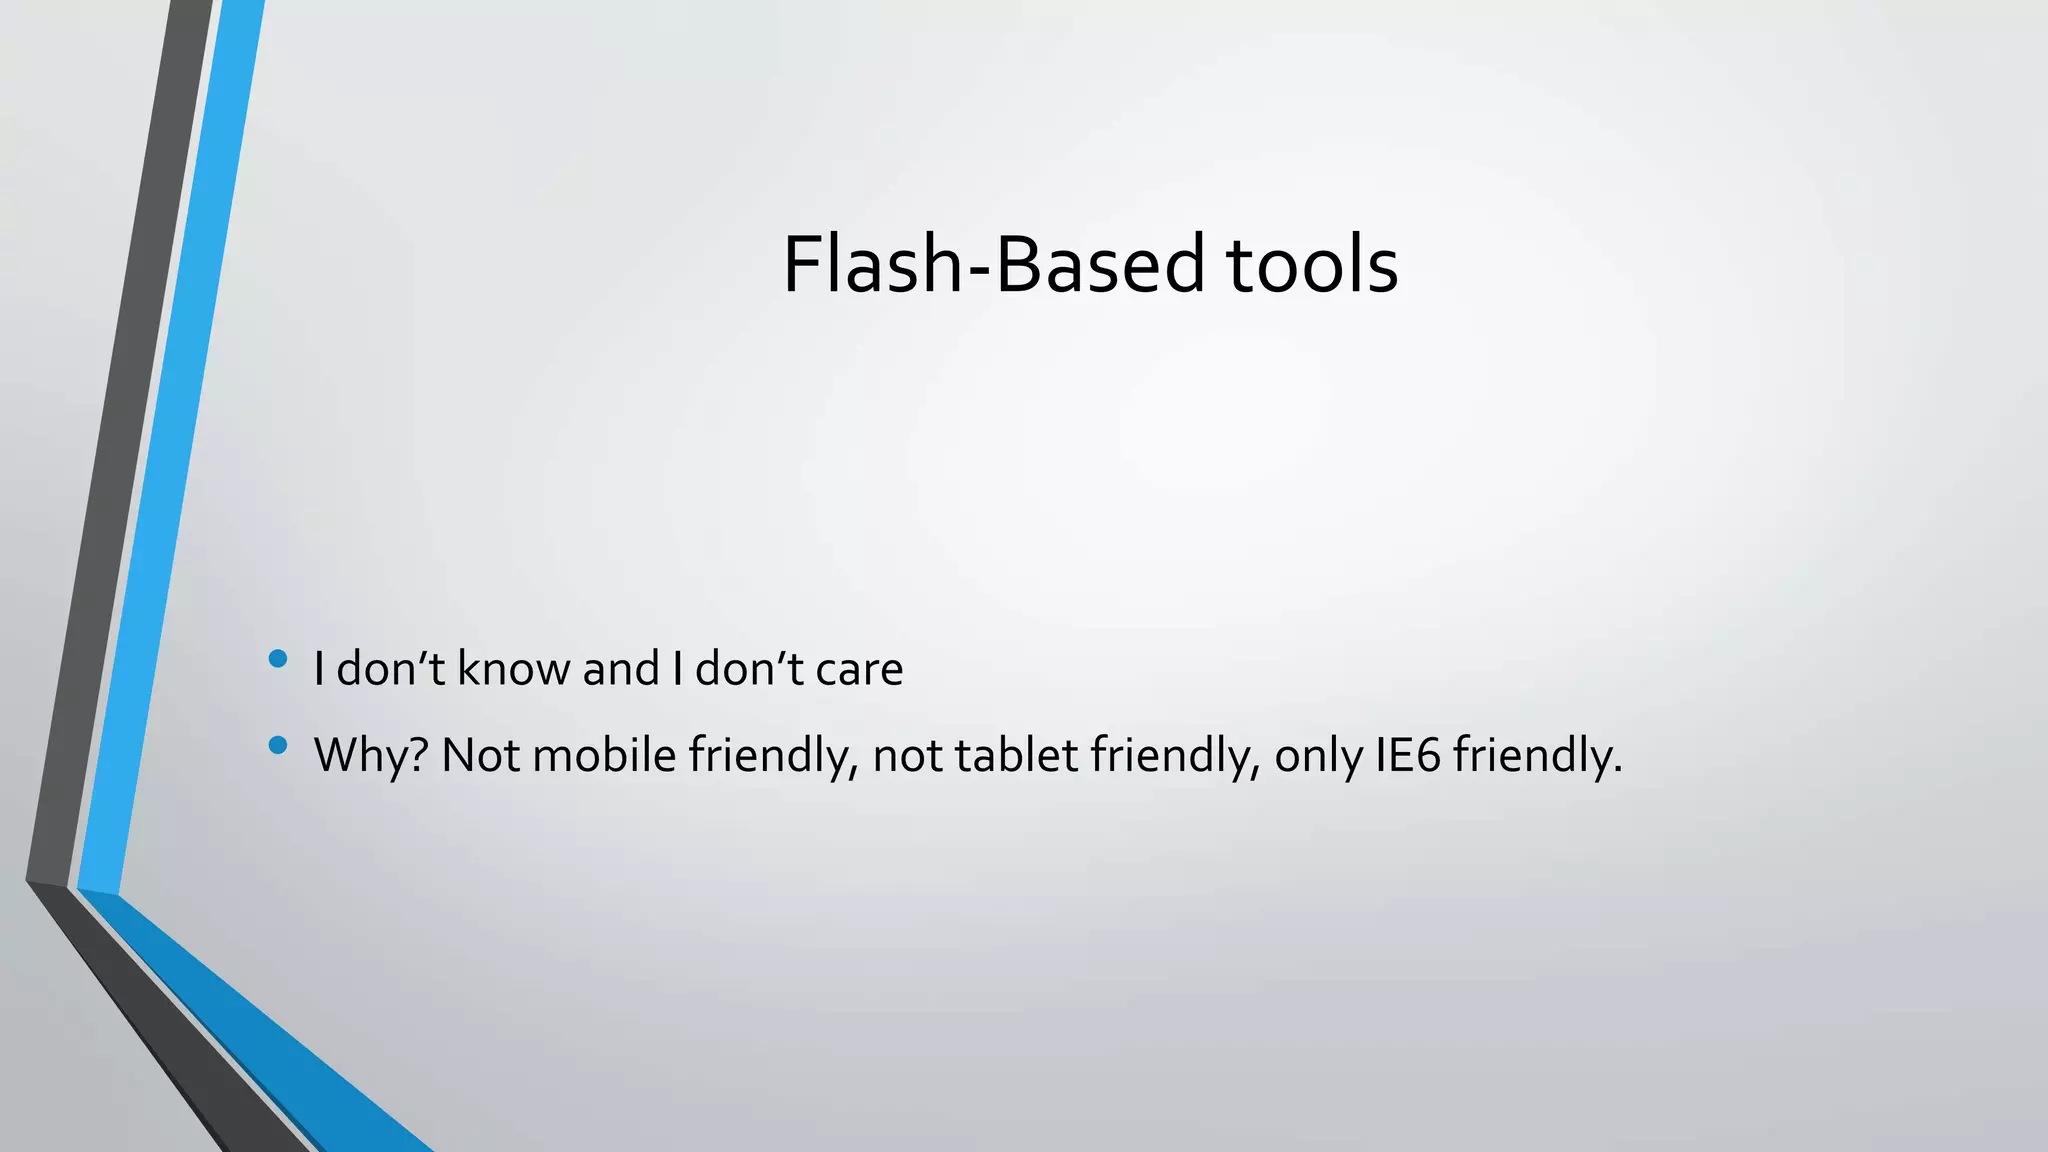

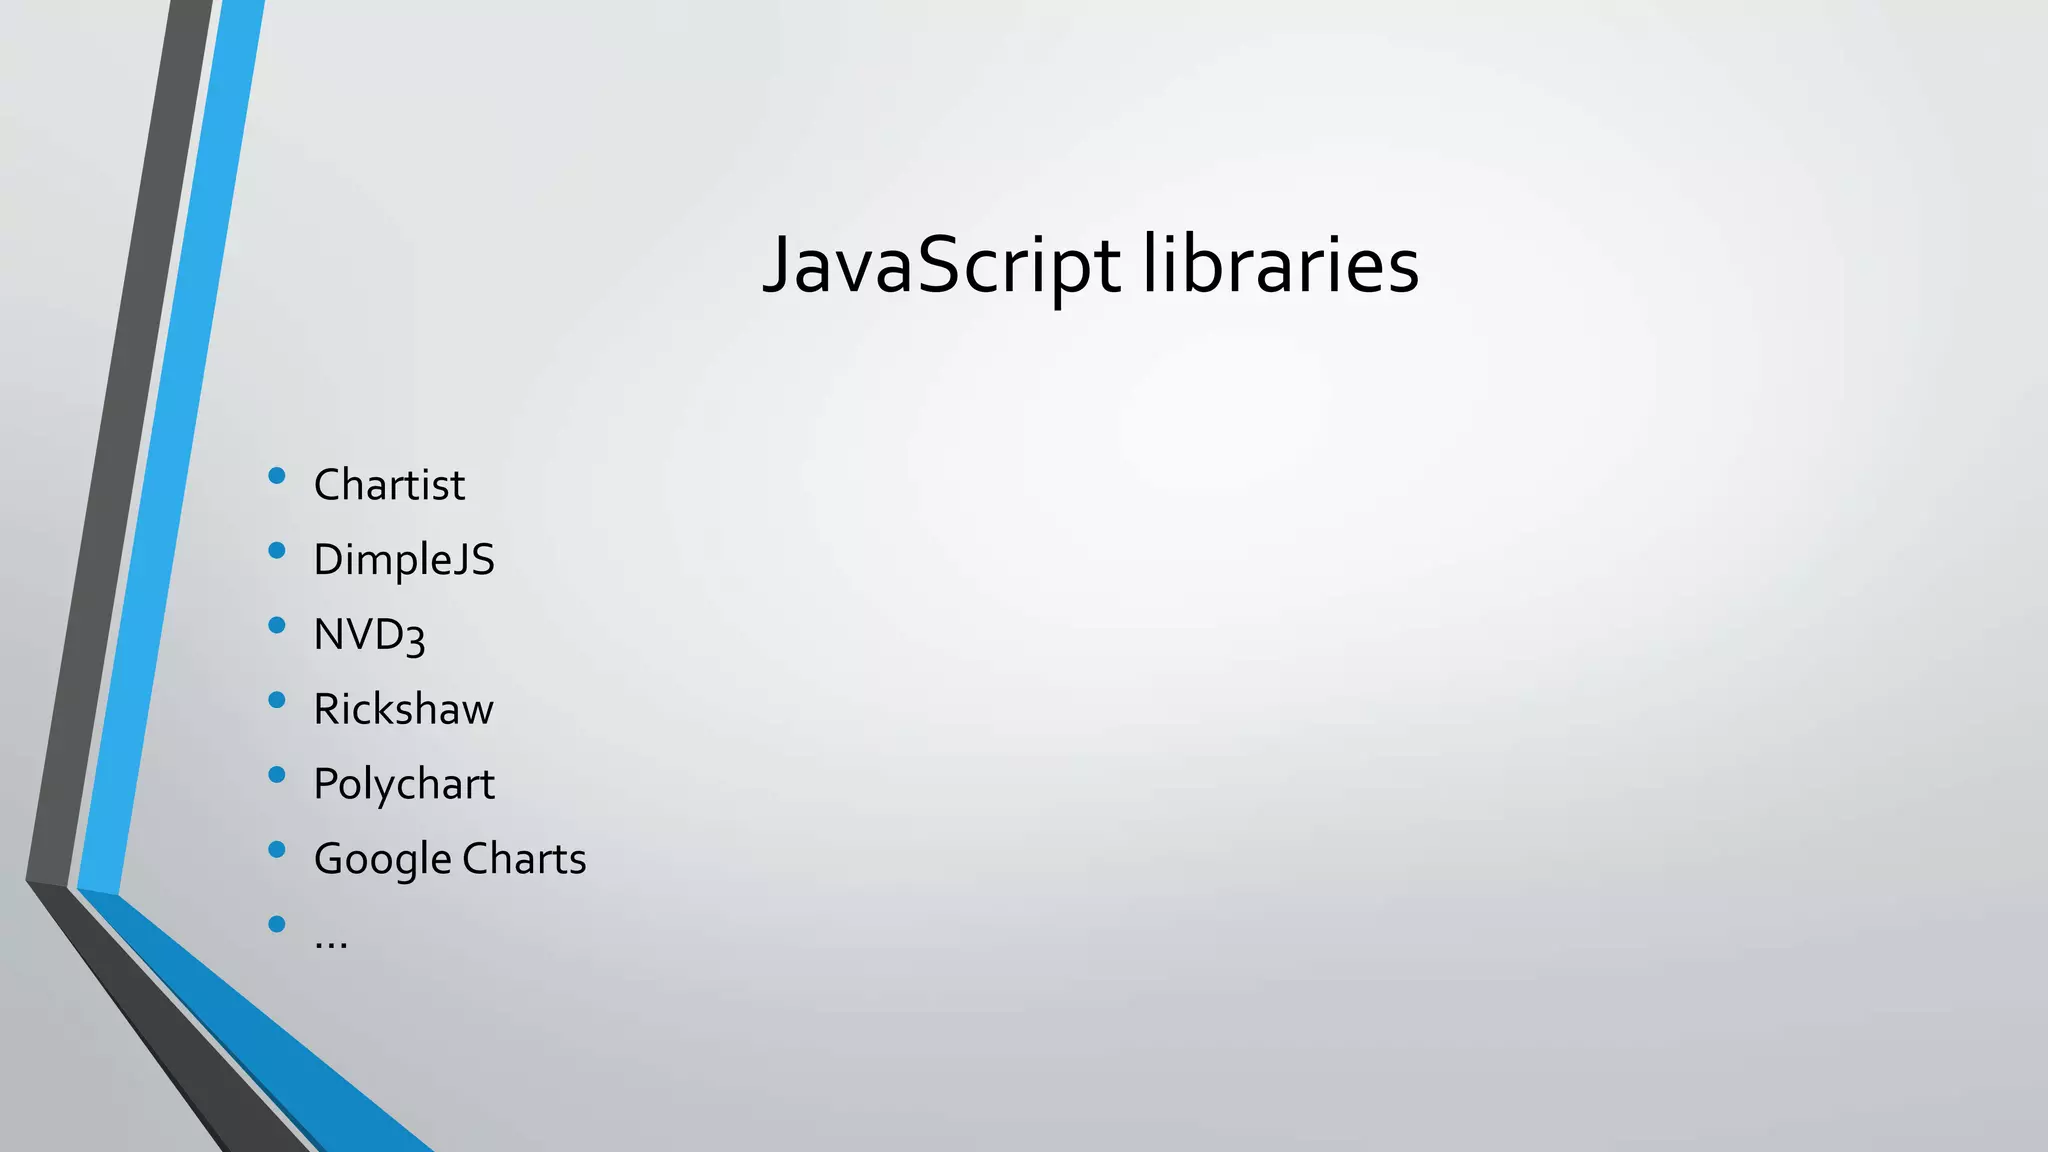
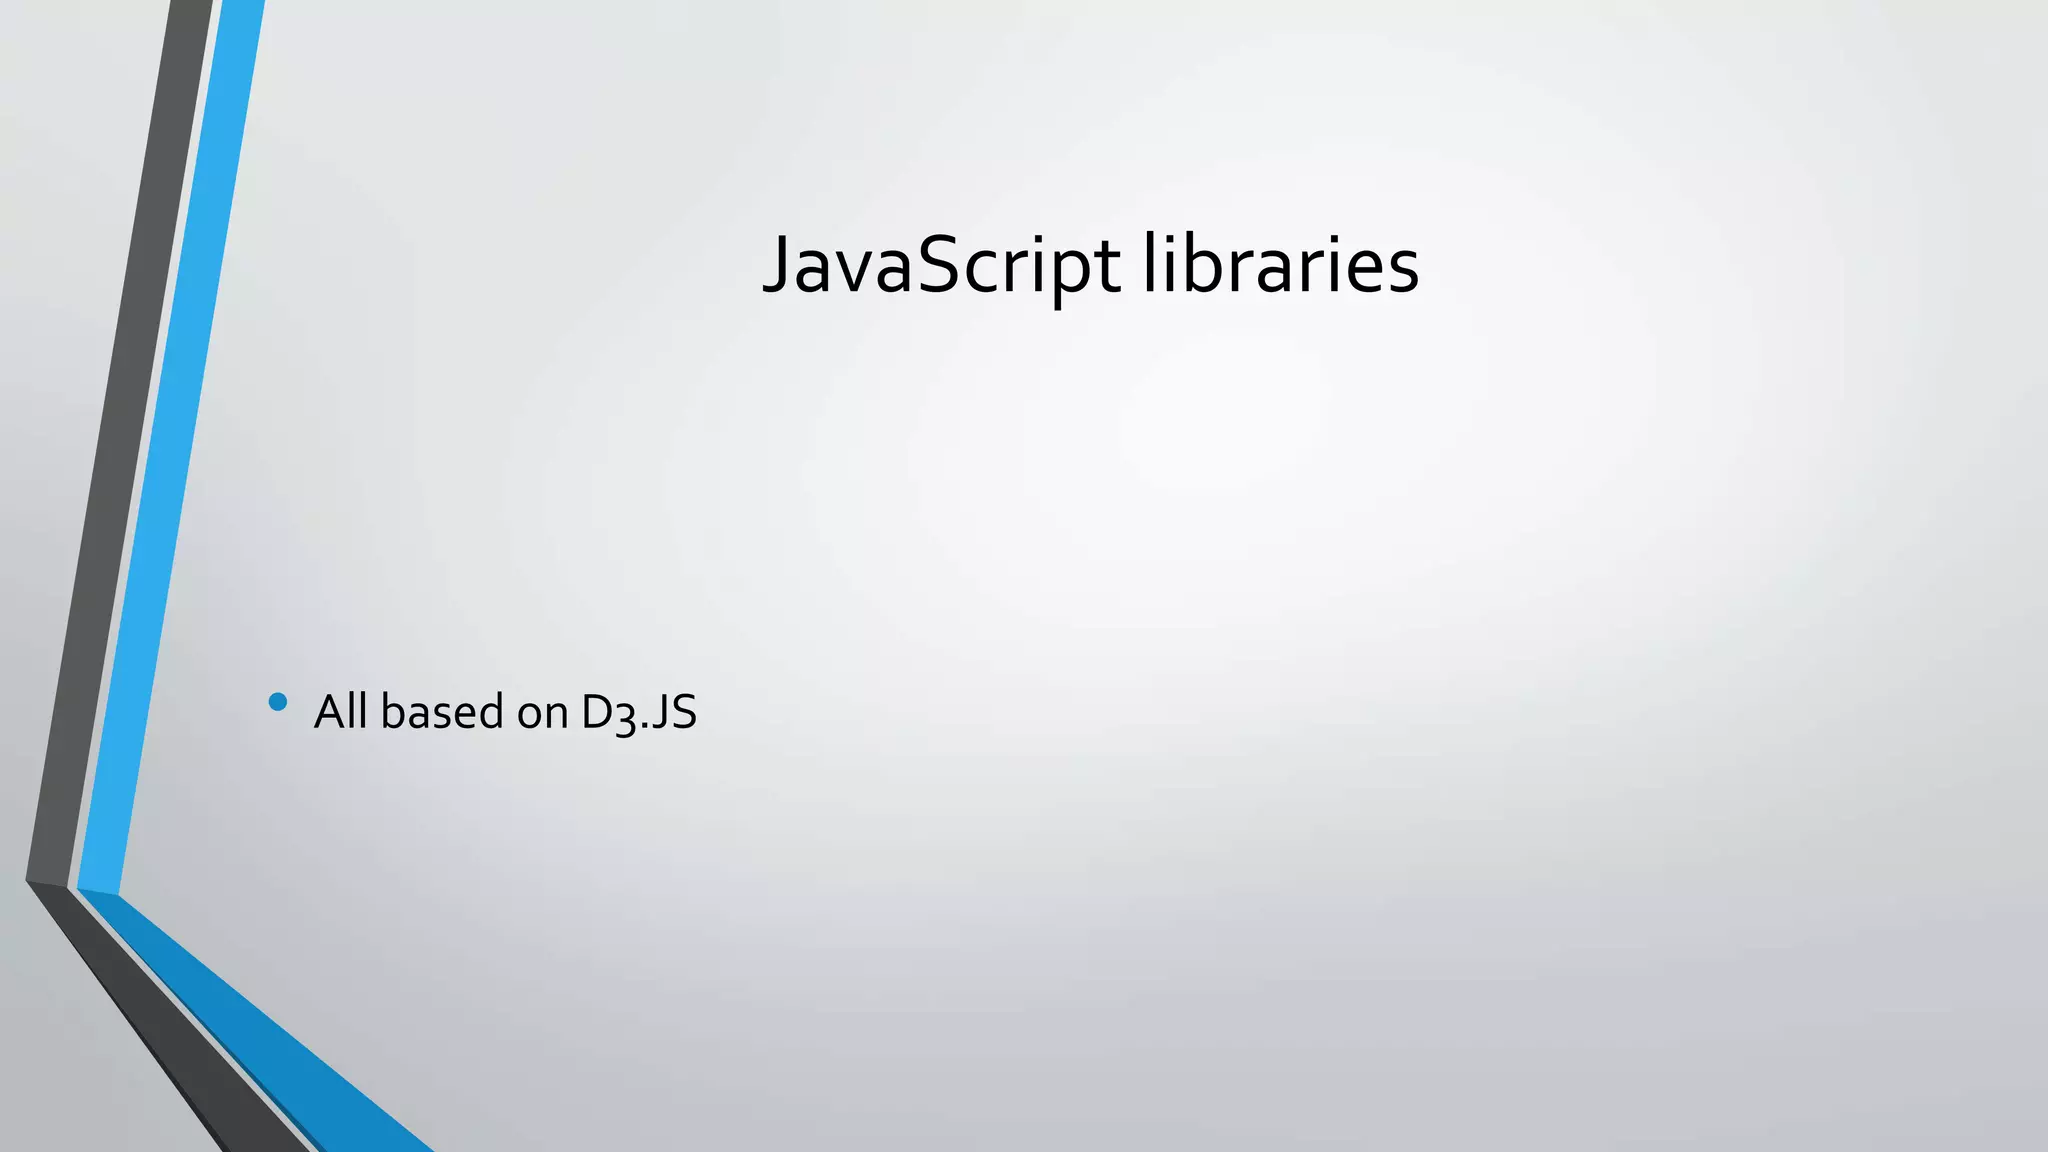


This document outlines a plan to discuss charting in the browser using HTML5 and JavaScript. It will cover use cases for charts, available tools including JavaScript libraries like D3.js and Dimple.js, and why charts should be done in JavaScript rather than other technologies. An example of a polar clock chart built with D3.js is shown, and the document concludes with a demonstration of creating basic and multiple data source charts with Dimple.js.