Downloaded 1,150 times

![How to read Android crash log and stack trace ● The following is actually the current stack with the stack pointer address and code dump. Each line contains 4 bytes (one machine word), and the address is in ascending order. The words in the stack are mapped onto the memory region it belongs to. I/DEBUG ( 730): stack: I/DEBUG ( 730): beaf9898 00016618 [heap] I/DEBUG ( 730): beaf989c beaf98d0 [stack] I/DEBUG ( 730): beaf98a0 0000db28 [heap] I/DEBUG ( 730): beaf98a4 beaf98f8 [stack] I/DEBUG ( 730): beaf98b8 8021cf4d /system/lib/libhelixplayer.so I/DEBUG ( 730): beaf98bc 80248f78 I/DEBUG ( 730): #00 beaf98d8 0000d330 [heap] I/DEBUG ( 730): beaf98dc 00000000 I/DEBUG ( 730): beaf98e0 0000d330 [heap] I/DEBUG ( 730): beaf98e4 8021edcd /system/lib/libhelixplayer.so I/DEBUG ( 730): #01 beaf98e8 80248f78 ● 20 ●](https://image.slidesharecdn.com/androidcrashdebugging-121218232922-phpapp02/75/Android-crash-debugging-20-2048.jpg)
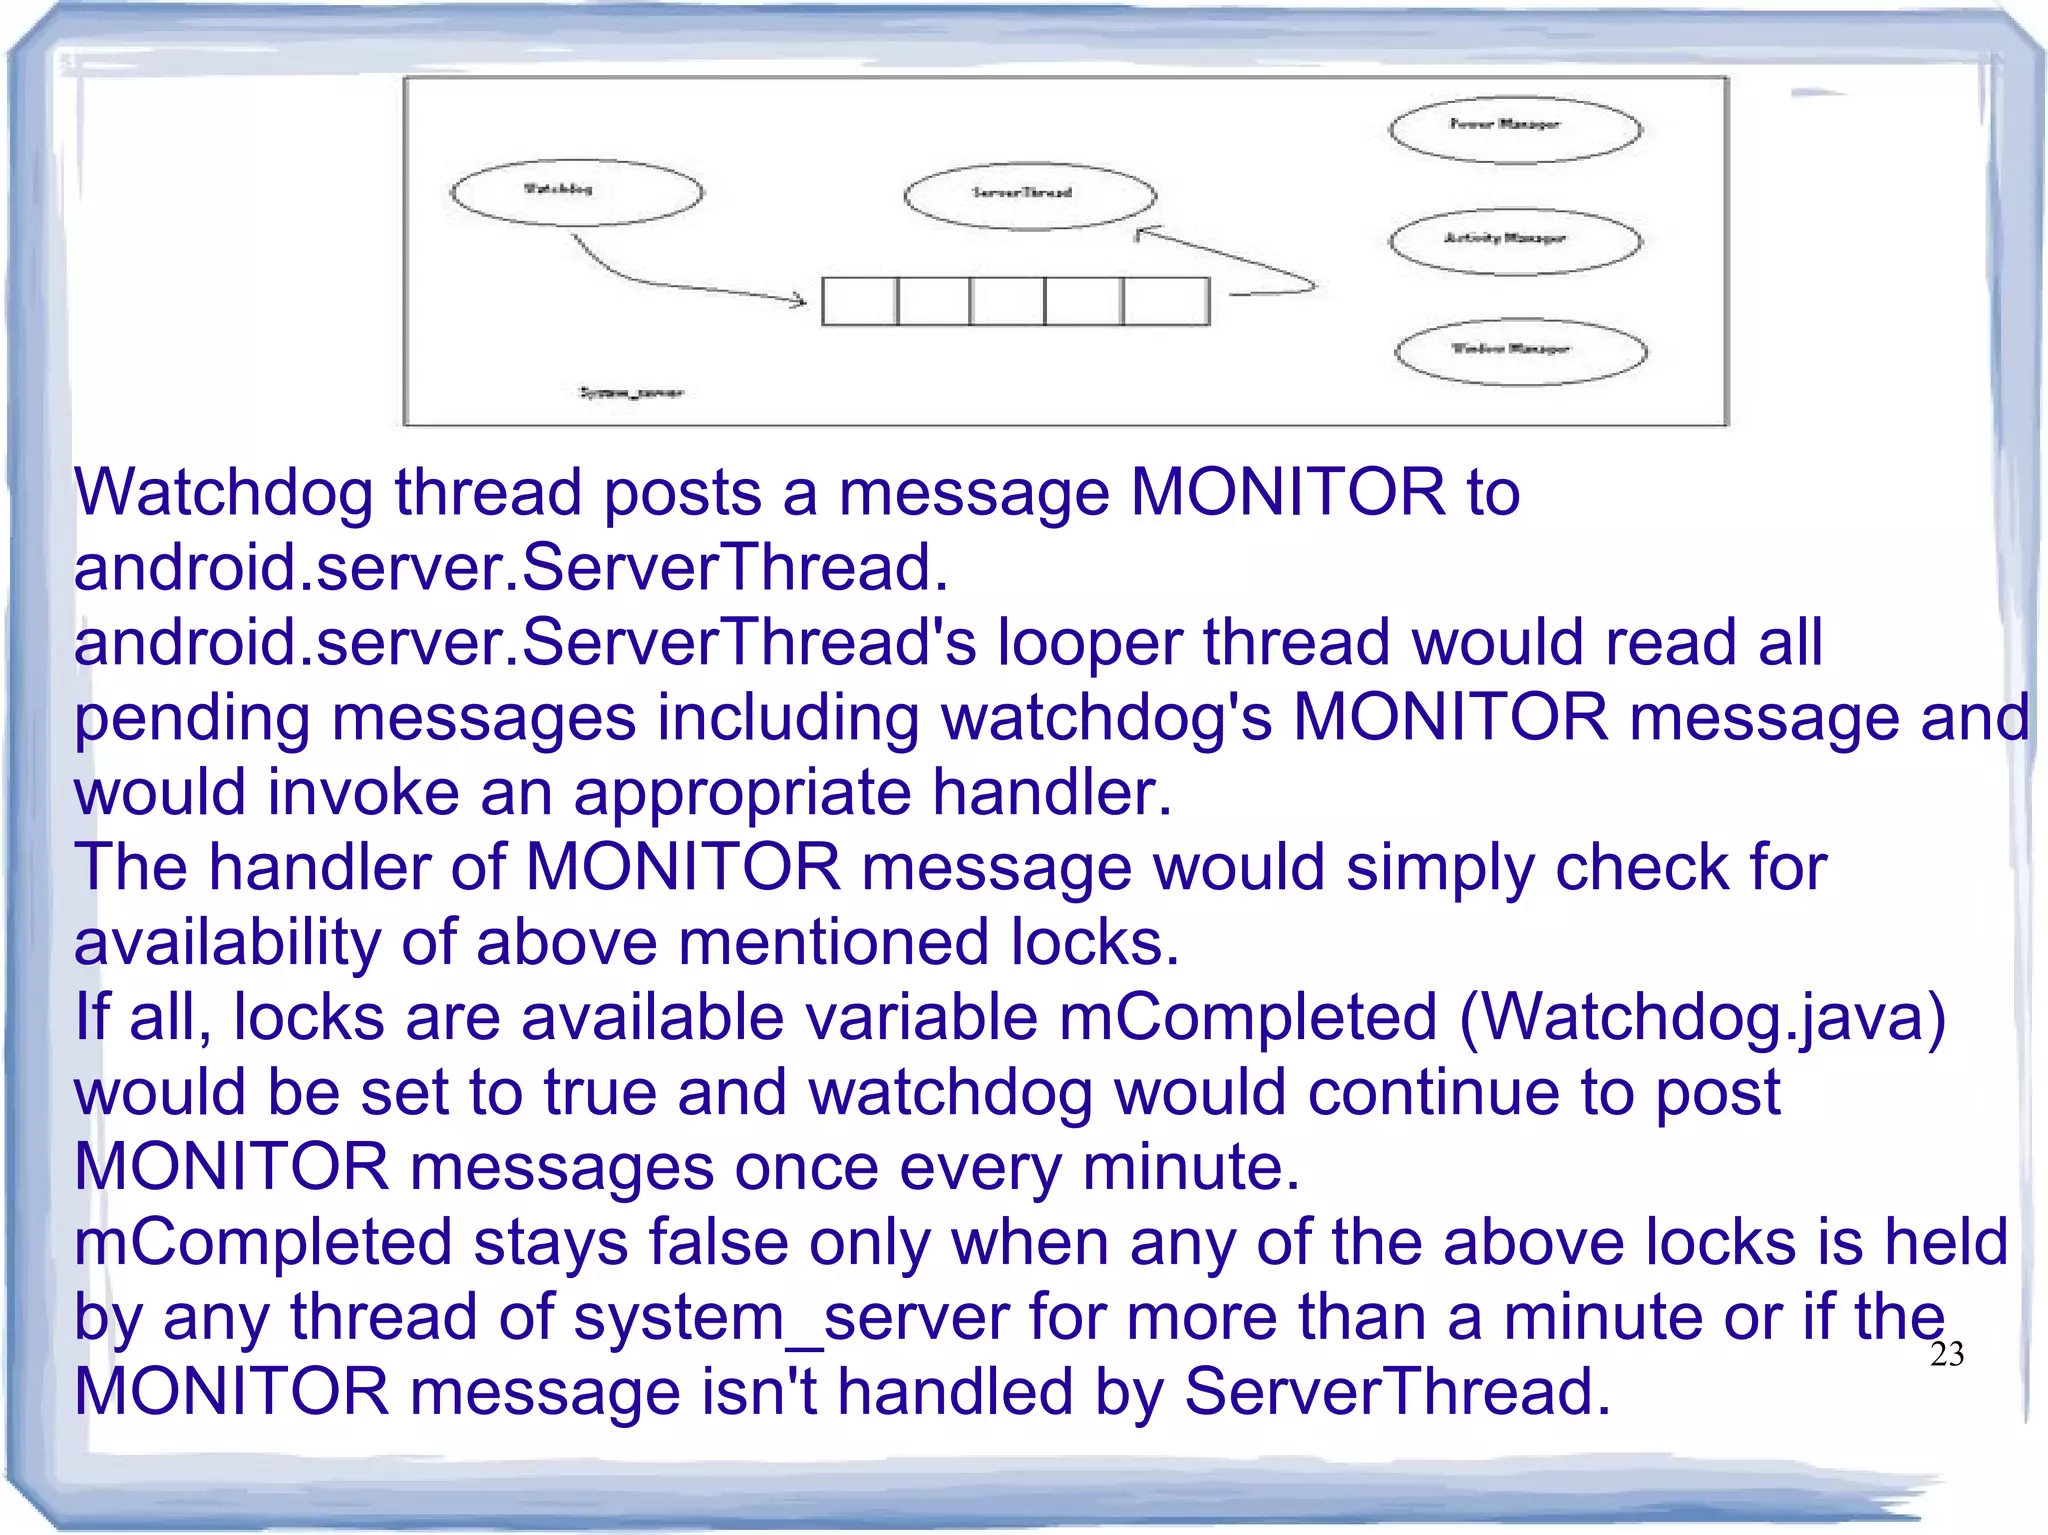
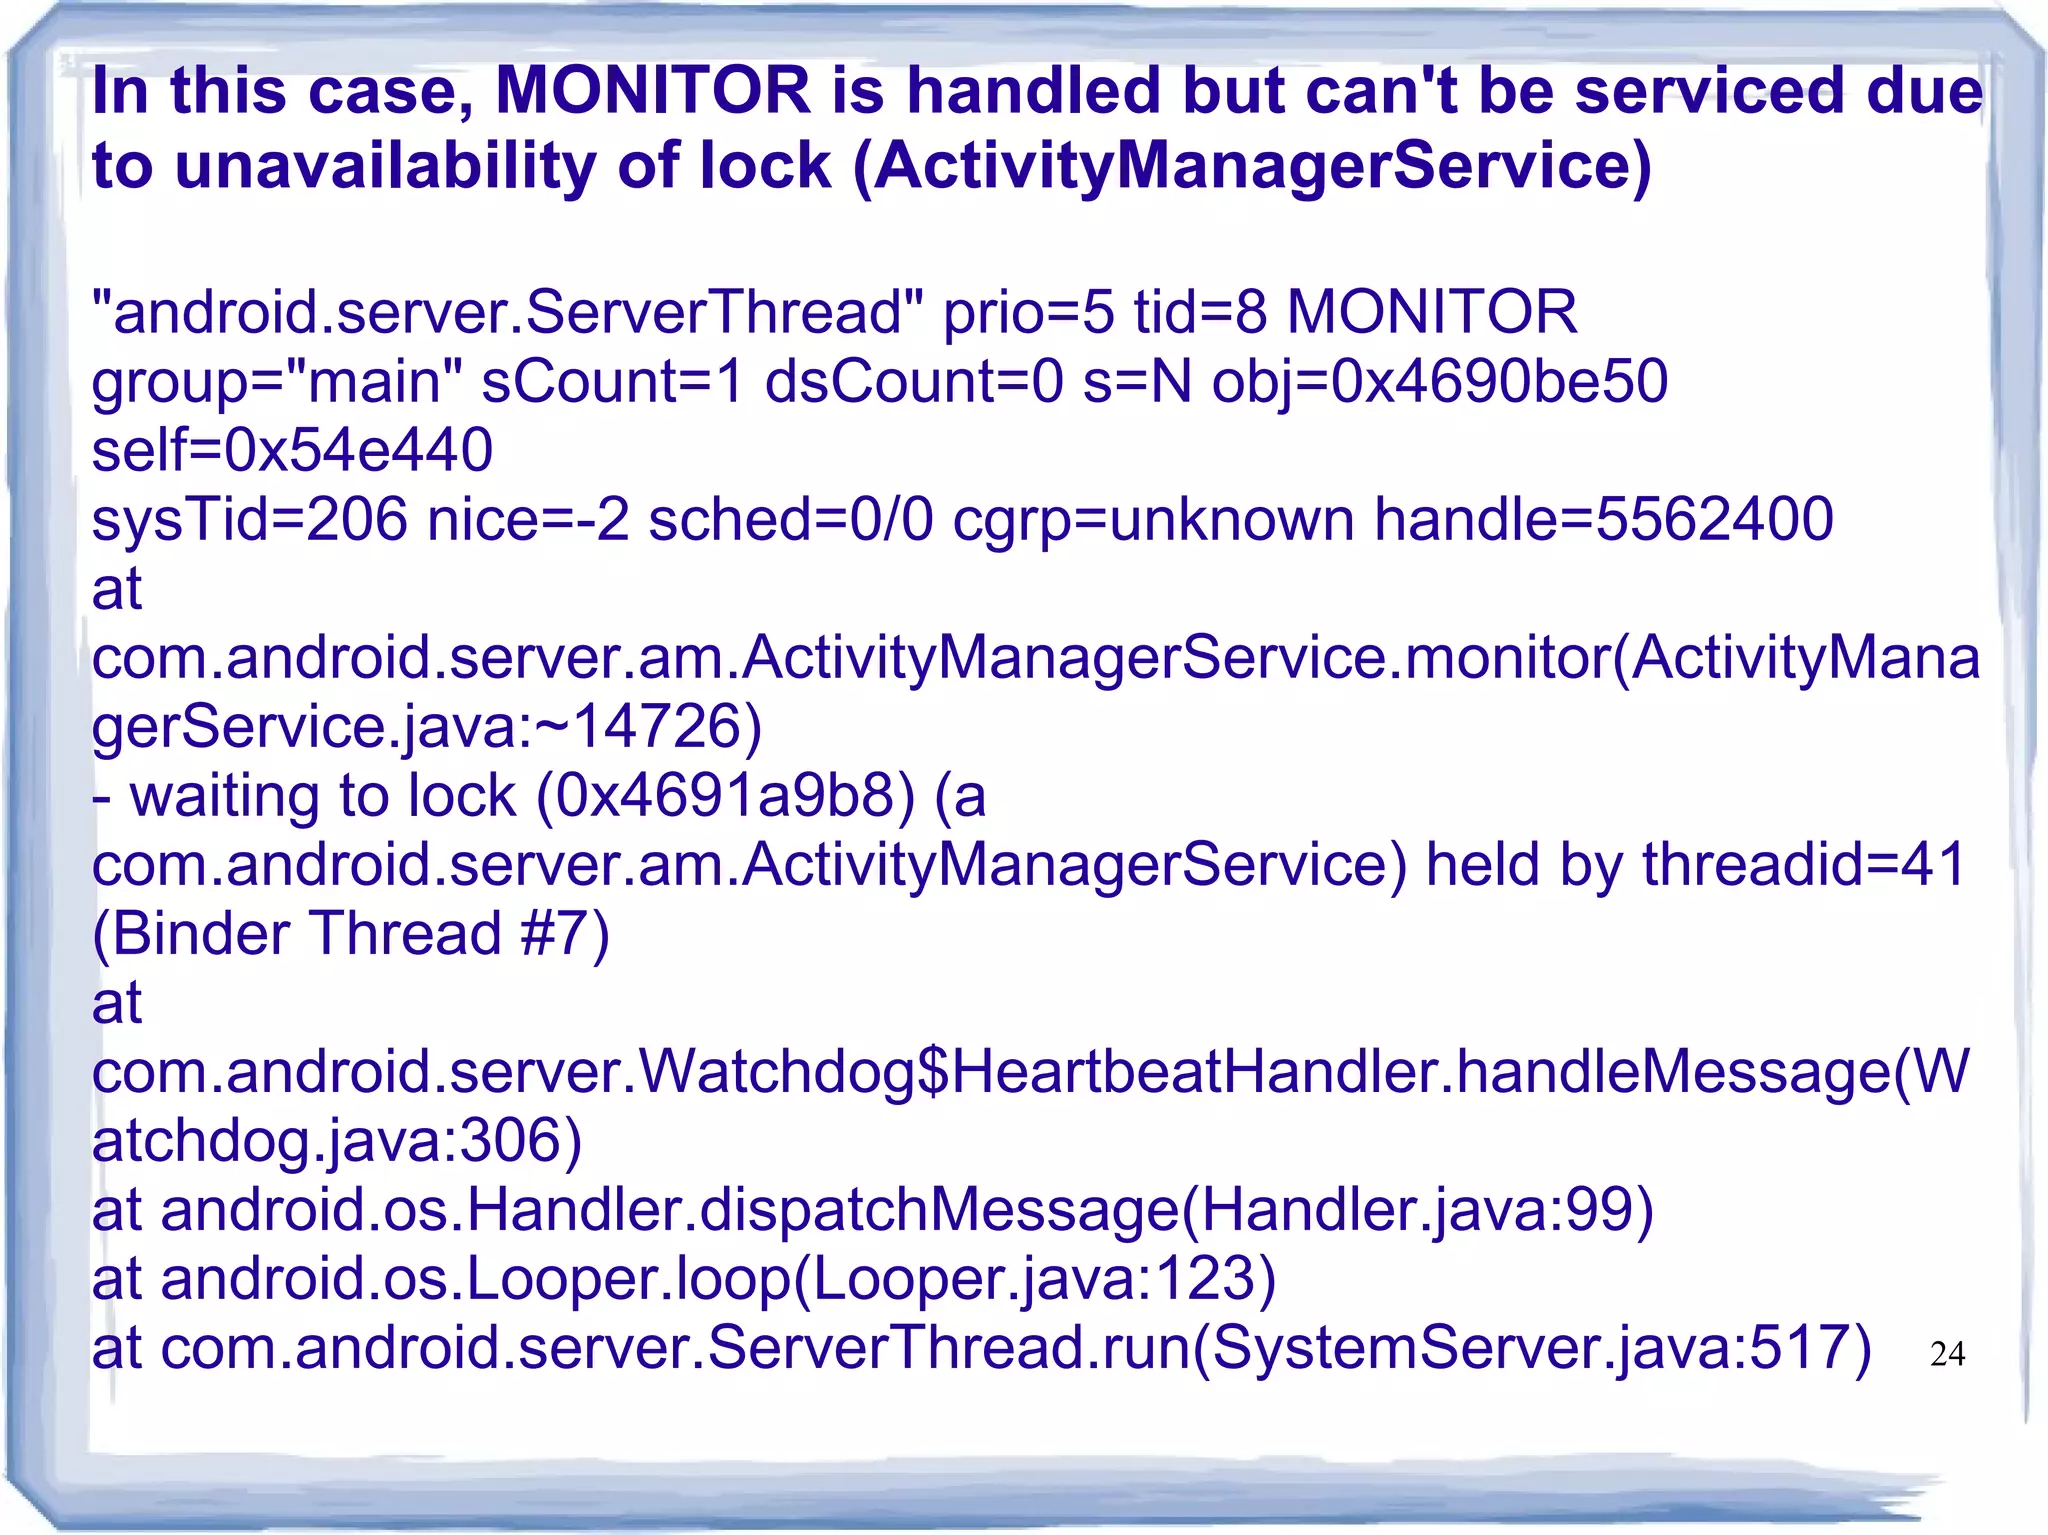

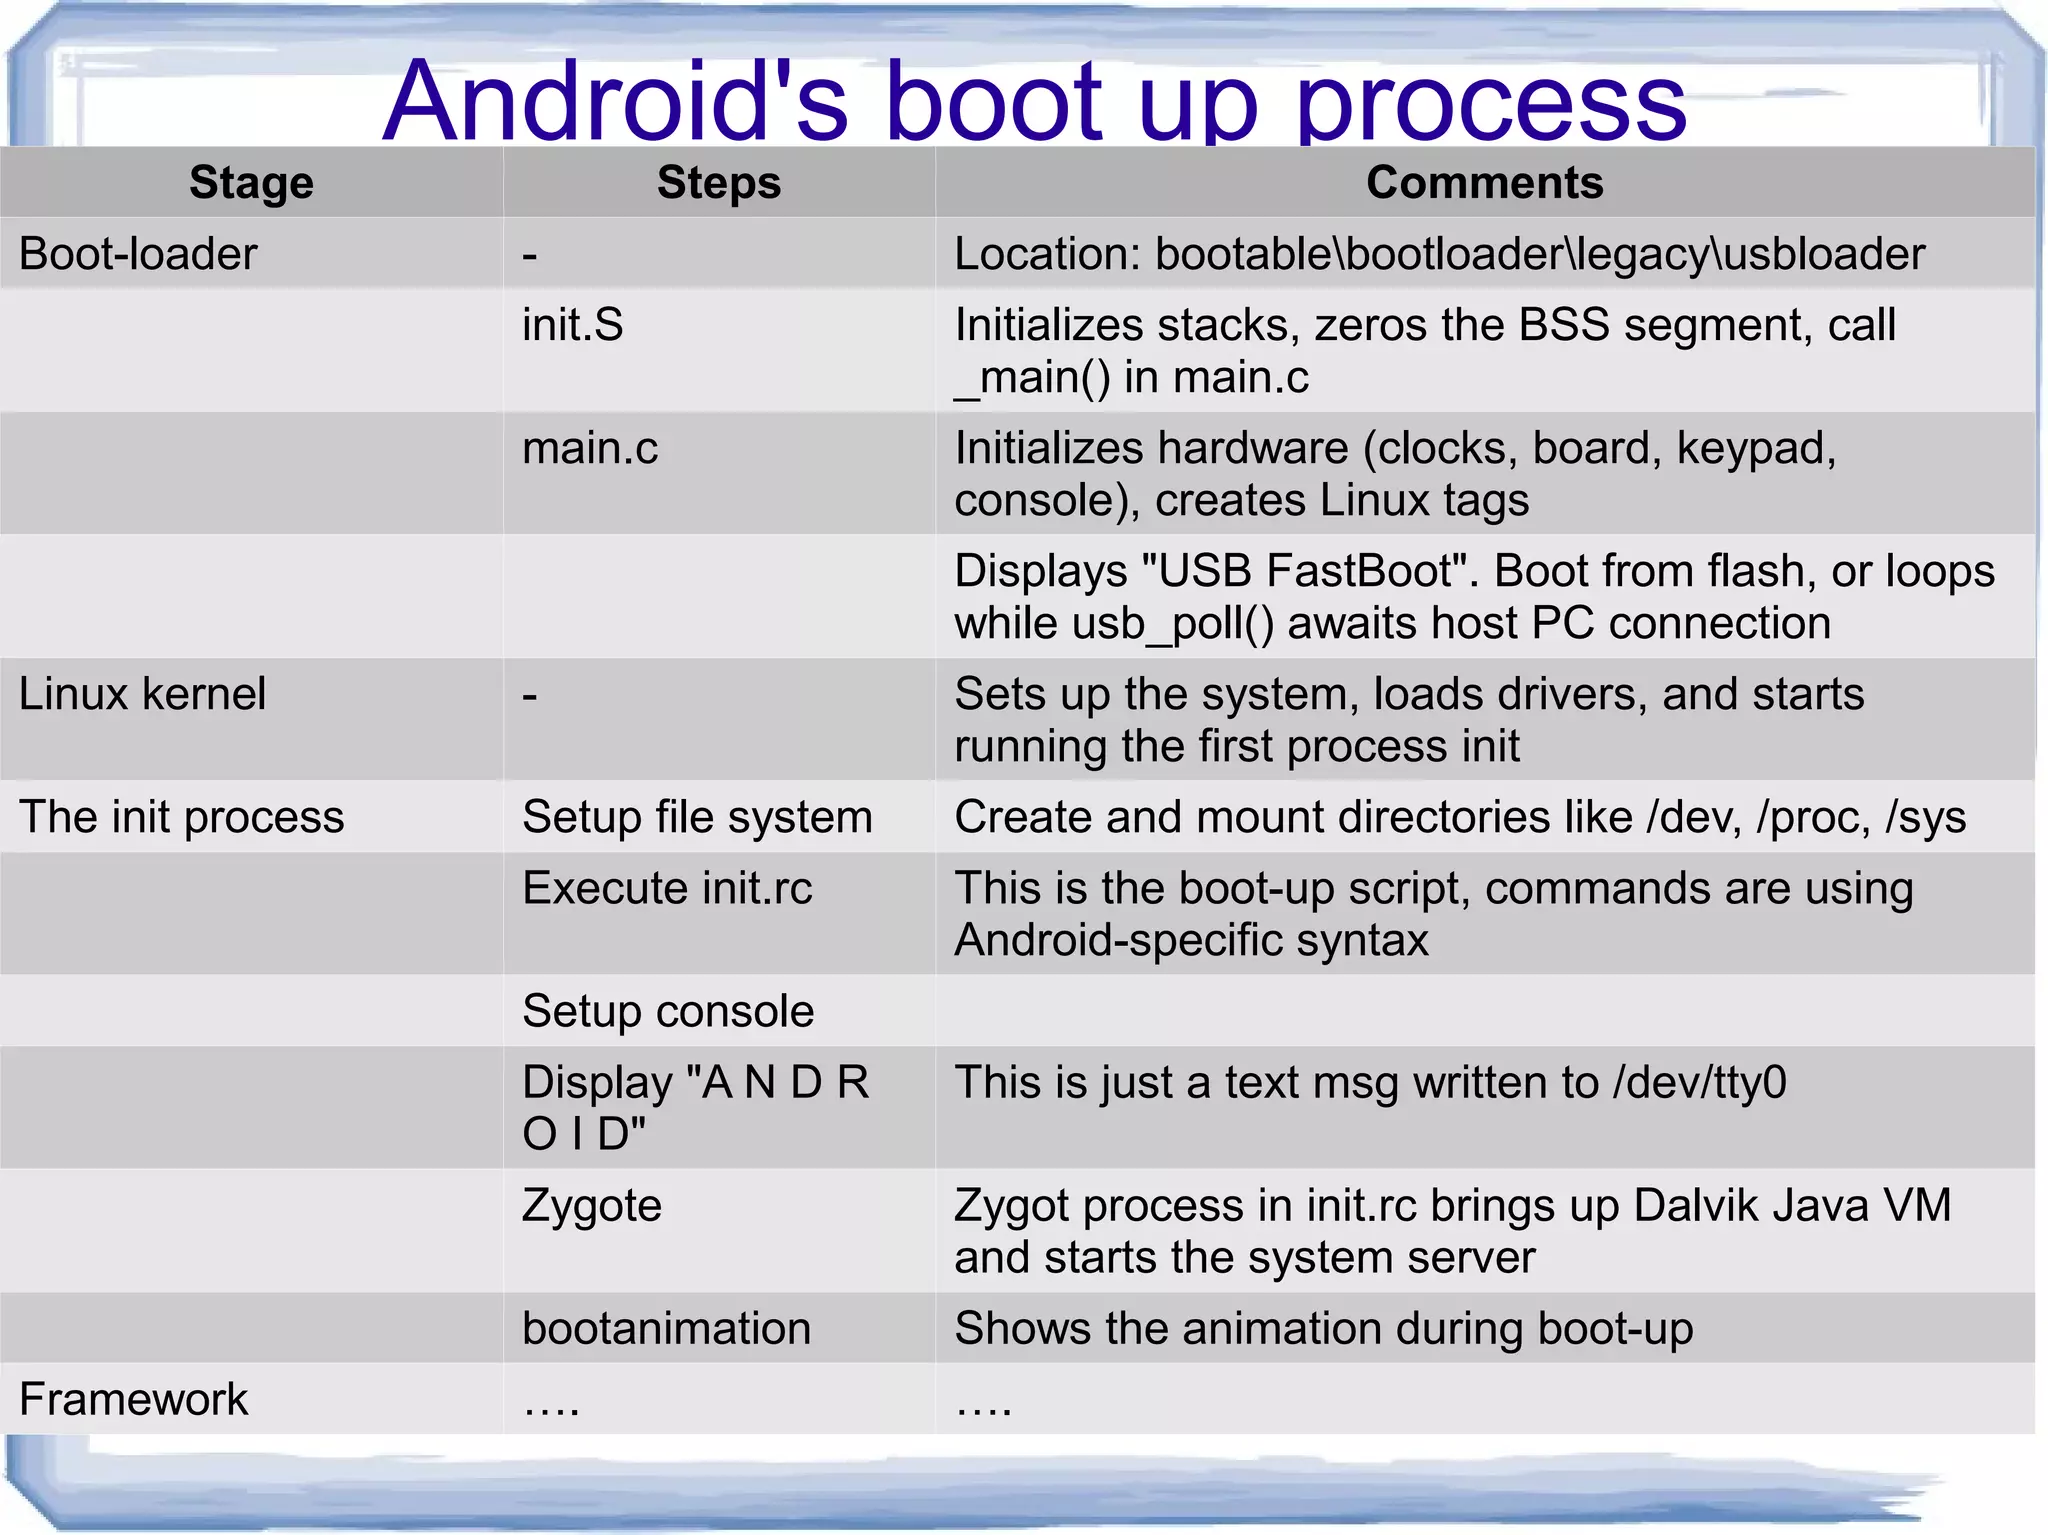
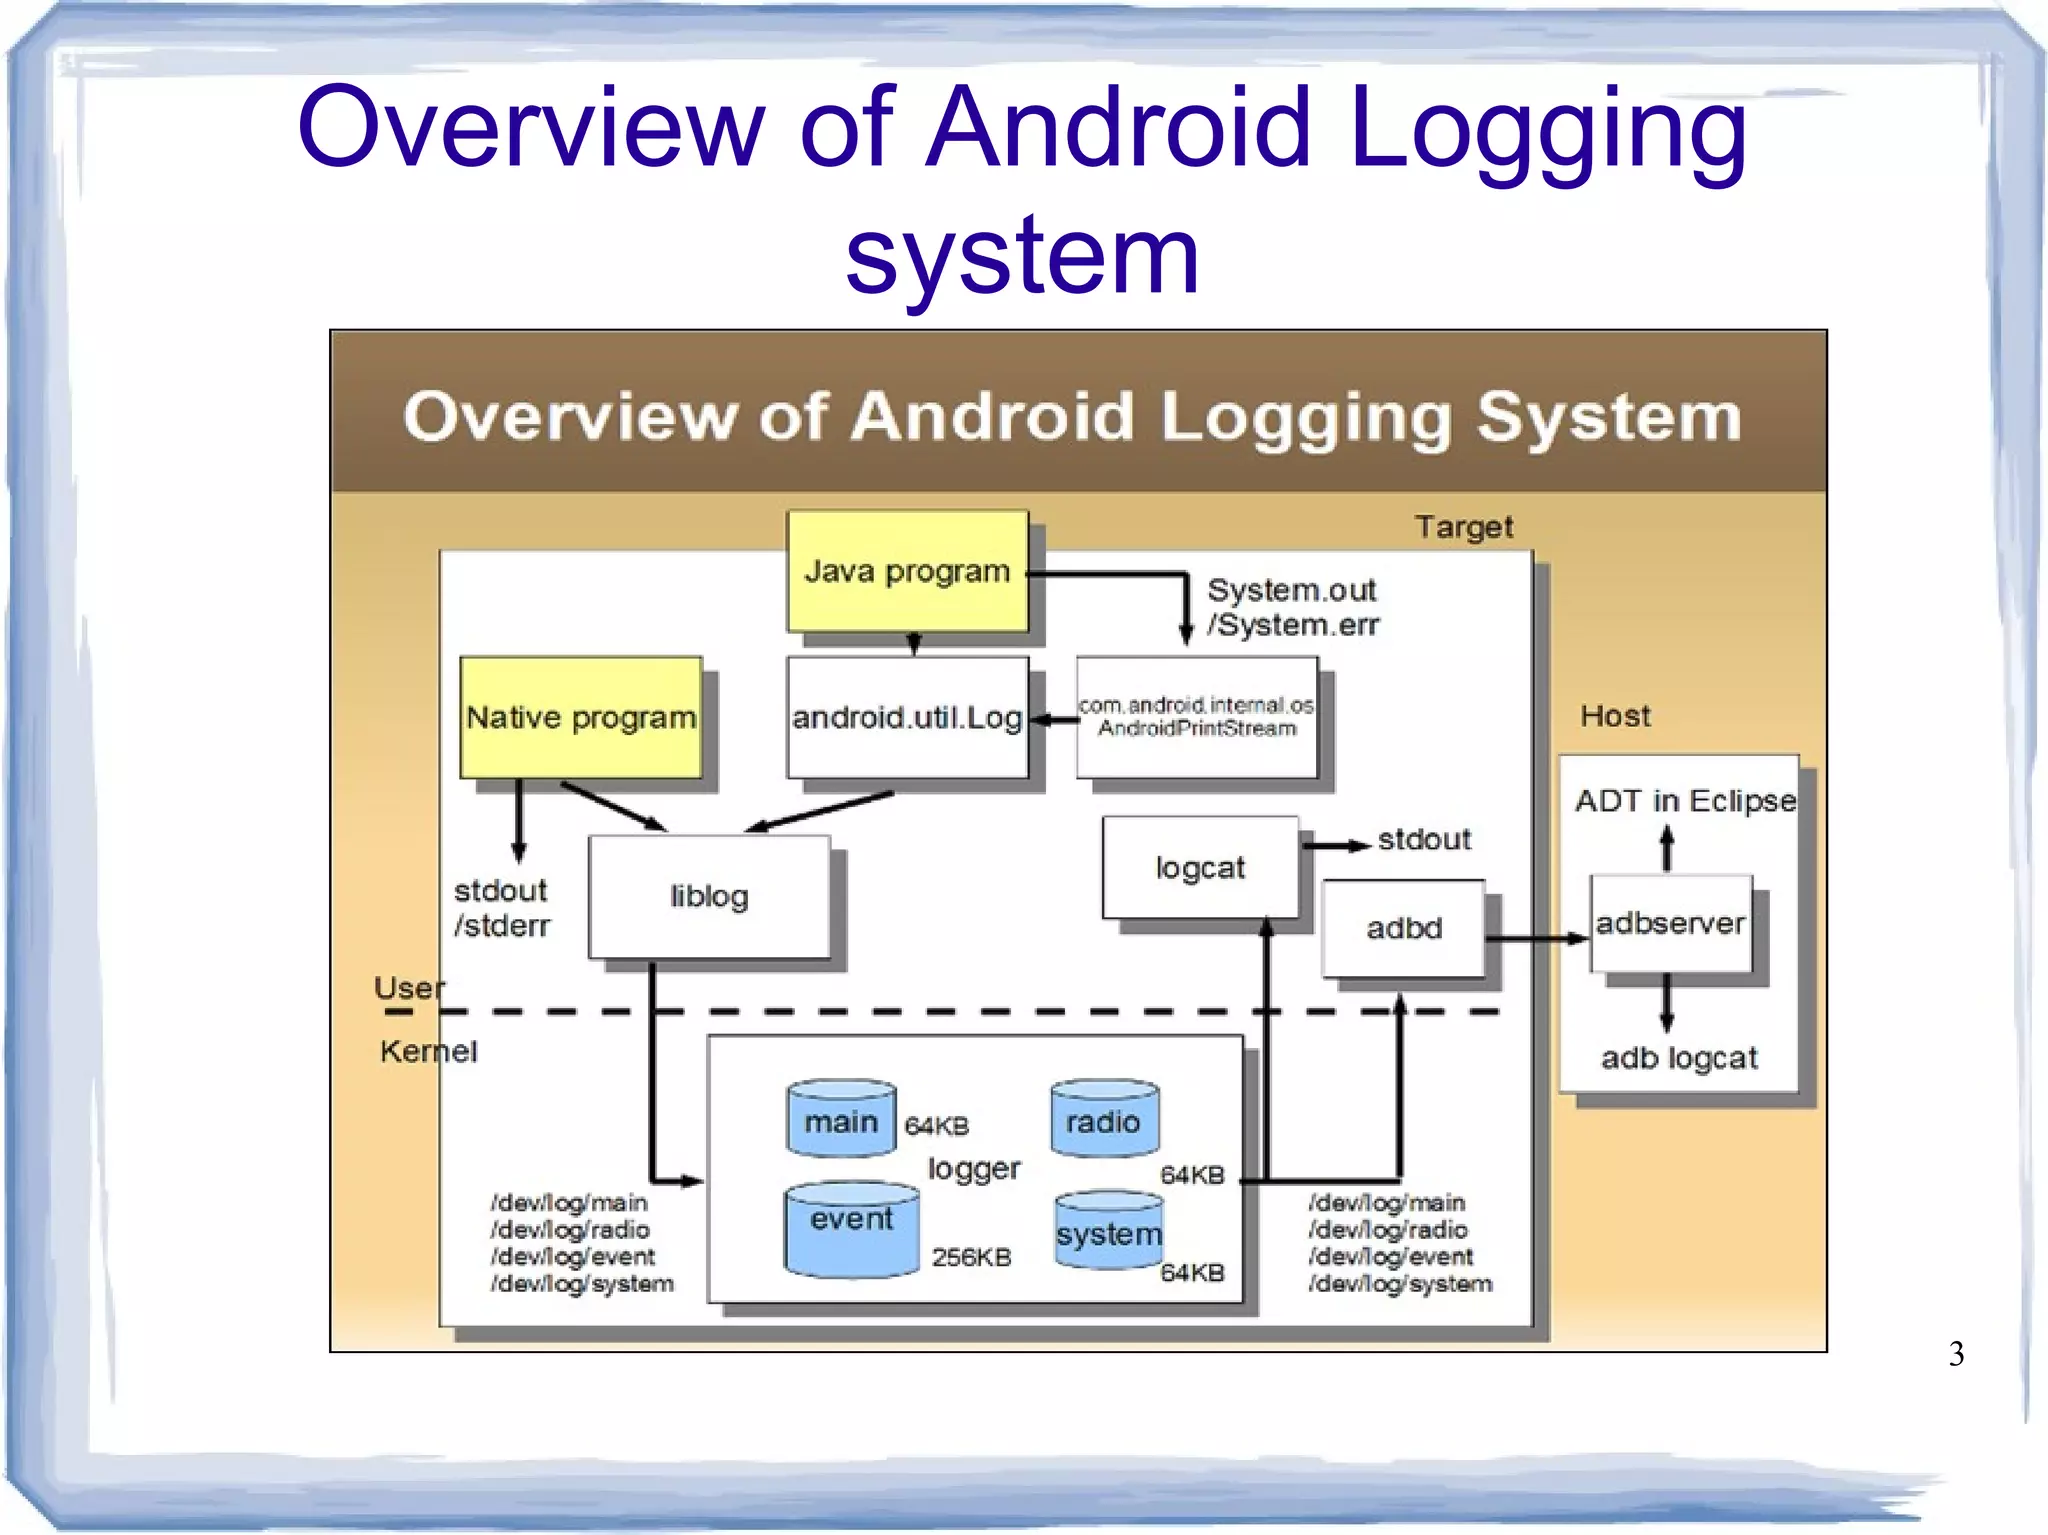
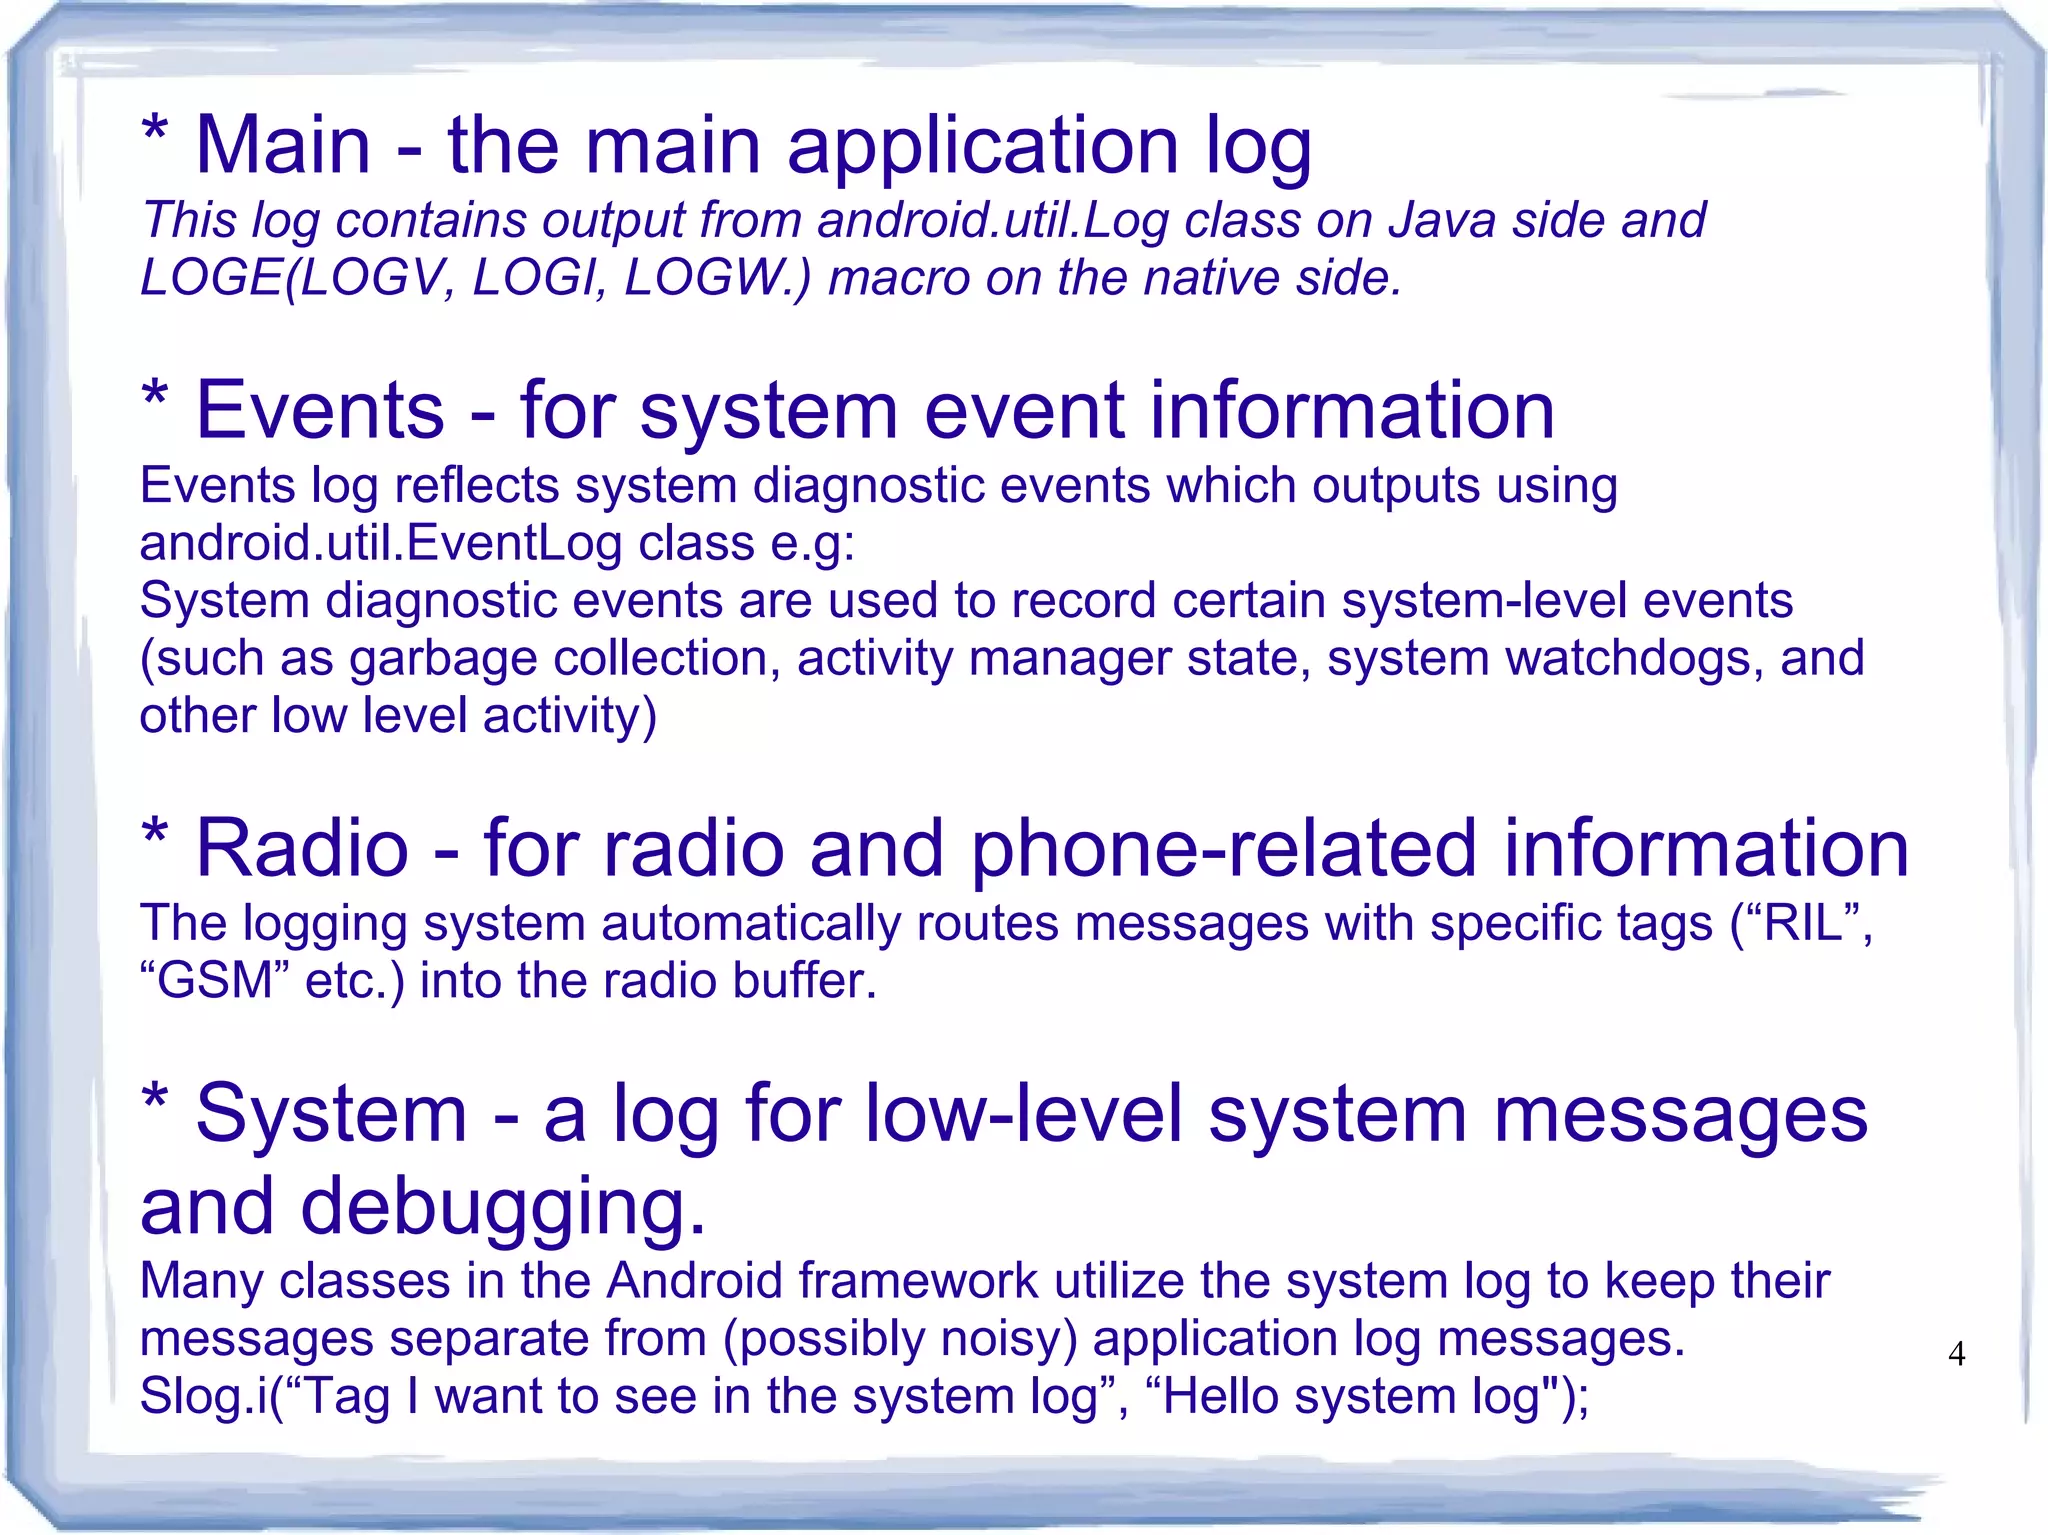
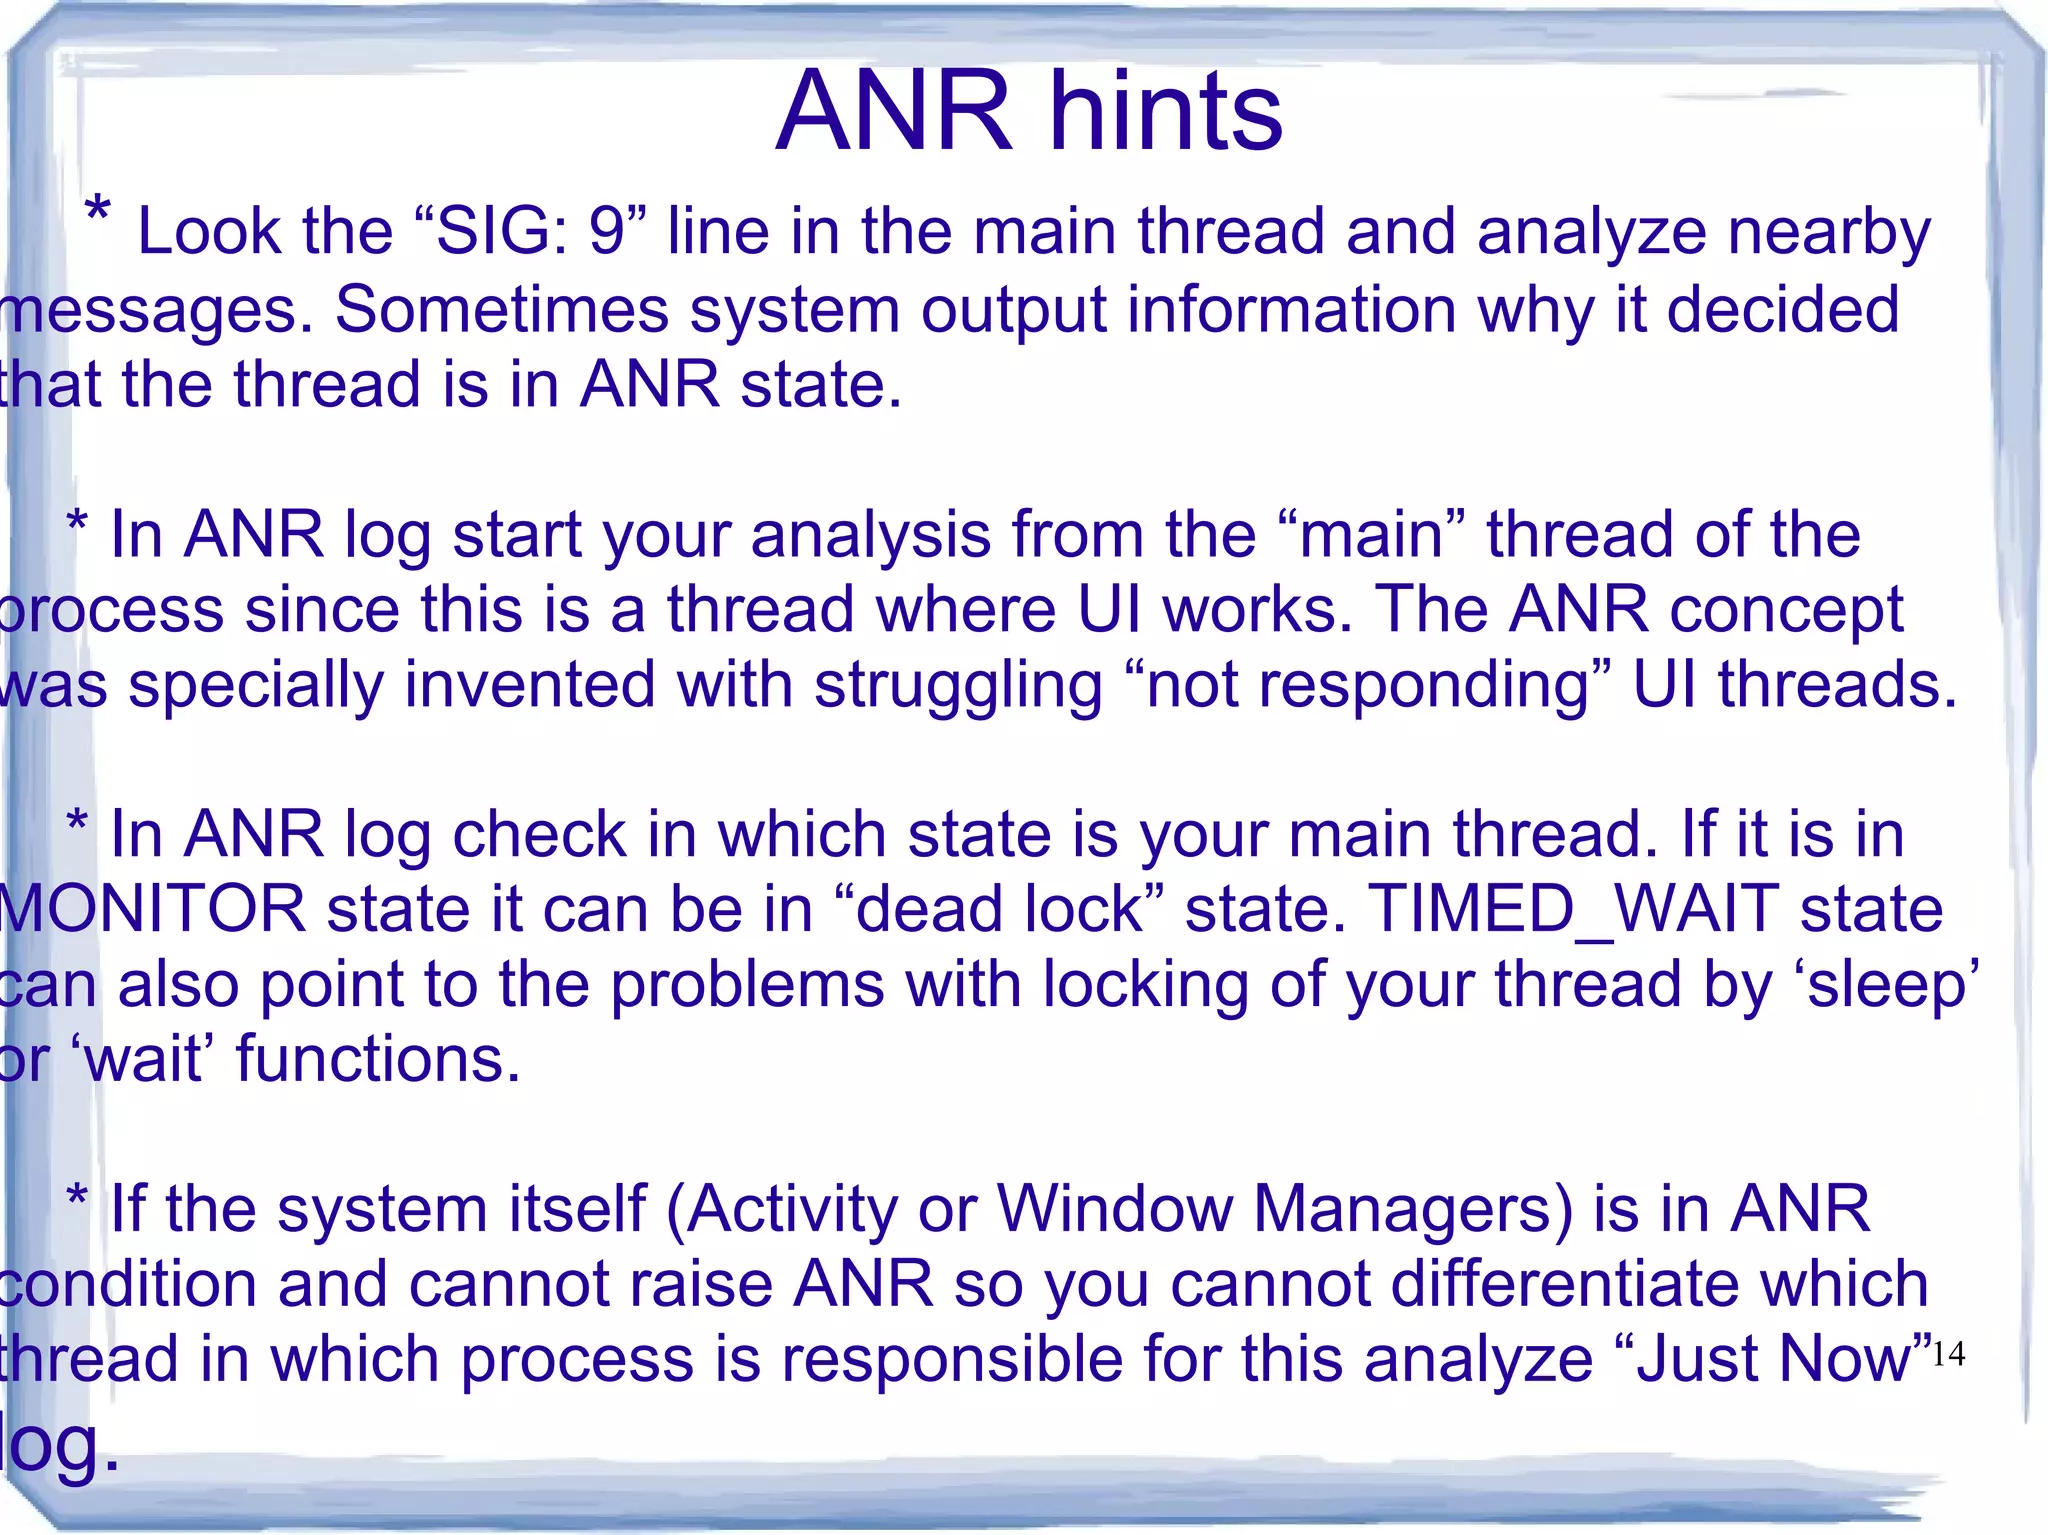
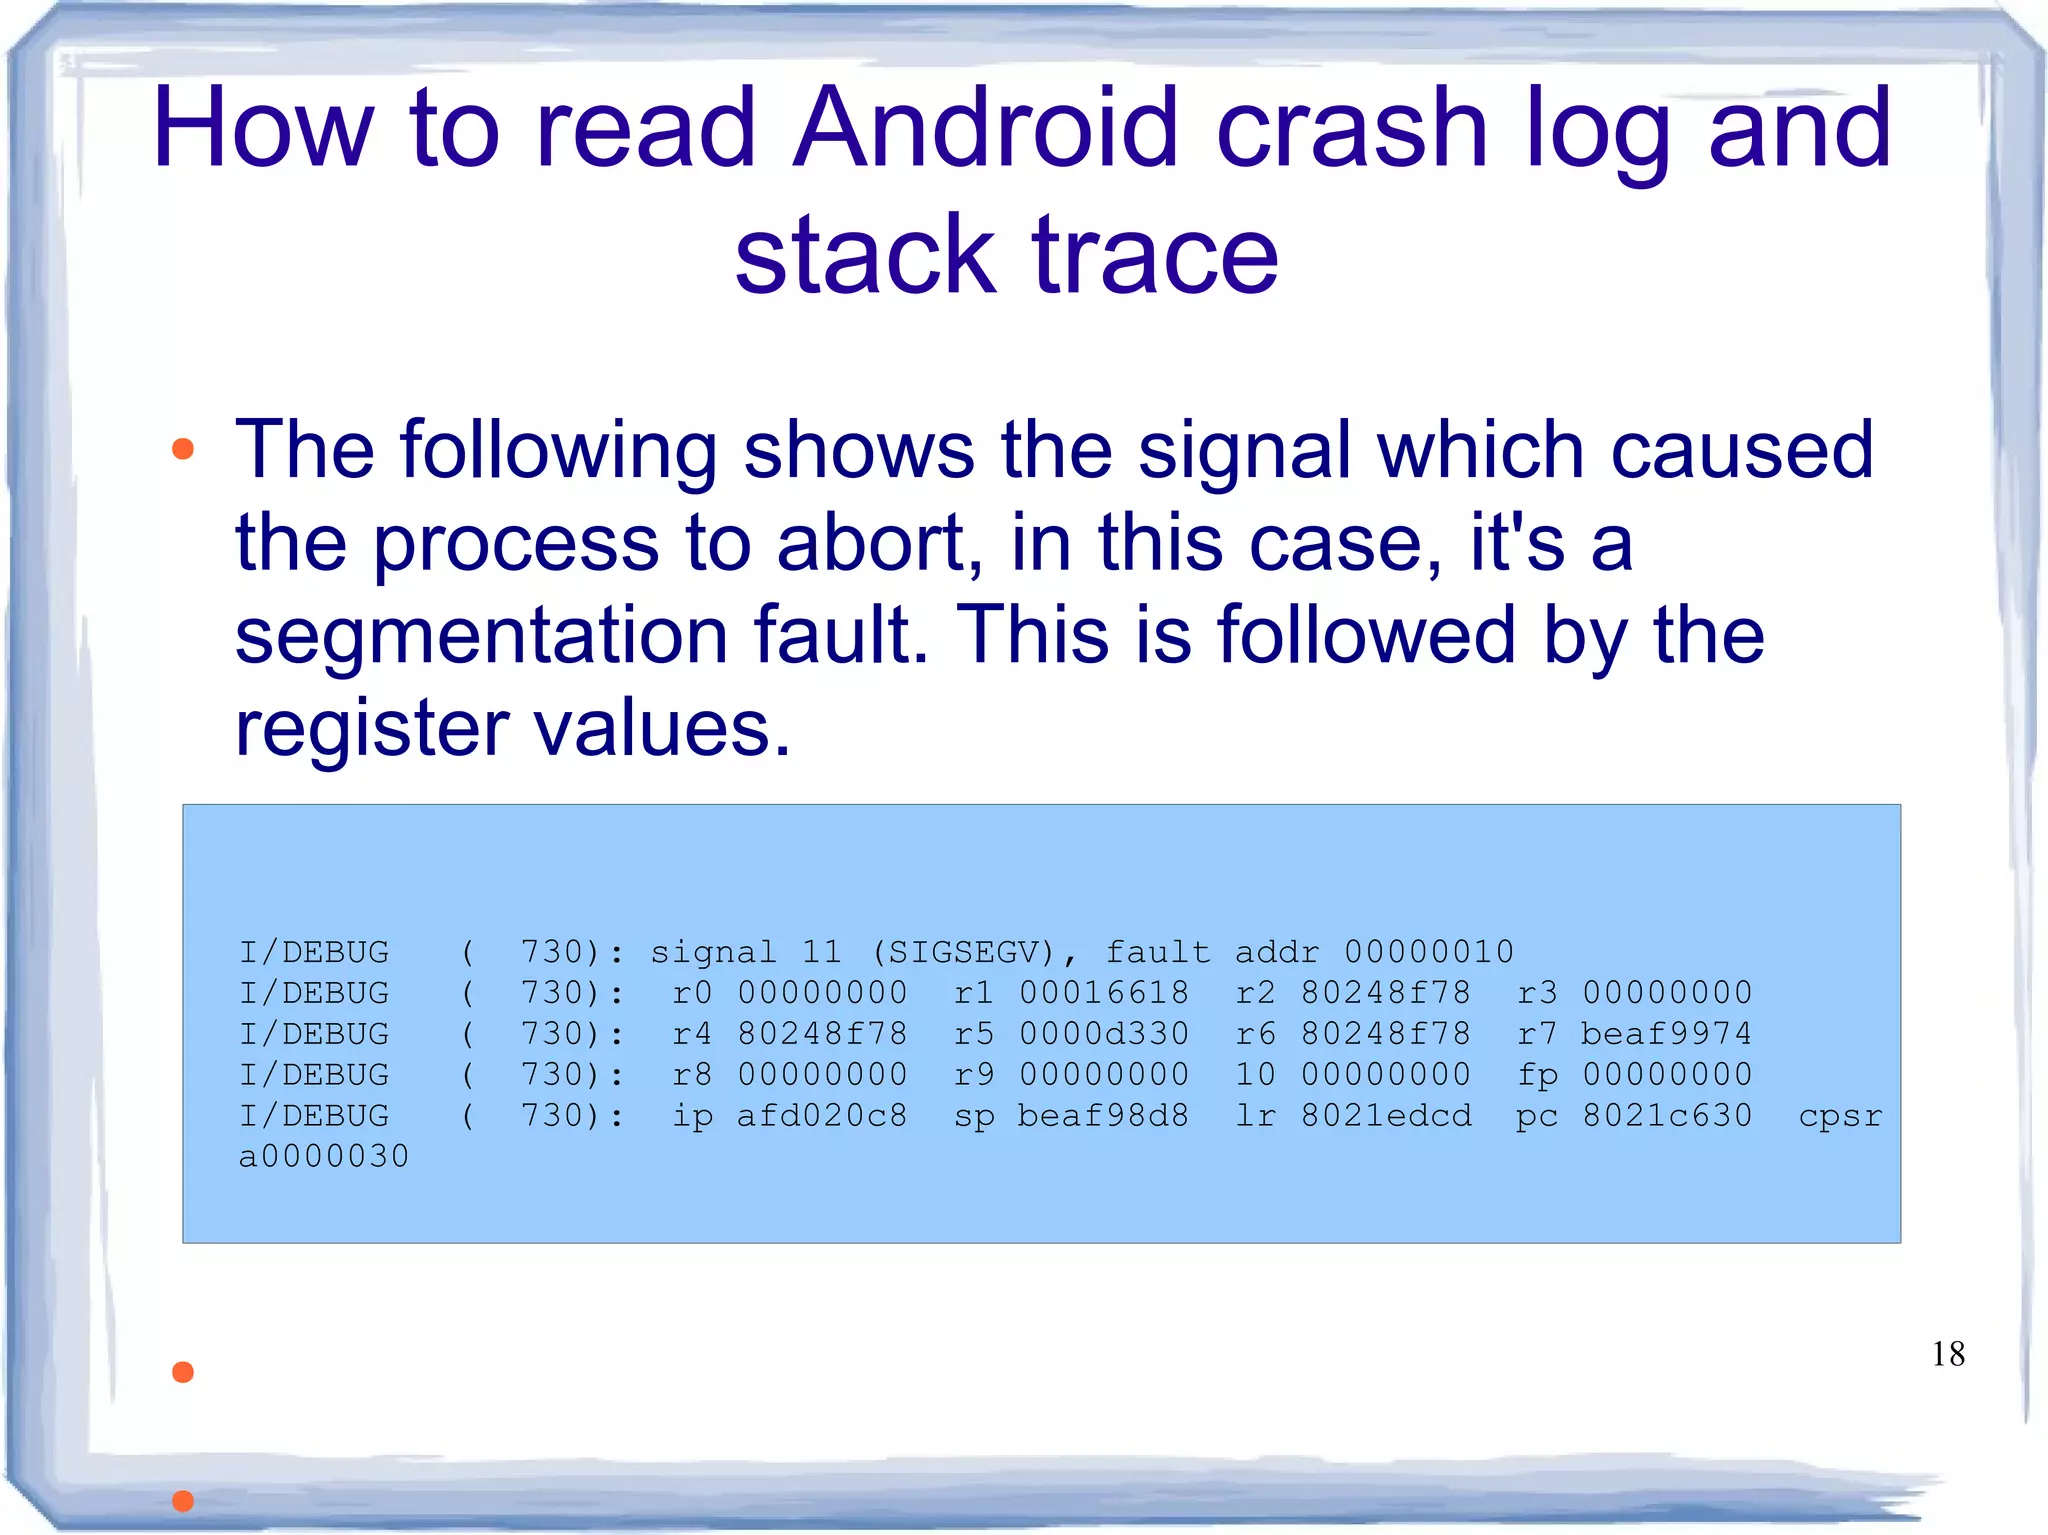
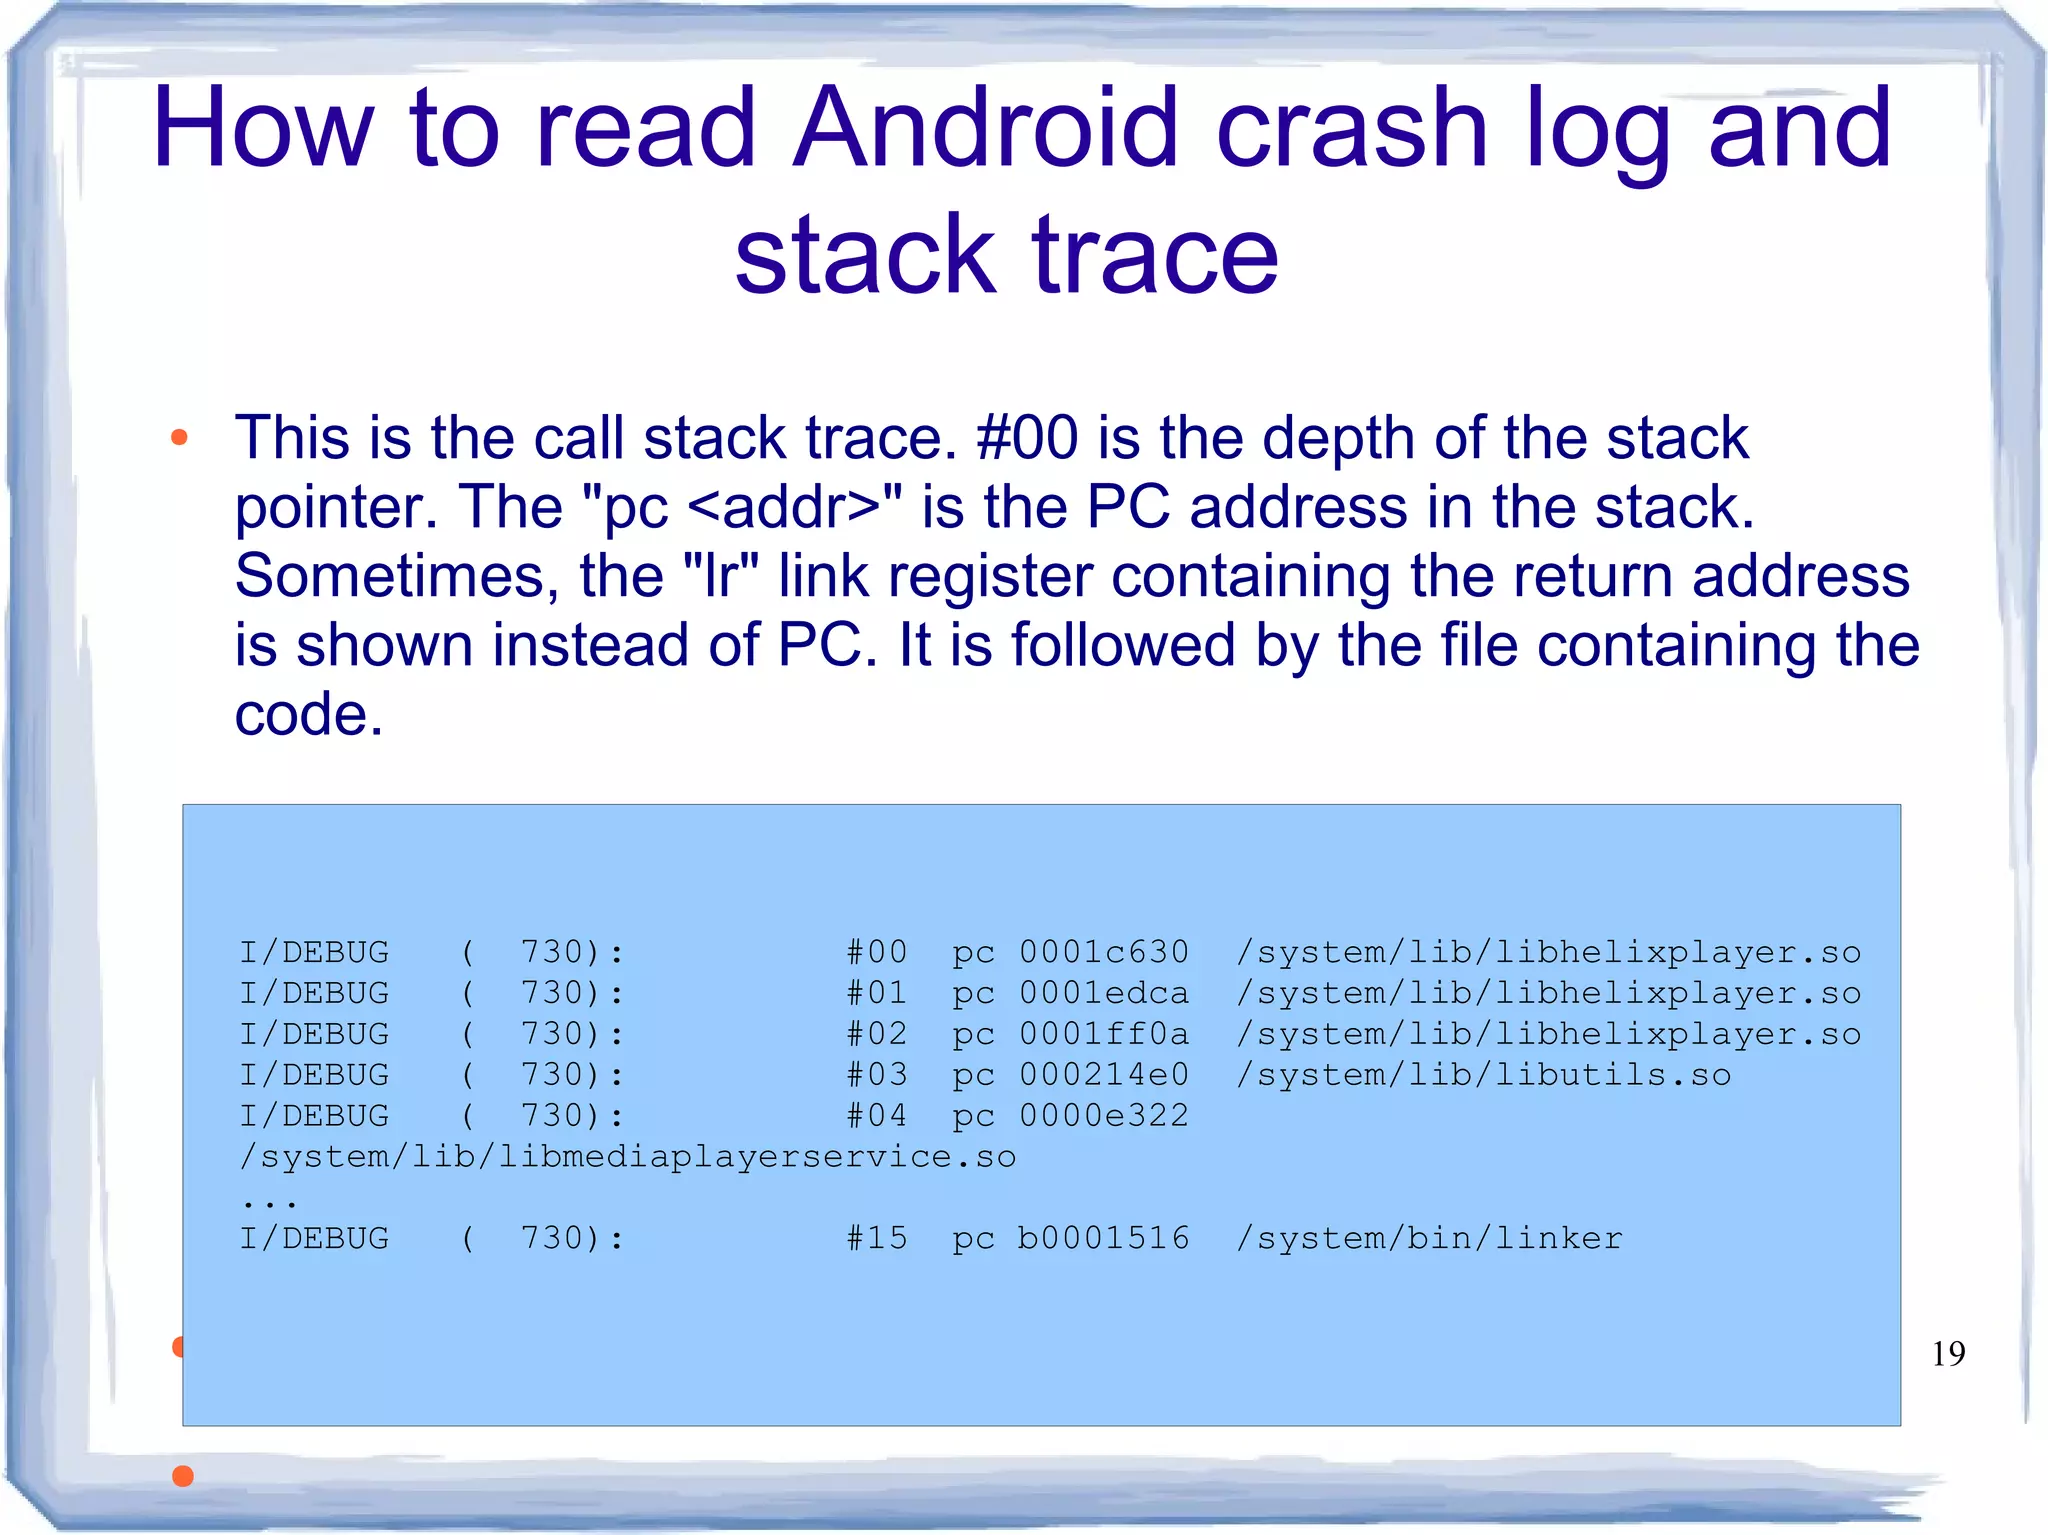
Android provides concise logging and debugging capabilities. The boot process involves initializing hardware and loading drivers in the bootloader and kernel stages. The init process then sets up the file system and executes scripts to start services like the zygote process and boot animation. There are several Android logs including main, events, radio, and system. Tools like dumpsys and dumpstate provide detailed system status information. Native crashes produce a log with the build fingerprint, registers, stack trace, and current stack to aid in debugging.