Download as PDF, PPTX
![How to enable Coredump: In order to enable core dumps, you need to set the core_file system variable either on the command-line or in a relevant server option group in an option file. [mariadb] ... core_file There are some additional details related to using core files on Linux. On some systems there is a limit on the sizes of core files that can be dumped. So you have to disable some of the restrictions. To check the system's current system-wide limit, run ulimit -c for the current limit of the mysqld process specifically: sudo cat /proc/$(pidof mysqld)/limits | grep "core file" If you need to change the core size limit, the method you use depends on how you start mysqld. i.e mysqld using mysqld_safe [mysqld_safe] … core_file_size=unlimited](https://image.slidesharecdn.com/dbopspresentationnewnilnandhan-210429085932/75/Analyze-corefile-and-backtraces-with-GDB-for-Mysql-MariaDB-on-Linux-Nilandan-Joshi-MariaDB-4-2048.jpg)
![- mysqld using systemd sudo tee /etc/systemd/system/mariadb.service.d/limitcore.conf <<EOF [Service] LimitCORE=infinity EOF sudo systemctl daemon-reload If you are using Linux, then it can be helpful to change a few settings to alter where the core files is written and what file name is used. This is done by setting the kernel.core_pattern and kernel.core_uses_pid attributes. By default, core file will be generated in MySQL/MariaDB datadir. If you are using a production system, you probably want to have the core files in a specific directory, not in the data directory. (Because core file size could be very large somewhere in GBs) so for that you can set something like, sudo mkdir /tmp/corefiles sudo chmod 777 /tmp/corefiles sudo echo /tmp/corefiles/core > /proc/sys/kernel/core_pattern sudo echo 1 > /proc/sys/kernel/core_uses_pid Since mysqld executes setuid, you may have to set fs.suid_dumpable=2 to allow core dumps on Linux. sudo echo 2 > /proc/sys/fs/suid_dumpable](https://image.slidesharecdn.com/dbopspresentationnewnilnandhan-210429085932/75/Analyze-corefile-and-backtraces-with-GDB-for-Mysql-MariaDB-on-Linux-Nilandan-Joshi-MariaDB-5-2048.jpg)
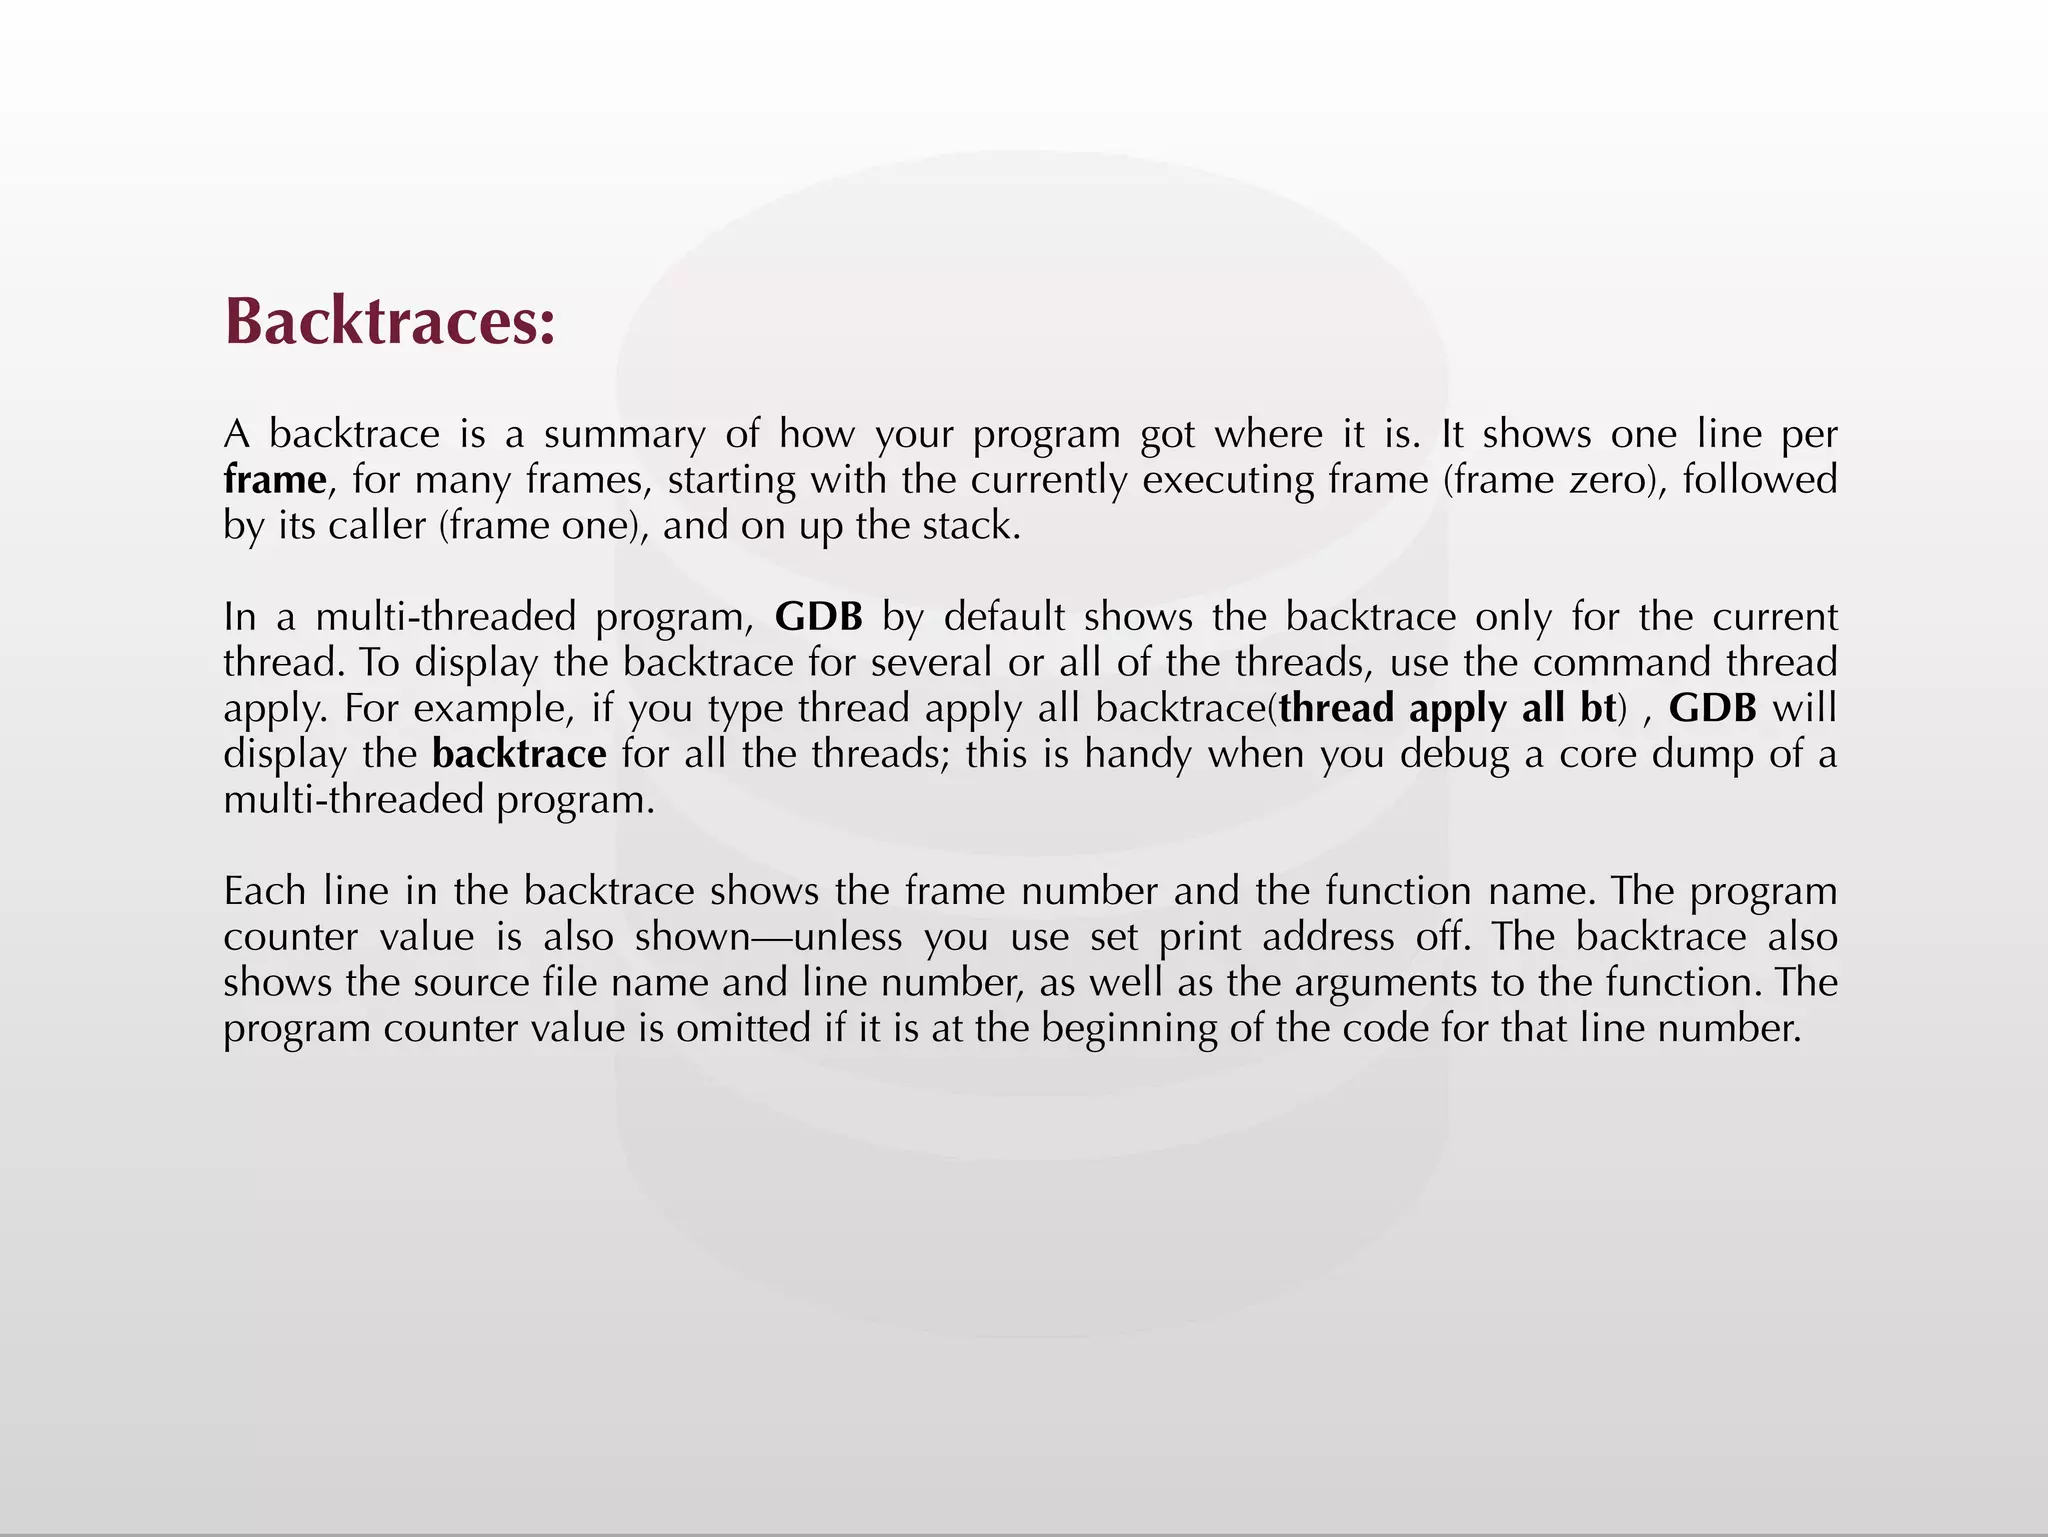
![Other Requirements: 1. GDB need to be installed if it's not already yum install gdb 2. debug info packages needs to be install for server and common atleast. i.e MariaDB-server-debuginfo-10.4.17_10-1.el8.x86_64 MariaDB-common-debuginfo-10.4.17_10-1.el8.x86_64 3. If you can’t run gdb + core dump on customer’s server then you must have the same mysqld/mariadb binaries including debug-info packages + all dynamically linked libraries + core file to run gdb in your local machine. Libraries can be checked by ldd command. i.e [root@nilcentos7 ~]# ldd /usr/sbin/mysqld linux-vdso.so.1 => (0x00007ffea8ddd000) libpthread.so.0 => /lib64/libpthread.so.0 (0x00007f2149b93000) libcrypt.so.1 => /lib64/libcrypt.so.1 (0x00007f214995c000) liblzma.so.5 => /lib64/liblzma.so.5 (0x00007f2149736000) … libcrypto.so.10 => /lib64/libcrypto.so.10 (0x00007f2148810000) libdl.so.2 => /lib64/libdl.so.2 (0x00007f214860c000)](https://image.slidesharecdn.com/dbopspresentationnewnilnandhan-210429085932/75/Analyze-corefile-and-backtraces-with-GDB-for-Mysql-MariaDB-on-Linux-Nilandan-Joshi-MariaDB-7-2048.jpg)
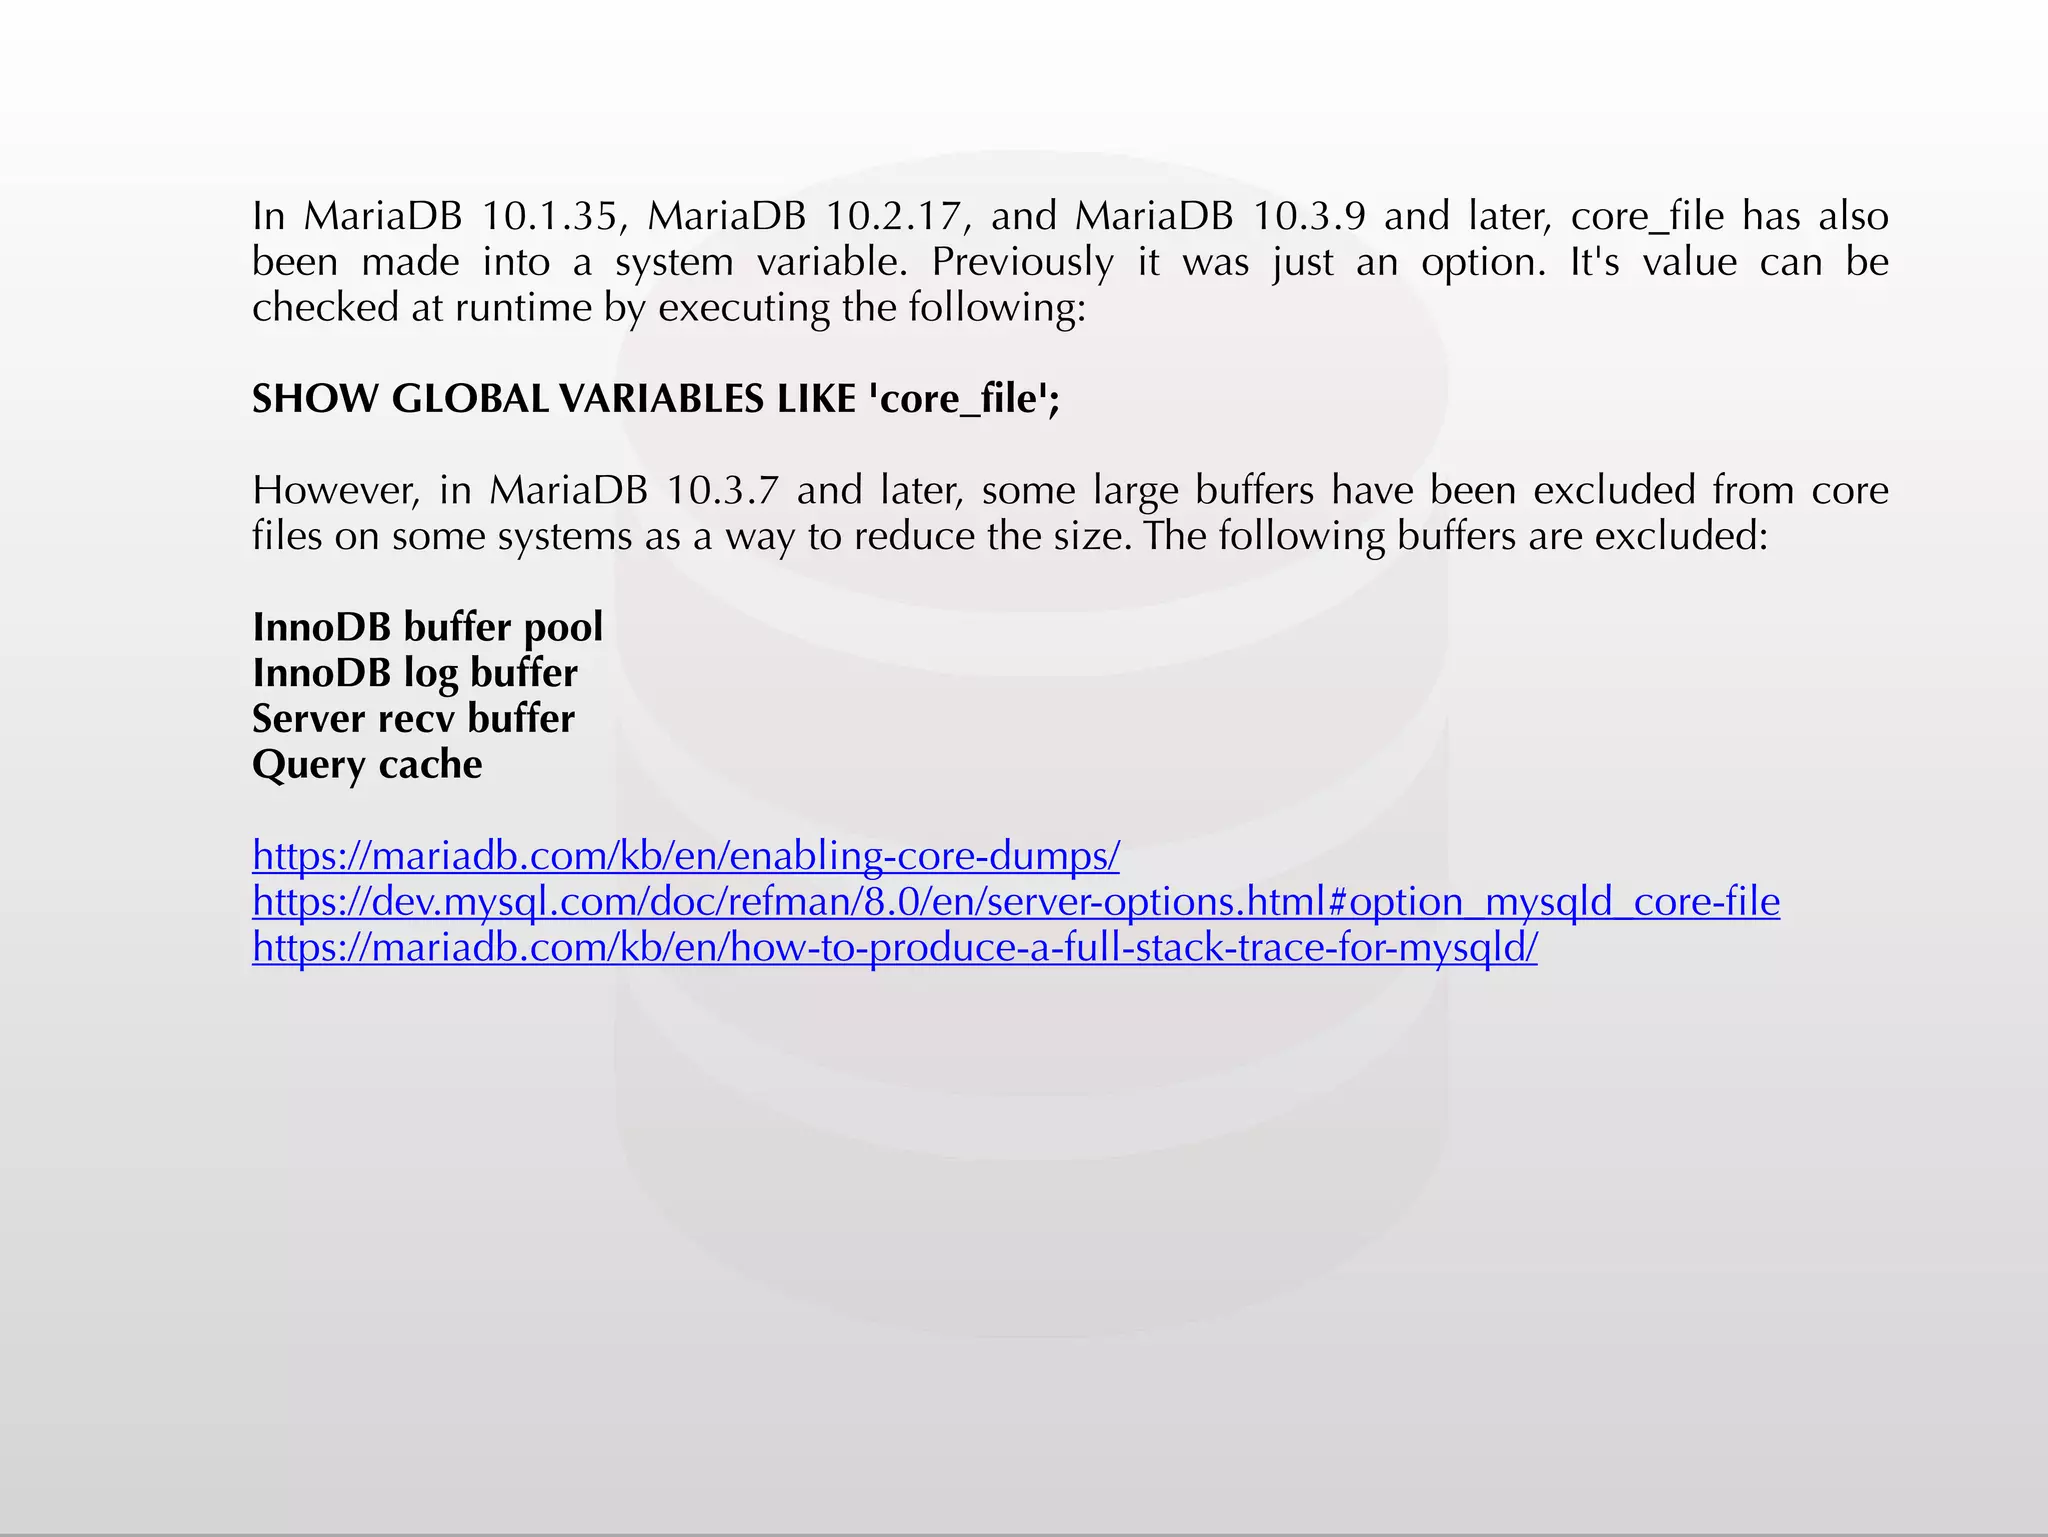
![Problem: 190328 23:31:08 [ERROR] mysqld got signal 6 ; ... Server version: 10.2.23-MariaDB-10.2.23+maria~stretch ... Thread pointer: 0x7ff4d8001f28 Attempting backtrace. You can use the following information to find out where mysqld died. If you see no messages after this, something went terribly wrong... stack_bottom = 0x7ff4dc62ccc8 thread_stack 0x49000 *** buffer overflow detected ***: /usr/sbin/mysqld terminated ======= Backtrace: ========= /lib/x86_64-linux-gnu/libc.so.6(+0x70bfb)[0x7ffa09af5bfb] /lib/x86_64-linux-gnu/libc.so.6(__fortify_fail+0x37)[0x7ffa09b7e437] /lib/x86_64-linux-gnu/libc.so.6(+0xf7570)[0x7ffa09b7c570] /lib/x86_64-linux-gnu/libc.so.6(+0xf93aa)[0x7ffa09b7e3aa] /usr/sbin/mysqld(my_addr_resolve+0xe2)[0x55ca42284922] … /usr/sbin/mysqld(_Z12write_recordP3THDP5TABLEP12st_copy_info+0x72) [0x55ca41b4b992] /usr/sbin/ mysqld(_Z12mysql_insertP3THDP10TABLE_LISTR4ListI4ItemERS3_IS5_ES6_S6_15 enum_duplicatesb+0x1206)[0x55ca41b560f6] /usr/sbin/mysqld(_Z21mysql_execute_commandP3THD+0x3f68)[0x55ca41b6bee8] /usr/sbin/mysqld(_Z11mysql_parseP3THDPcjP12Parser_statebb+0x28a) [0x55ca41b70e4a] /usr/sbin/mysqld(+0x4c864f)[0x55ca41b7164f] ...](https://image.slidesharecdn.com/dbopspresentationnewnilnandhan-210429085932/75/Analyze-corefile-and-backtraces-with-GDB-for-Mysql-MariaDB-on-Linux-Nilandan-Joshi-MariaDB-8-2048.jpg)
![Problem: 2021-02-12 8:39:33 11039259 [ERROR] mysqld: Table '(temporary)' is marked as crashed and should be repaired 2021-02-12 8:41:09 10757048 [ERROR] mysqld: Table '(temporary)' is marked as crashed and should be repaired free(): invalid next size (normal) 210212 8:41:09 [ERROR] mysqld got signal 6 ; ... Server version: 10.4.17-10-MariaDB-enterprise-log ... Thread pointer: 0x7f179d1103c8 Attempting backtrace. You can use the following information to find out where mysqld died. If you see no messages after this, something went terribly wrong... stack_bottom = 0x7f0a020edbe8 thread_stack 0x49000](https://image.slidesharecdn.com/dbopspresentationnewnilnandhan-210429085932/75/Analyze-corefile-and-backtraces-with-GDB-for-Mysql-MariaDB-on-Linux-Nilandan-Joshi-MariaDB-9-2048.jpg)
![[root@centos8 nil]# gdb mysqld core.2751610 GNU gdb (GDB) Red Hat Enterprise Linux 8.2-12.el8 Copyright (C) 2018 Free Software Foundation, Inc. License GPLv3+: GNU GPL version 3 or later <http://gnu.org/licenses/ gpl.html> … Type "apropos word" to search for commands related to "word"... Reading symbols from mysqld...Reading symbols from /usr/lib/debug/ usr/sbin/mysqld-10.4.17_10-1.el8.x86_64.debug...done. done. [New LWP 2338279] [New LWP 2751610] … … Use the "info sharedlibrary" command to see the complete listing. Do you need "set solib-search-path" or "set sysroot"? [Thread debugging using libthread_db enabled] Using host libthread_db library "/lib64/libthread_db.so.1". … Core was generated by `/usr/sbin/mysqld'. Program terminated with signal SIGSEGV, Segmentation fault. #0 0x00007f1908650de3 in __memmove_avx_unaligned_erms () from / lib64/libc.so.6 [Current thread is 1 (Thread 0x7f0b74ee2700 (LWP 2338279))]](https://image.slidesharecdn.com/dbopspresentationnewnilnandhan-210429085932/75/Analyze-corefile-and-backtraces-with-GDB-for-Mysql-MariaDB-on-Linux-Nilandan-Joshi-MariaDB-10-2048.jpg)
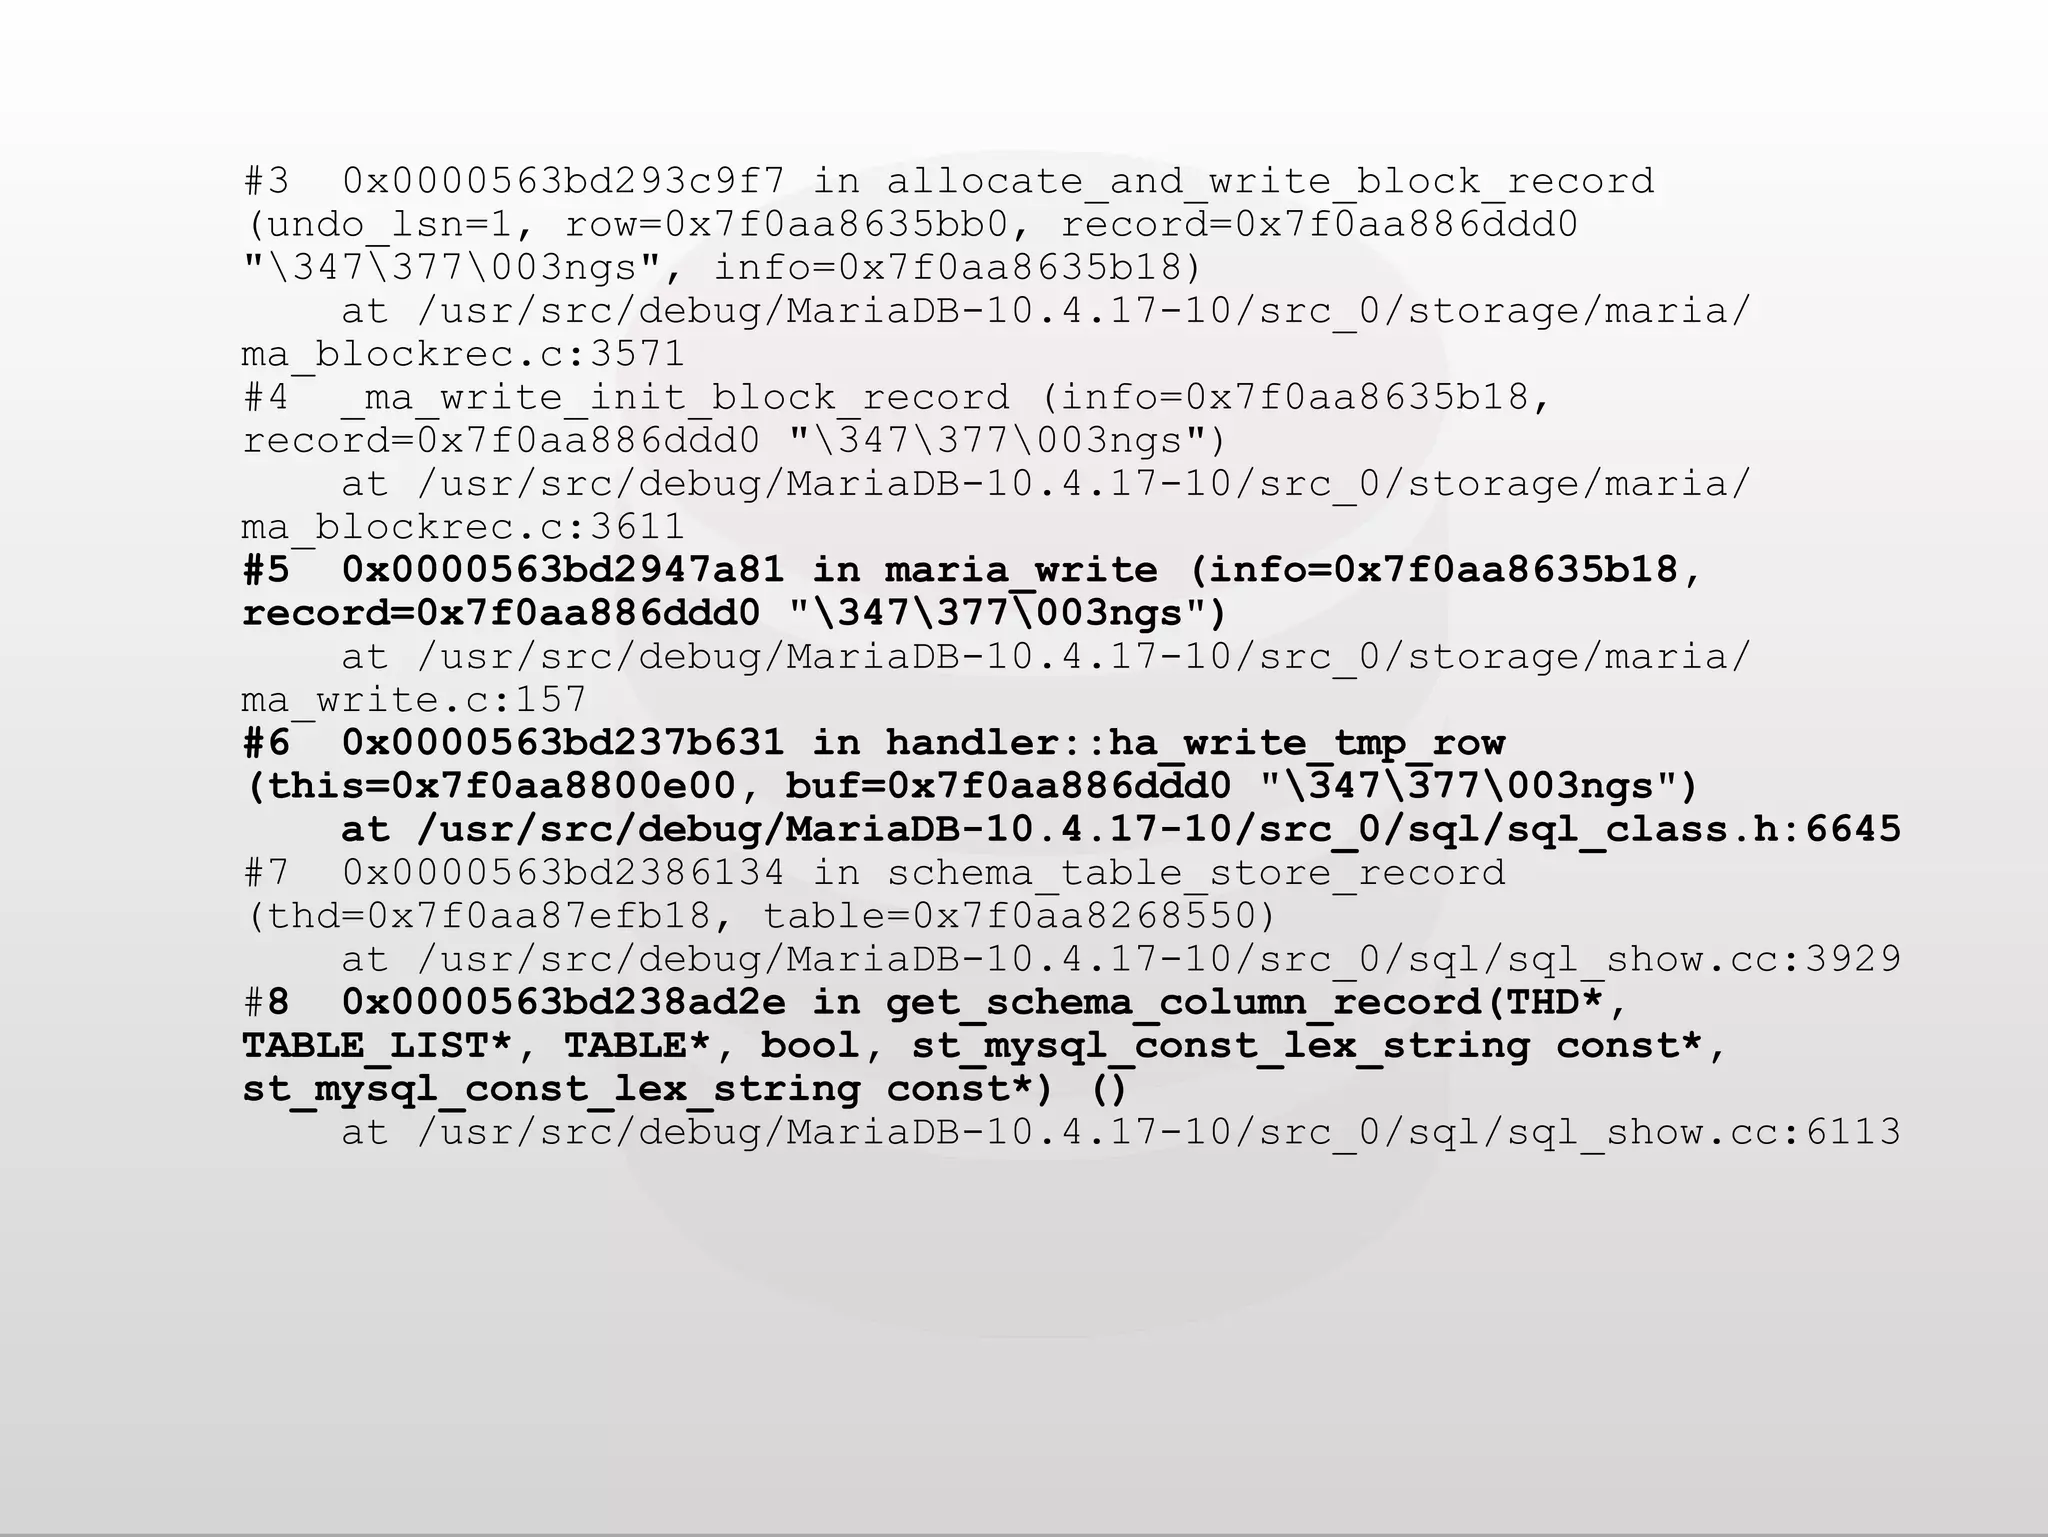
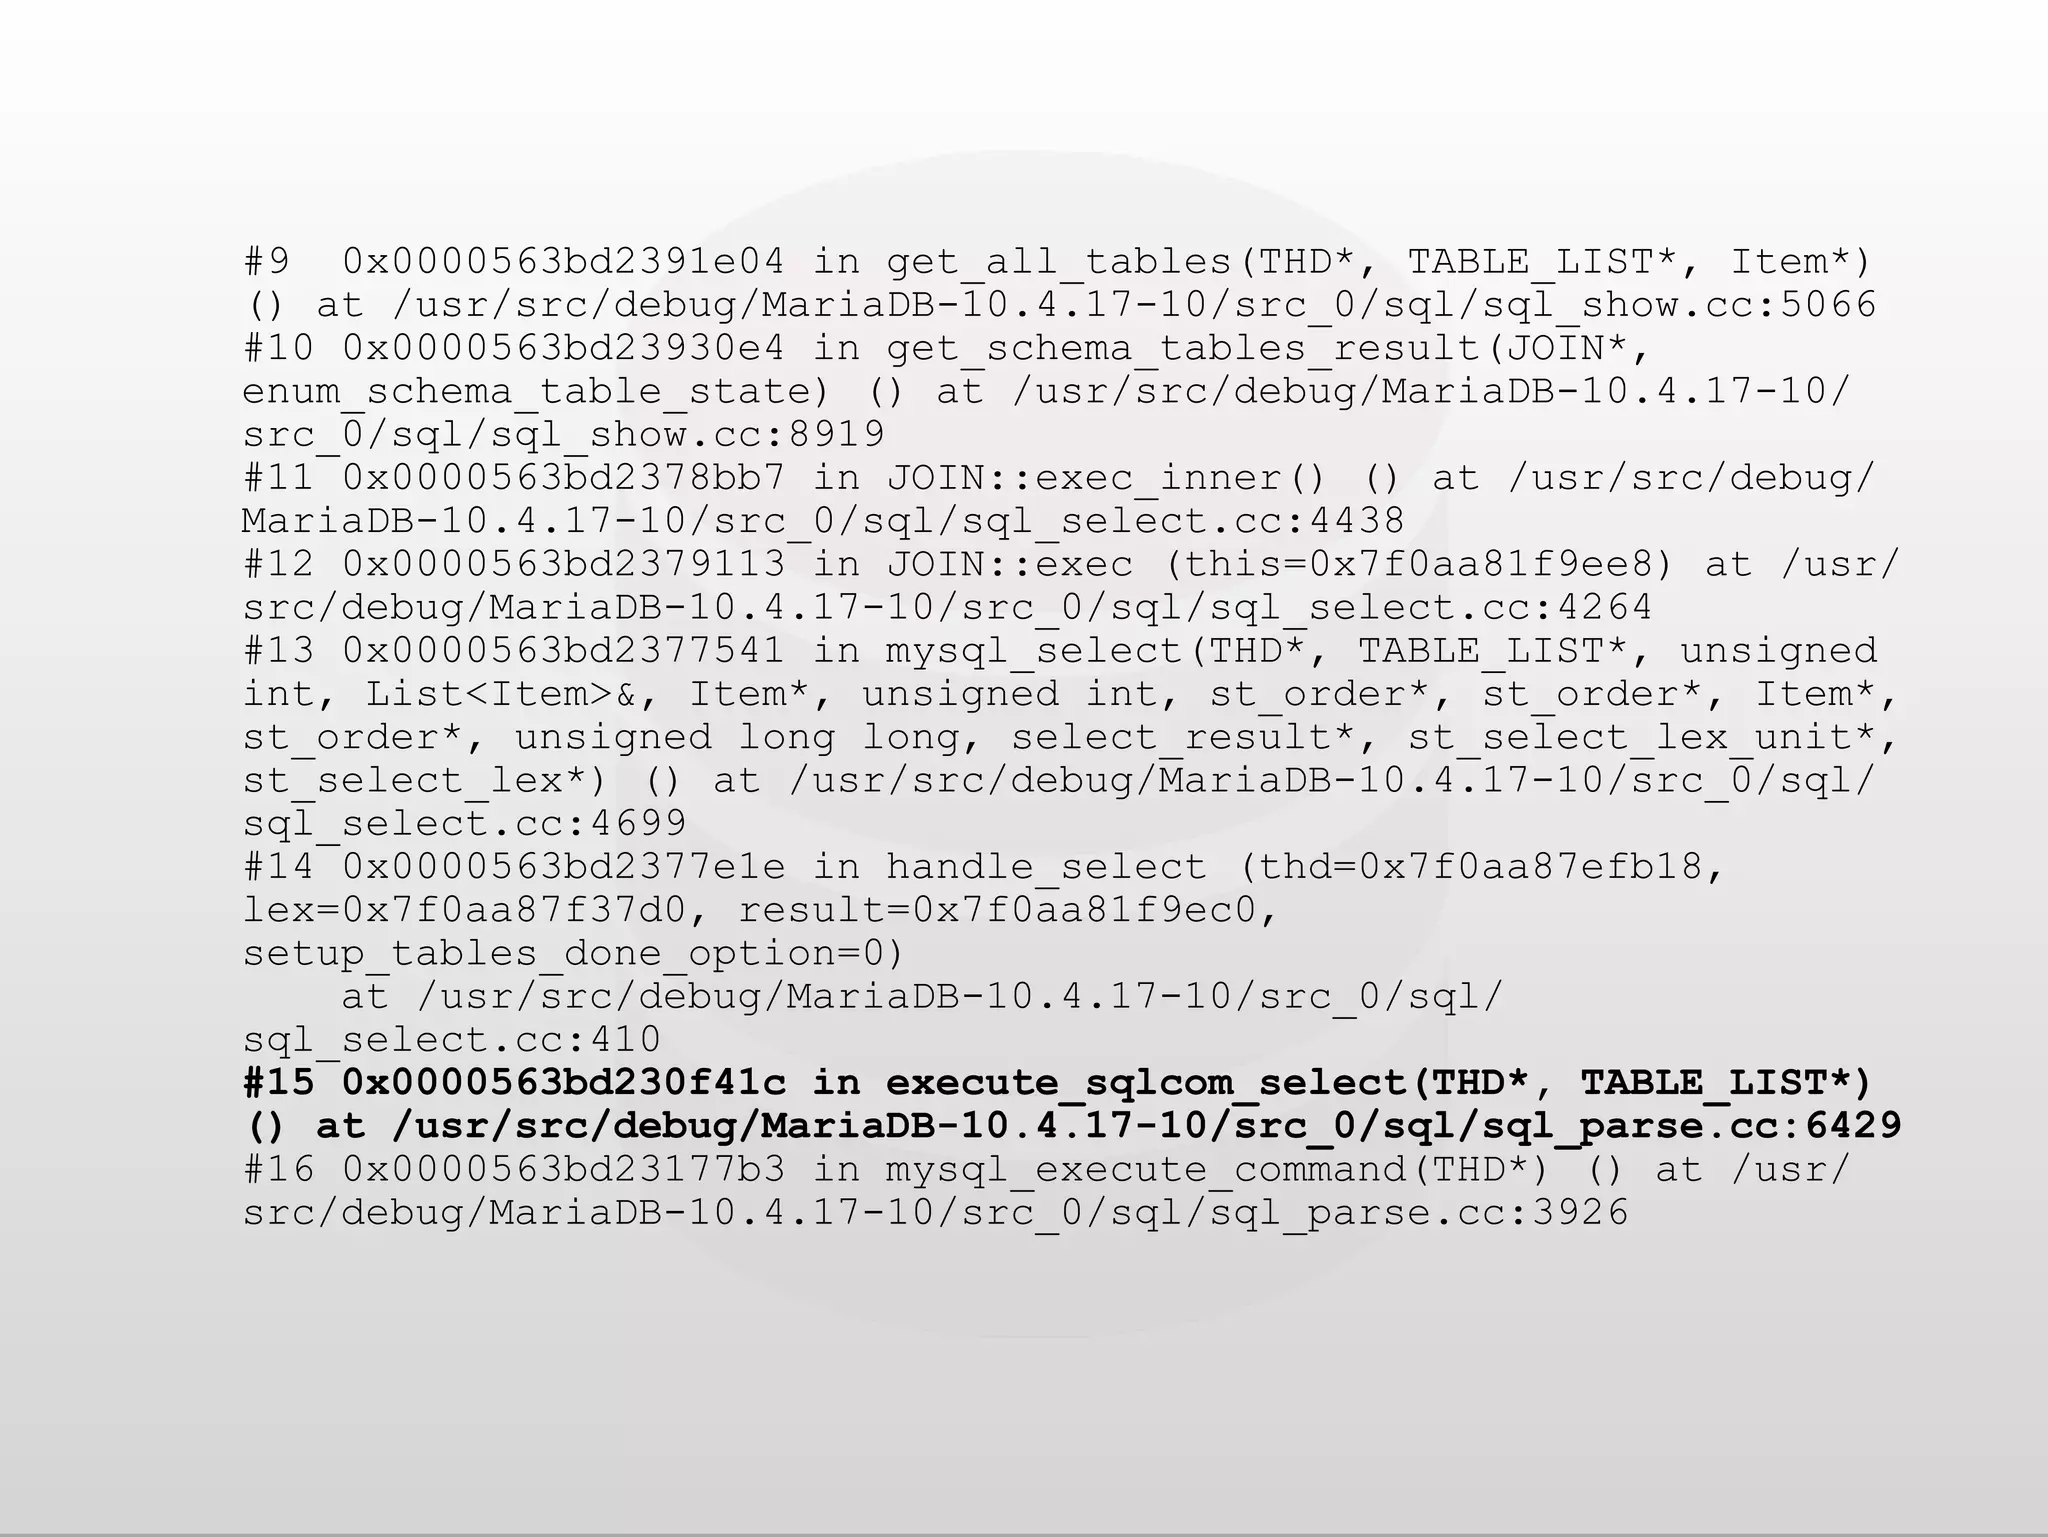
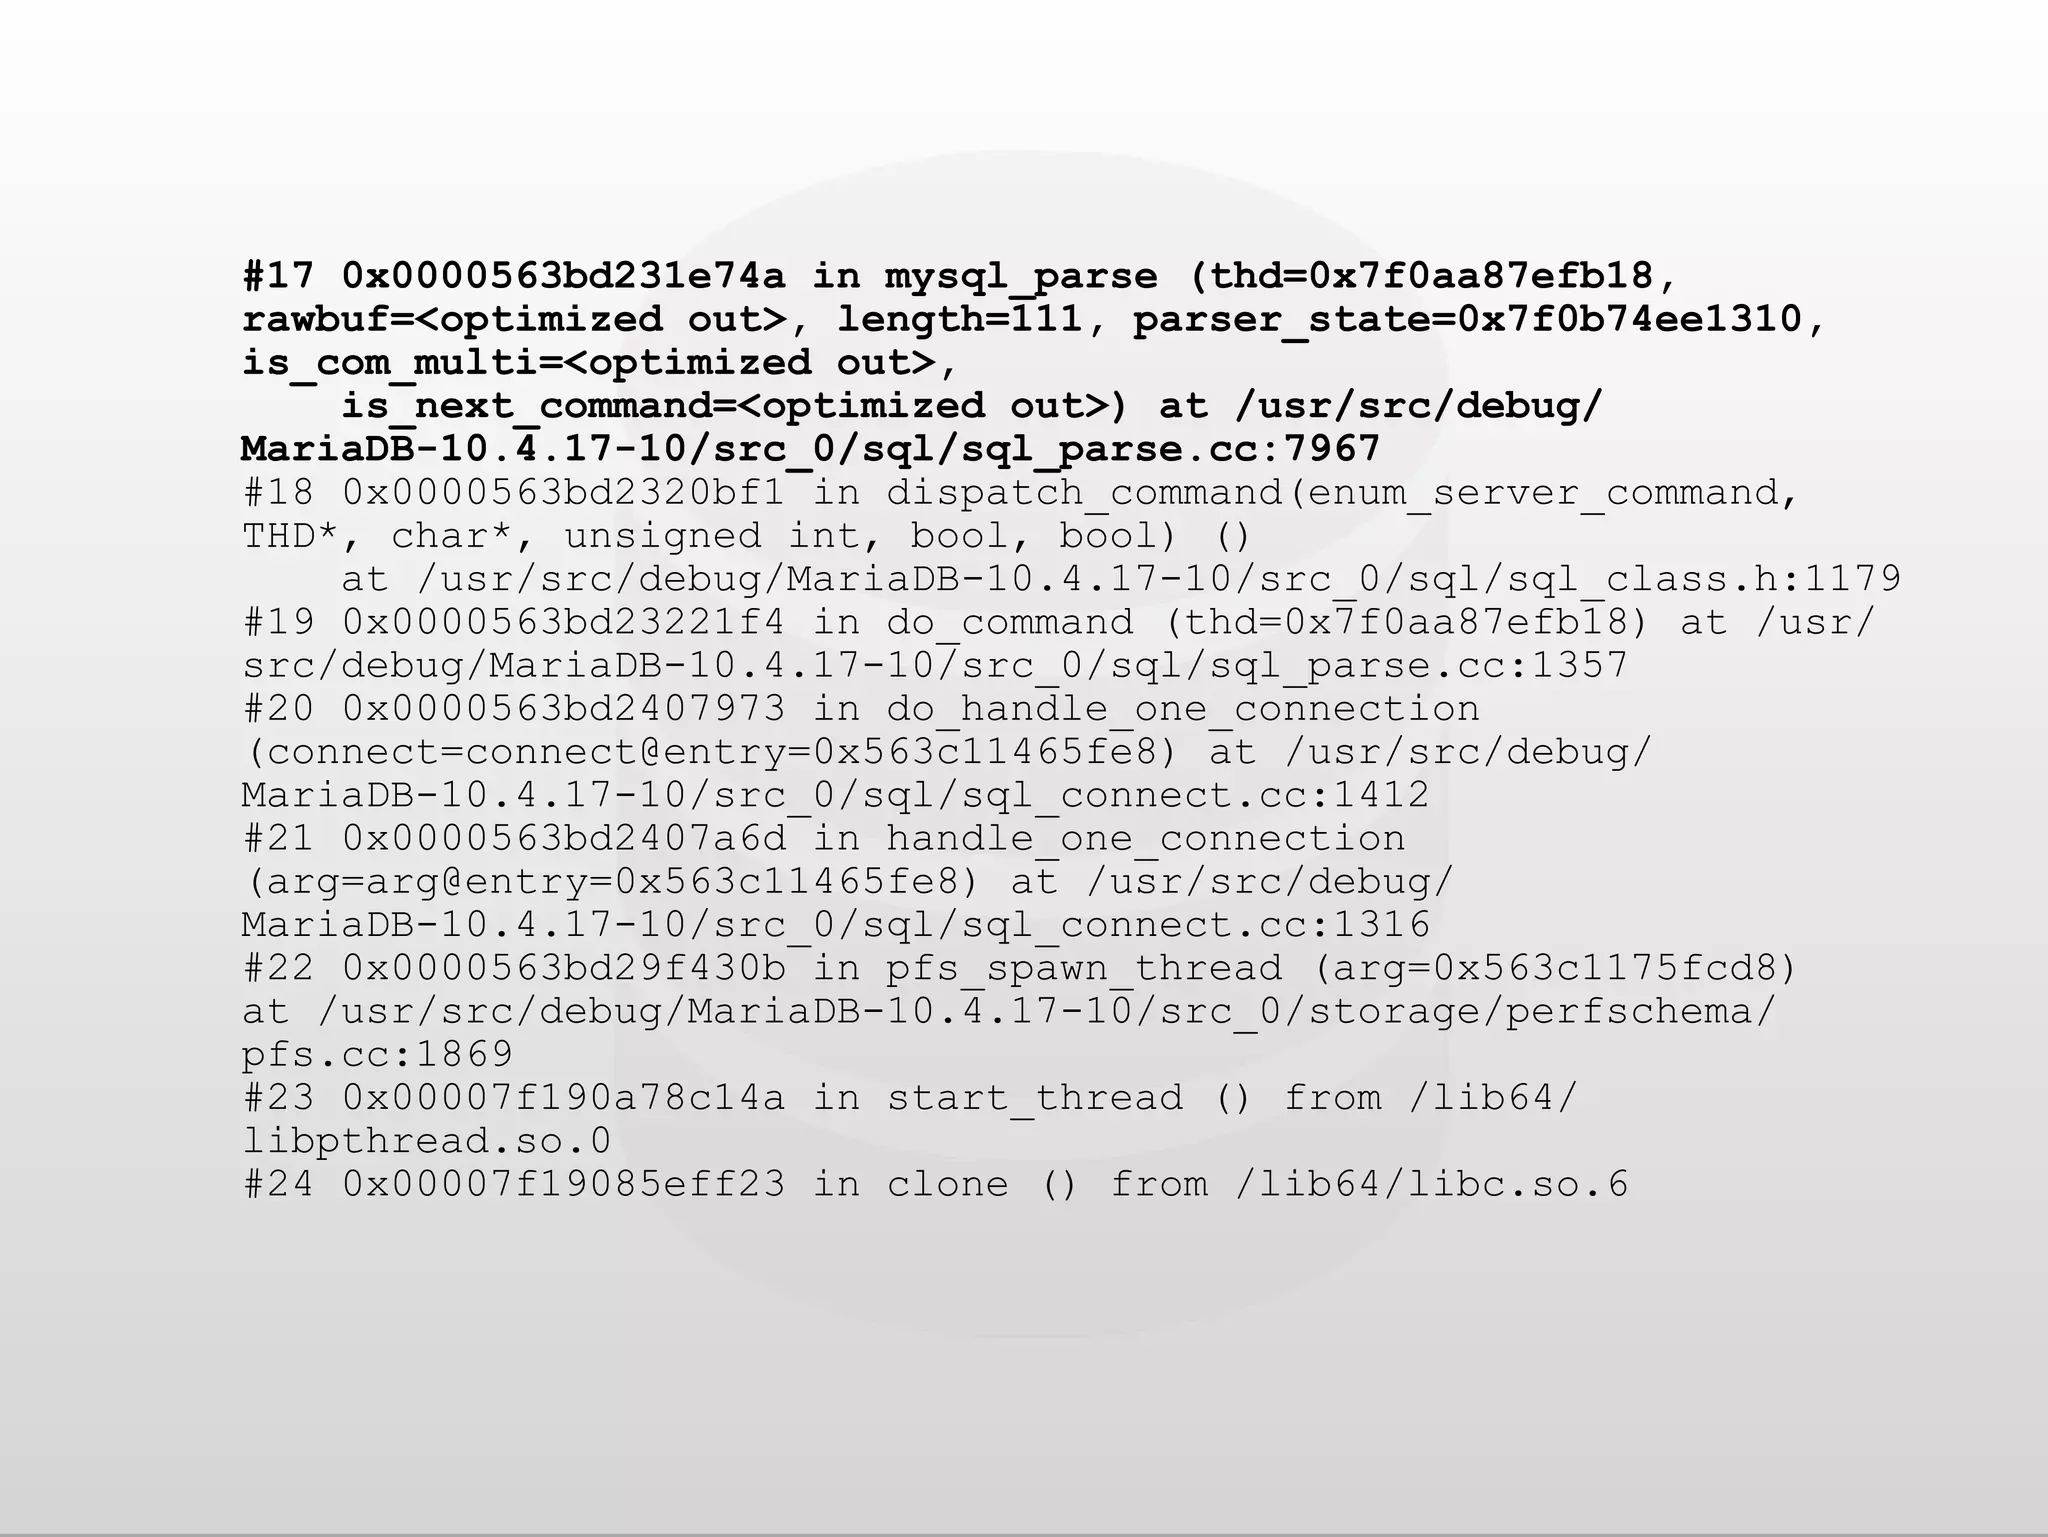
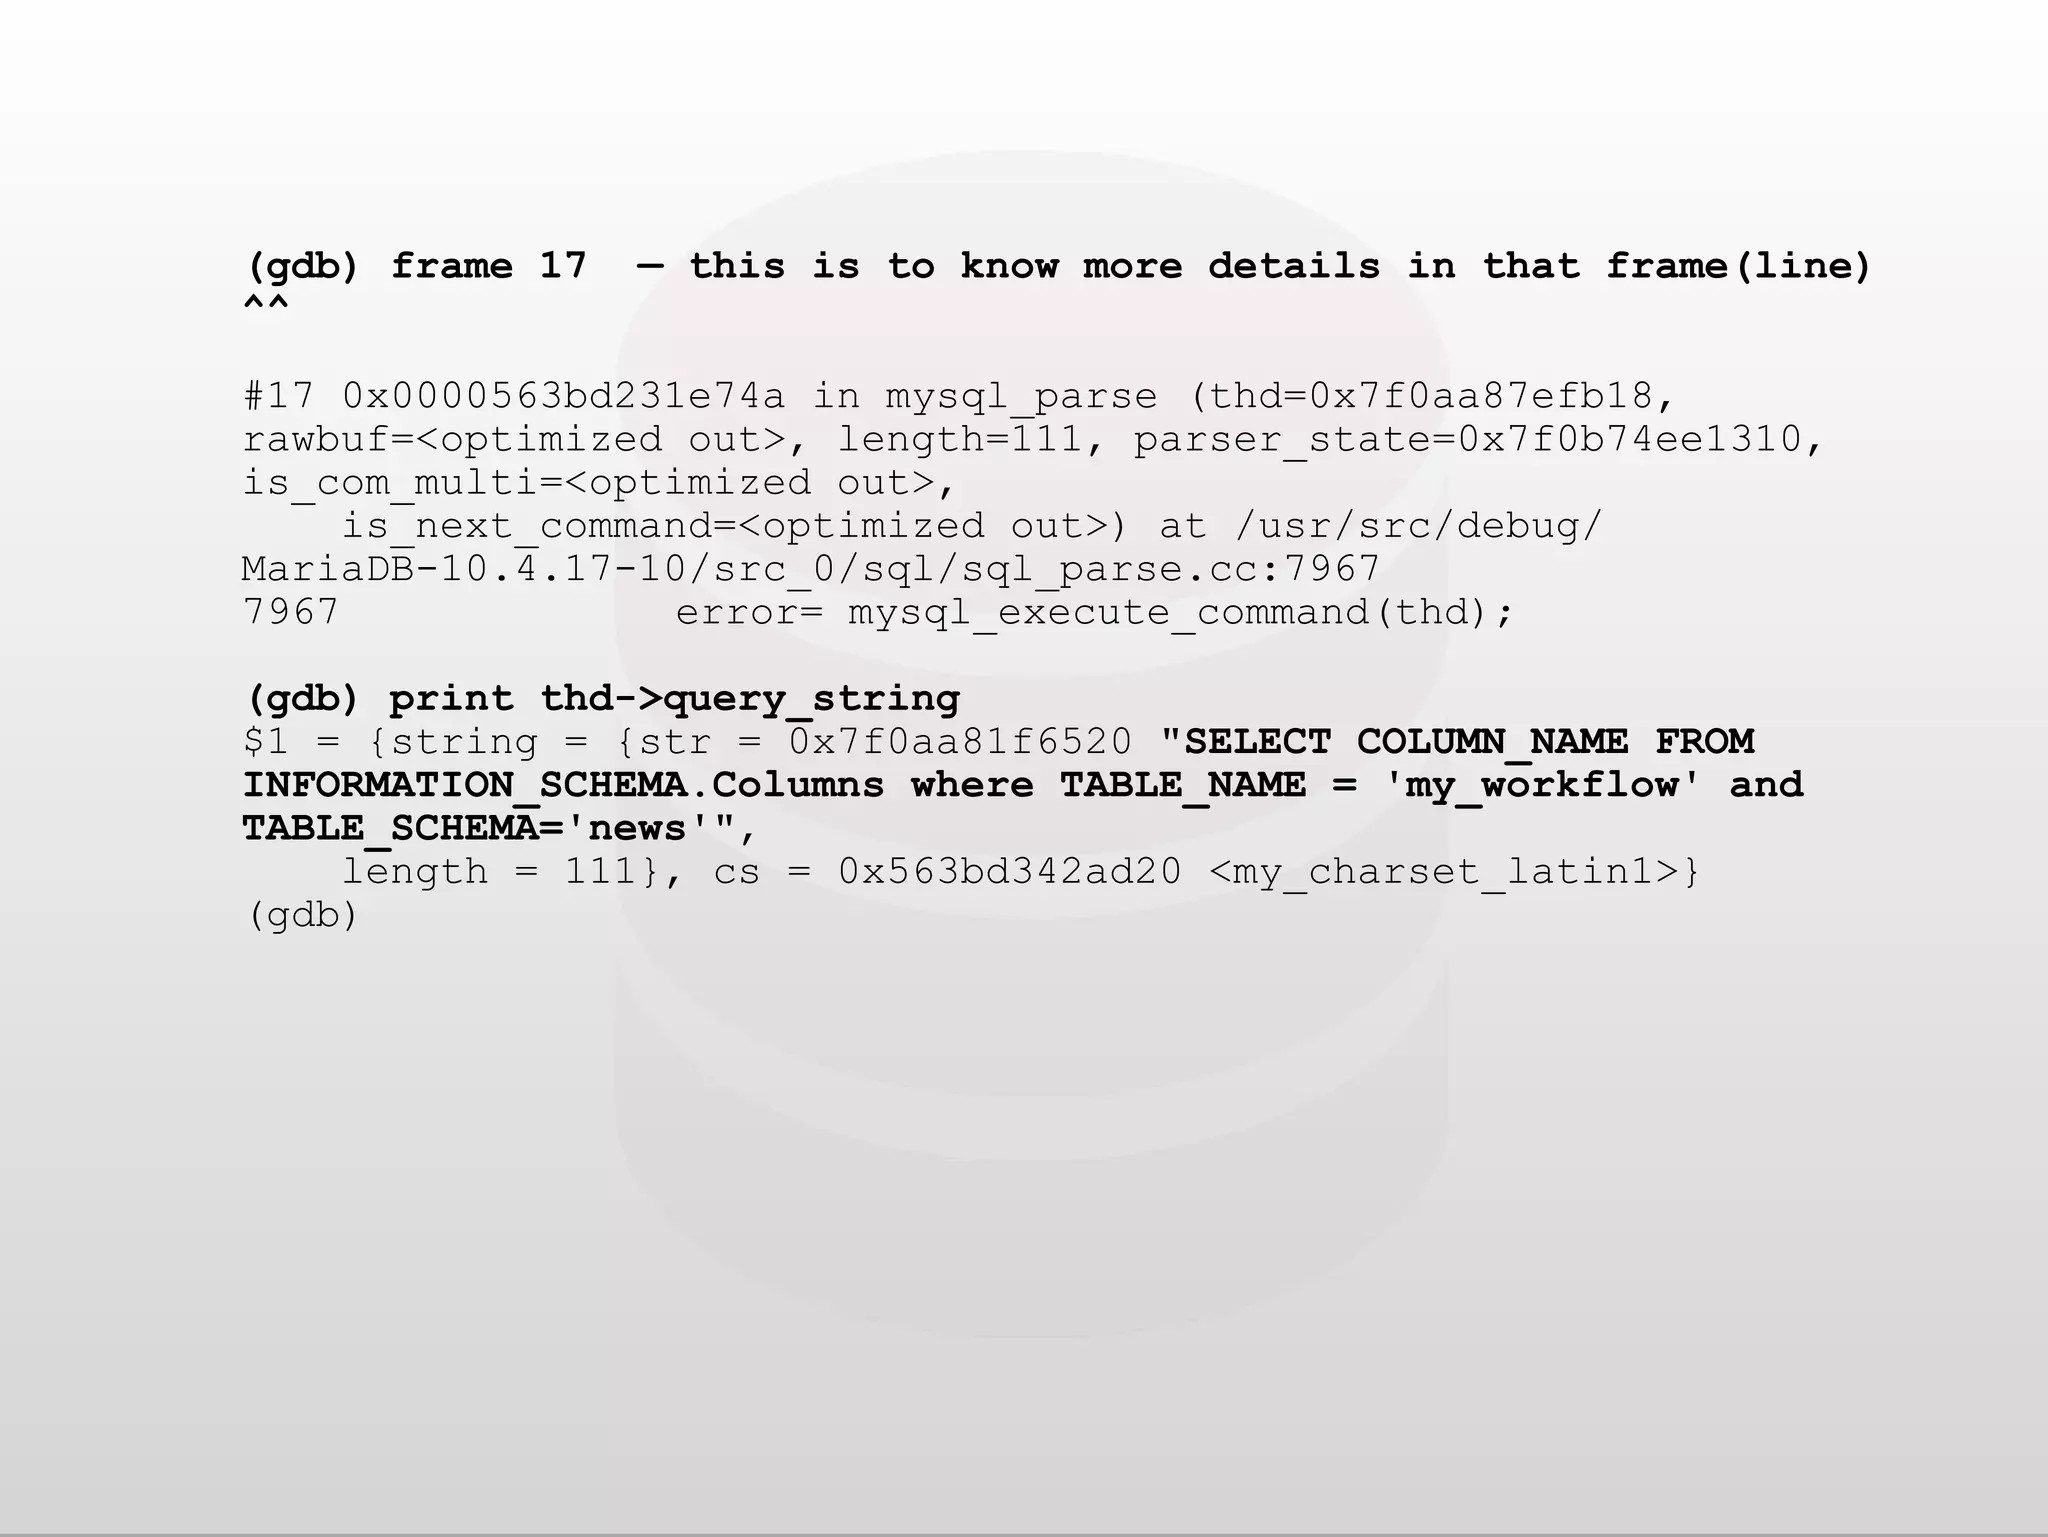
![(gdb) (gdb) thread 1 — this is for the crash [Switching to thread 1 (Thread 0x7f0b74ee2700 (LWP 2338279))] #0 0x00007f1908650de3 in __memmove_avx_unaligned_erms () from / lib64/libc.so.6 (gdb) backtrace — to get the backtrace #0 0x00007f1908650de3 in __memmove_avx_unaligned_erms () from / lib64/libc.so.6 #1 0x0000563bd293aa84 in memcpy (__len=<optimized out>, __src=<optimized out>, __dest=<optimized out>) at /usr/include/ bits/string_fortified.h:34 #2 write_block_record (info=info@entry=0x7f0aa8635b18, old_record=old_record@entry=0x0, record=record@entry=0x7f0aa886ddd0 "347377003ngs", row=row@entry=0x7f0aa8635bb0, bitmap_blocks=bitmap_blocks@entry=0x7f0aa8635bb0, head_block_is_read=<optimized out>, row_pos=0x7f0b74edbb30, undo_lsn=1, old_record_checksum=0) at /usr/src/debug/MariaDB-10.4.17-10/ src_0/storage/maria/ma_blockrec.c:2750](https://image.slidesharecdn.com/dbopspresentationnewnilnandhan-210429085932/75/Analyze-corefile-and-backtraces-with-GDB-for-Mysql-MariaDB-on-Linux-Nilandan-Joshi-MariaDB-11-2048.jpg)


This document provides a comprehensive guide for analyzing core files and obtaining backtraces using gdb for MySQL/MariaDB on Linux. It explains the process of enabling core dumps, configuring necessary system limits, and utilizing gdb commands to inspect program states after crashes. Additionally, it details requirements for debugging, including installing gdb and debug info packages, and shows examples of handling specific error signals.