The paper presents a node deployment model for wireless sensor networks that aims to minimize network costs while meeting performance metrics such as connectivity and energy efficiency. It introduces a corona-based deployment method utilizing variable transmission distances and proposes an optimization model to balance energy consumption and reduce costs. The research emphasizes the importance of effective node placement in ensuring network longevity and performance across various practical applications.
![International Journal of Wireless & Mobile Networks (IJWMN) Vol. 12, No.4, August 2020 38 With the continuous expansion of WSNs detection area, more and more attention is paid to the network cost. How to deploy the network to minimize the network cost while meeting performance requirements has become an important research content. There are not many works on network cost, and the network cost concerned mainly refers to the number of nodes. In addition to the number of sensors, many factors affect the network cost, such as the area of the detection area, energy efficiency, and network lifetime. As far as I know, there is no research to discuss network cost based on the above factors. Our goal is to design a network structure and network node deployment scheme that minimizes the cost of the network while meeting the given performance requirements. This paper gives an optimization model to minimize the network kcost, and proposes a deployment method. To sum up, the main contributions are presented as follows. (1). A "corona + cluster" network structure is proposed. The width and cluster size of each corona is different. (2). By analyzing the energy consumption and network cost, an optimization model is proposed to minimizing cost per unit area. (3). The deployment parameters are obtained by solving and improving the model, and the deployment steps of the multi-sink network are given. 2. RELATED WORK Effective deployment of Sensor Nodes(SNs) is a significant point of concern as the performance and lifetime of any WSN primarily depend on it. Various models have been proposed by researchers to deploy SNs in large-scale open regions. Network coverage and connectivity are the fundamental concerns of node deployment. The paper [1] describes relevant deployment strategies to meet coverage requirements. Network connectivity and coverage are closely related, which mainly depends on the relationship between sensing distance and communication distance. Paper [2][3] give relevant conclusions. In the large-scale field or the inaccessibility/harshness field, random deployment becomes only one option. There are two classes random deployment strategies, simple strategies, and compound strategies [4]. One of the main research contents of random deployment is determining the distribution function of nodes to ensure network connectivity and coverage. The paper[5] gave an analytical expression for estimating the average minimum number of nodes for getting full connection of networks. The paper [6] proposed a probabilistic approach to compute the covered area fraction at critical percolation for both SCPT and NCPT problems. In [7], a novel framework was proposed for solving optimal deployment problems for randomly deployed and clustered WSNs. The percolation theory is adopted to analyze the degree of connectivity when the targeted degree of partial coverage is achieved. Many researcher focus on the relocation of mobile sensors after random deployment. The paper [8] proposed the Virtual Force Algorithm (VFA) for clustering-based networks. In this method, the cluster head node calculates the coverage of the area and sends instructions to the cluster members to move to the corresponding position accordingly. Paper [9] proposed a deployment algorithm for nodes with limited mobility. Limited mobility means that the maximum distance a node can move is limited. The paper [10] proposed a non-uniform deployment method that can approximate energy balance consumption. It is assumed that all nodes are deployed in a circular area, the sink is located at the center of the circle, the transmission distance of the sensing node is the same, and the node's energy consumption includes data reception and transmission. Paper [11] proposed a non-uniform deployment method based on unequal clusters to optimize the](https://image.slidesharecdn.com/12420ijwmn03-200910121802/75/A-NODE-DEPLOYMENT-MODEL-WITH-VARIABLE-TRANSMISSION-DISTANCE-FOR-WIRELESS-SENSOR-NETWORKS-2-2048.jpg)
![International Journal of Wireless & Mobile Networks (IJWMN) Vol. 12, No.4, August 2020 39 Energy-Consuming Rate. This method combines the advantages of unequal clusters and non- uniform deployment and adopts a node sleep mechanism. It not only improves energy efficiency but also balances node energy consumption and avoids the energy holes problem. The paper [12] studied the problem of unbalanced energy consumption in a uniformly distributed network and proposed two random relay node deployment methods. The first method aims to balance the energy consumption rate of relay nodes, thereby extending the network's lifetime. This method does not guarantee the connection with the sensor node. The second method considers lifetime and connectivity. The article discusses both single-hop and multi-hop scenarios. The paper [13] proposed a novel modeling solution capable of representing a wide variety of scenarios, from totally random to planned stochastic node deployment, in heterogeneous sensor networks. Using only about 2% of H-sensors and deploying nodes by using the P- and Q-models to distribute the L-sensors around the H-sensors deployed with a repulsive model, they observed essential characteristics of the network topology, such as low average path length and high clustering coefficient.The paper [14] gave a survey about clustering and cluster-based multi-hop routing protocols. Some parameters were given to evaluate the properties of the different methods. The studied methods are classified into four categories: classical approaches, fuzzy- based approaches, metaheuristic-based approaches, and hybrid metaheuristic- and fuzzy-based approaches. In each category of the classification, criteria and parameters are presented according to the type of methodology. The authors [15] gave a efficient coding techniques algorithm for cluster-heads communication in wireless sensor networks to improve the Bit-error rate. The paper [16] proposed a new cluster-based algorithm to minimize energy consumption in WSNs. In the wireless sensor network, the uneven energy consumption of the nodes significantly shortens the network lifetime and causes waste. An essential idea to solve this problem is to equip nodes with different energy. Paper [17] studied the benefits of multi-level batteries for prolonging the network's lifetime, showing that under the total energy budget, the network lifetime under the multi-level battery allocation method is much longer than that under the same battery allocation. Paper [18] further studied the battery distribution method. The problem can be described as: There are m types of batteries, and the power and cost are known. Different types and numbers of batteries can be packaged and distributed to the node. Assuming that there M battery packs, determine the number of each type battery in each pack to maximize the network lifetime. In order to balance the energy consumption of sensors, the mixed/hybrid transmission schemes appeared in many papers [19]. Each sensor can adjust its transmission power level and alternates between direct transmission mode (sending data directly to sink without using any relay node) and hop-by-hop transmission mode (forwarding data to next-hop neighbors). According to the energy consumption model of node data transmission, energy consumption can be changed by adjusting the transmission distance. Some deployment methods have been developed to balance the energy consumption of nodes by adjusting the nodes' data transmission distance. The paper [20] discussed the problem of balancing the energy consumption of nodes by changing the transmission distance, and provided an iteration-based method for determining the transmission distance. This paper proposed an improved corona model with levels to investigate the transmission range assignment strategy used to maximize the lifetime of wireless sensor networks. The author proved the problem of searching optimal transmission range lists is a multi- objective optimization problem, and that is also NP hard. The author [21] proposed a mixed integer programming formulation, i.e., SPSRC, that combines all design issues in a single model. The SPSRC finds the sensors' and sinks' optimal locations, active/standby periods of the sensors, and the data transmission routes from each active sensor to its assigned sink.](https://image.slidesharecdn.com/12420ijwmn03-200910121802/75/A-NODE-DEPLOYMENT-MODEL-WITH-VARIABLE-TRANSMISSION-DISTANCE-FOR-WIRELESS-SENSOR-NETWORKS-3-2048.jpg)
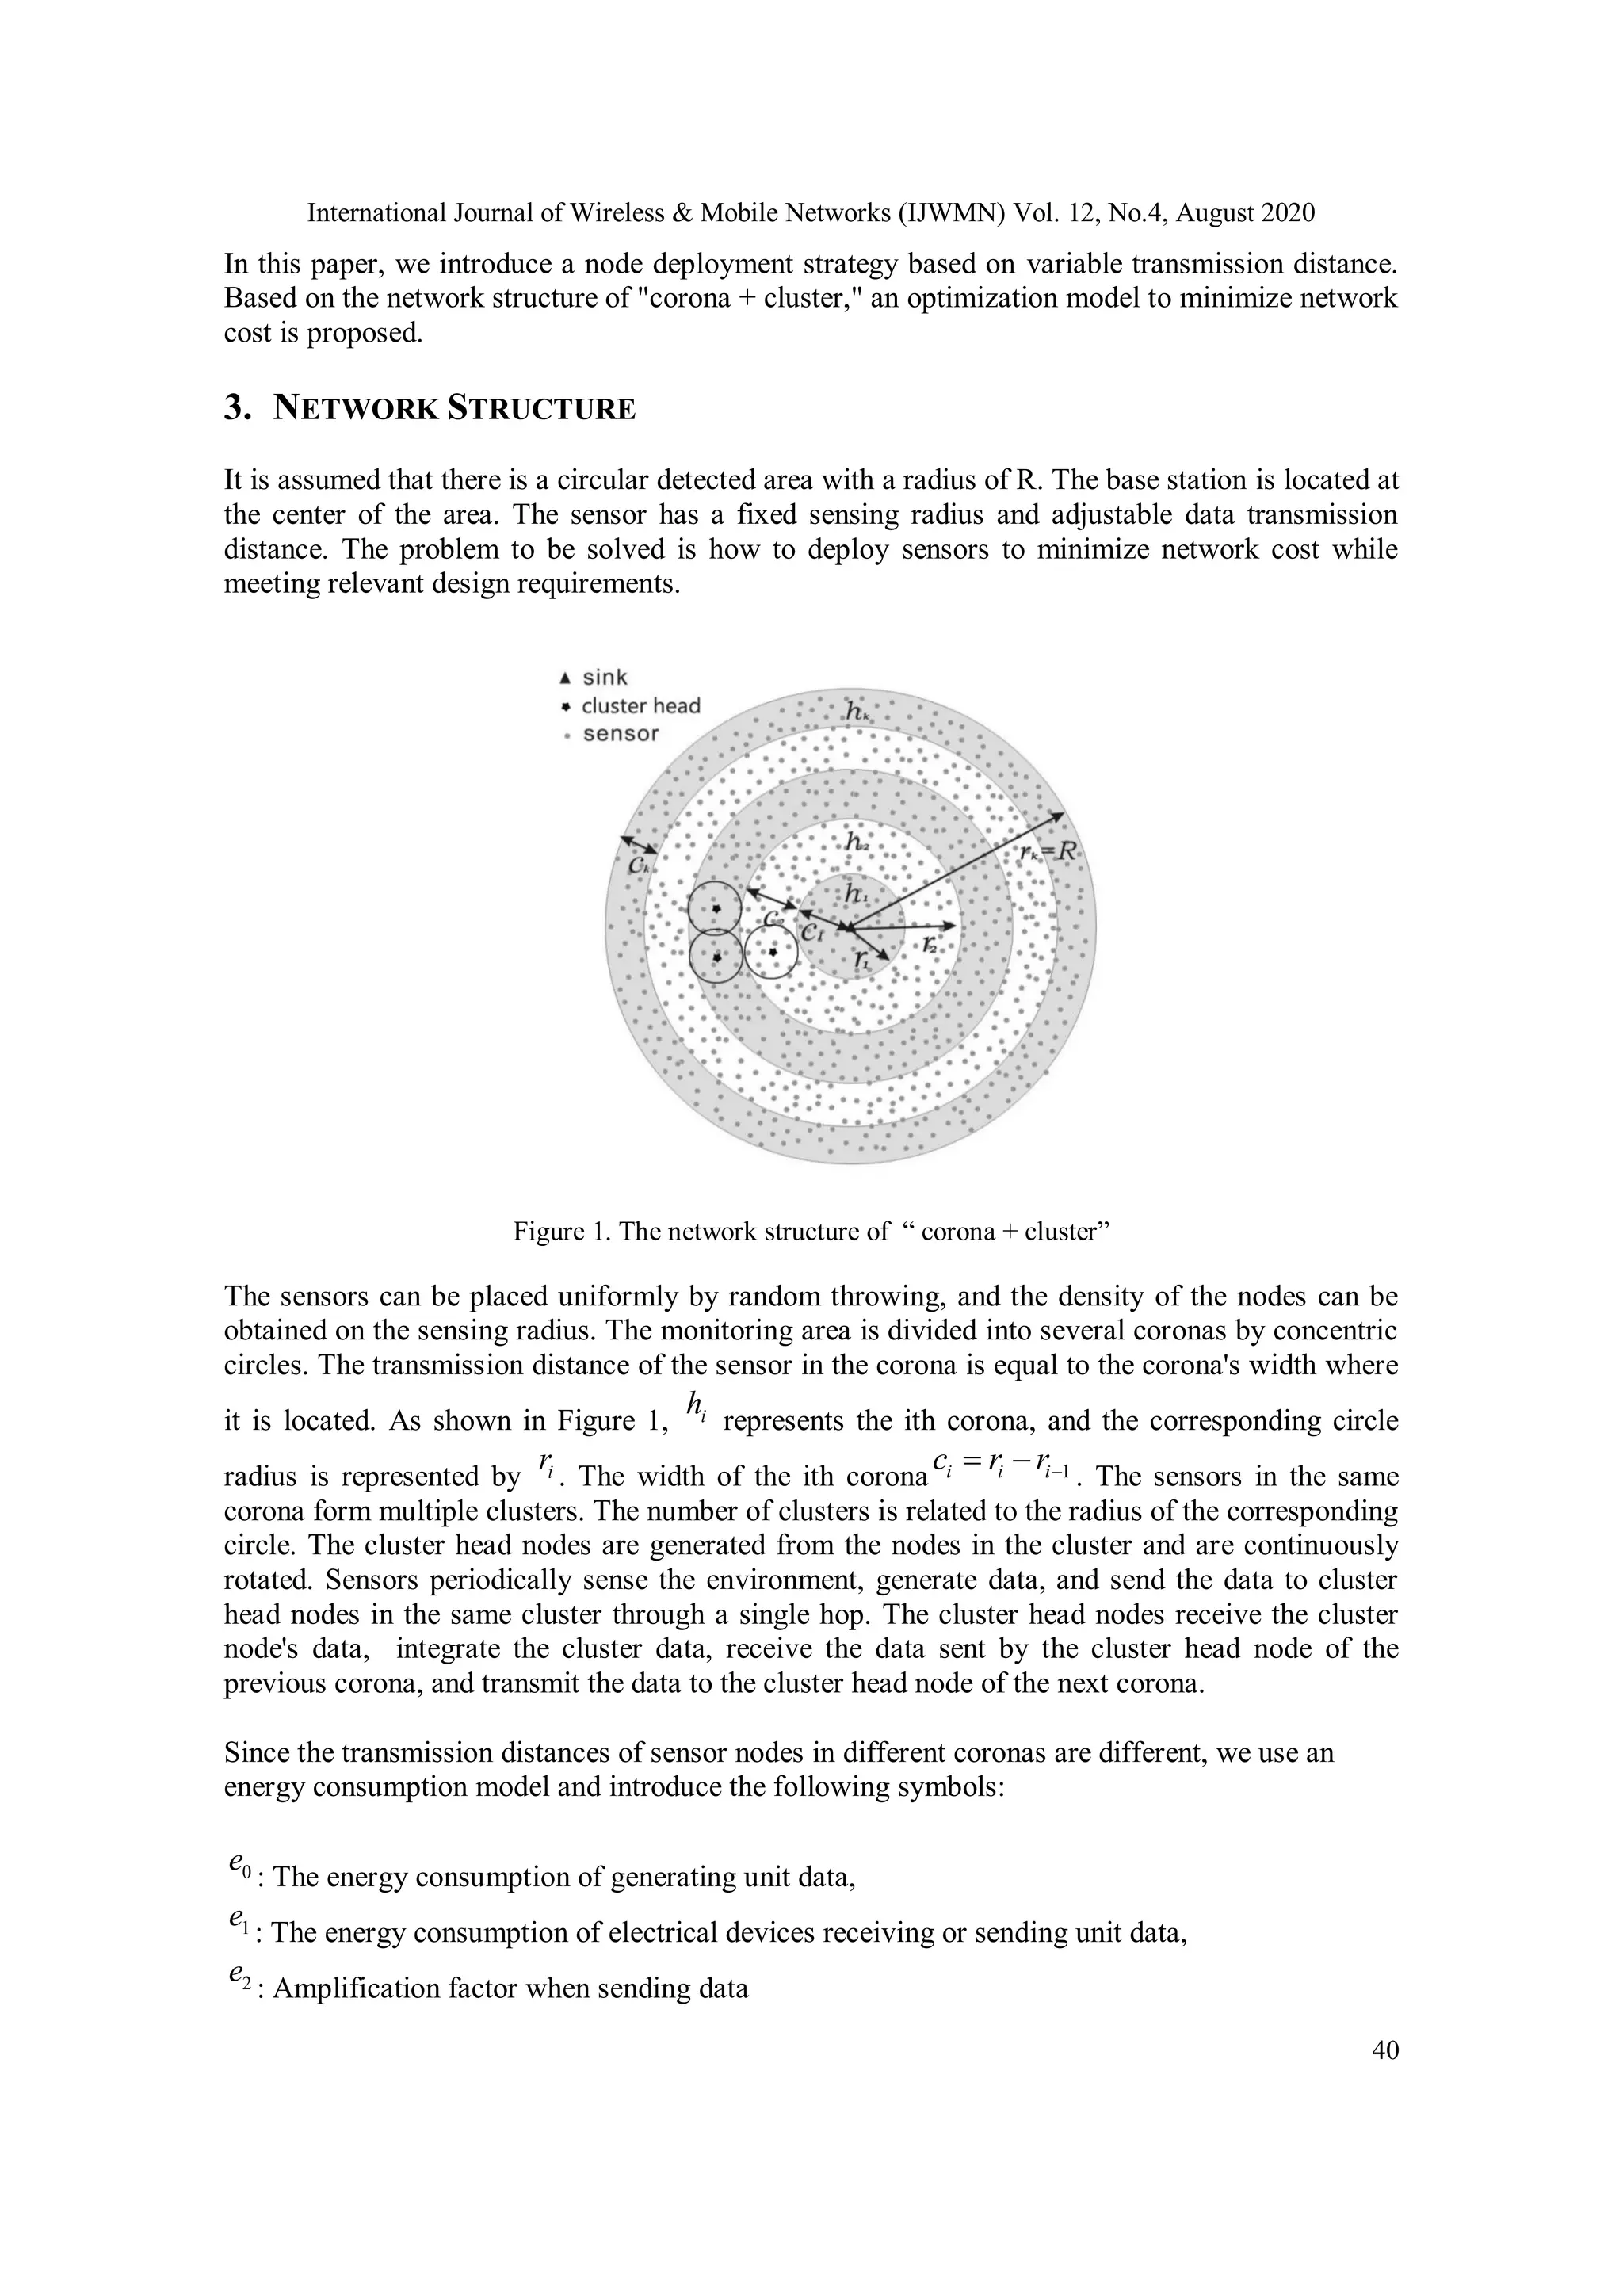
![International Journal of Wireless & Mobile Networks (IJWMN) Vol. 12, No.4, August 2020 41 3e : The energy consumption of integrated unit data The energy consumption formula for sending unit data is: 2 1 2+e e d , where d is the sending distance. The sensor’s energy consumption per unit time is: 2 0 1 1 2 3( ) ,E e x e y e e d z e n where , , ,x y z n indicate the corresponding amount of data,respectively. Since the energy consumption of cluster management and cluster head generation is far less than that of data transmission, it can be ignored. Of course, it can also be set as a fixed value independent of data volume, namely the fixed energy consumption per unit time, which has almost no impact on our optimization model's solution. The cost model of the sensor is a bE , where a is the hardware cost of sensor, b is the unit energy cost, E is the energy value fixed at the node. It is known that the energy consumption of each corona node is different. To effectively use the energy, we will adopt the method that assembles different initial energy for the nodes in different coronas. In this way, the costs of nodes in different coronas are different. The base station is powered by dedicated lines or solar energy, and its cost is fixed. Network lifetime refers to the minimum lifetime of a node min{ }iT T , where iT is the lifetime of node i. In an ideal network, each node has the same lifetime. One of our design goals is that all nodes have approximately the same lifetime. As a design index, network lifetime should meet the application requirement. Network design lifetime is an important factor affecting network cost. 4. OPTIMIZATION MODEL 4.1. Analysis and Model Firstly, the sensor's energy consumption is analyzed. We divide the energy consumption into two parts: (1) Intra-cluster energy consumption, including energy consumption of sensor, sensing the environment and transmitting data to the cluster head node, and energy consumption of the cluster head node that receives, integrates the data in the cluster and sends to next cluster head node. (2)Inter-cluster energy consumption refers to the energy consumption when the cluster- head node receives data from the previous cluster-head node and sends it to the next cluster head node. The number of nodes in the ith corona is iN , then 2 2 1= )i i iN r r ( Where, is a node density that ensures to meet the coverage requirements of the monitoring area. It has been proved in literature [22] that at least 2 i ir c clusters are needed to cover the ith corona. We can calculate the proportion of cluster-head nodes to all nodes in the ith corona.](https://image.slidesharecdn.com/12420ijwmn03-200910121802/75/A-NODE-DEPLOYMENT-MODEL-WITH-VARIABLE-TRANSMISSION-DISTANCE-FOR-WIRELESS-SENSOR-NETWORKS-5-2048.jpg)
![International Journal of Wireless & Mobile Networks (IJWMN) Vol. 12, No.4, August 2020 42 2 2 2 1 2 2 = ) (2 ) i i i i i i i i i r c r p r r c r c ( , The energy consumption per unit time of each cluster-head node in ith corona is: 2 _ 0 1 3 2 1 1 1 1 ( 1) (e )ch i i i i i E e l e l e l ml c e p p p , where l is the amount of data generated by a sensor per unit time. In the above formula, the first term is the energy consumption for generating data, the second is the energy consumption of receiving data from other nodes in the cluster, the third is the energy consumption of integrating data, and the fourth is the consumption for sending the integrated data to the next cluster head node, where m is the data compression factor. In many non-uniform clustering algorithms, clusters far from the base station are larger than clusters close to the base station [11]. To ensure sending data to the cluster head node of the next corona, transmission distance of the cluster head node is set as the corona width. The energy consumption per unit time of sensor in ith corona is: 2 _ 0 2 1(e )nch i iE e l l c e , The first term is the energy consumption for generating sensory data. The second is the energy consumption of sending the data to the cluster head node. Based on the above two formulas, the energy consumption of all nodes in ith corona per unit time can be obtained. intra _ _ _ 2 2 0 1 3 2 1 0 2 1 2 0 1 2 3 (1 ) (1 ) (e ) (1 ) (1 ) (e ) { [2(1 ) ] (1 )e } i i i ch i i i nch i i i i i i i i i i i i i i i i i E N p E N p E N p e l N p e l N e l N ml c e N p e l N p l c e N l e p m e p m c e The inter-cluster energy consumption per unit time of all cluster head nodes in ith corona is: 2 2 2 2 2 int _ 1 1 2 2 2 2 1 2 ( ) ( ) ( ) = ( ) (2 ) er i i i i i i E R r mle R r ml e e c R r ml e e c In particular, since the cluster head nodes in the outermost corona does not receive data from other coronas, int _ 0er kE . The total energy consumption of all nodes in ith corona per unit time is: int _ int _i ra i er iE E E , It can be seen that the total energy consumption is different under different corona numbers and corona widths.The average energy consumption per unit time of each node in ith corona is:](https://image.slidesharecdn.com/12420ijwmn03-200910121802/75/A-NODE-DEPLOYMENT-MODEL-WITH-VARIABLE-TRANSMISSION-DISTANCE-FOR-WIRELESS-SENSOR-NETWORKS-6-2048.jpg)
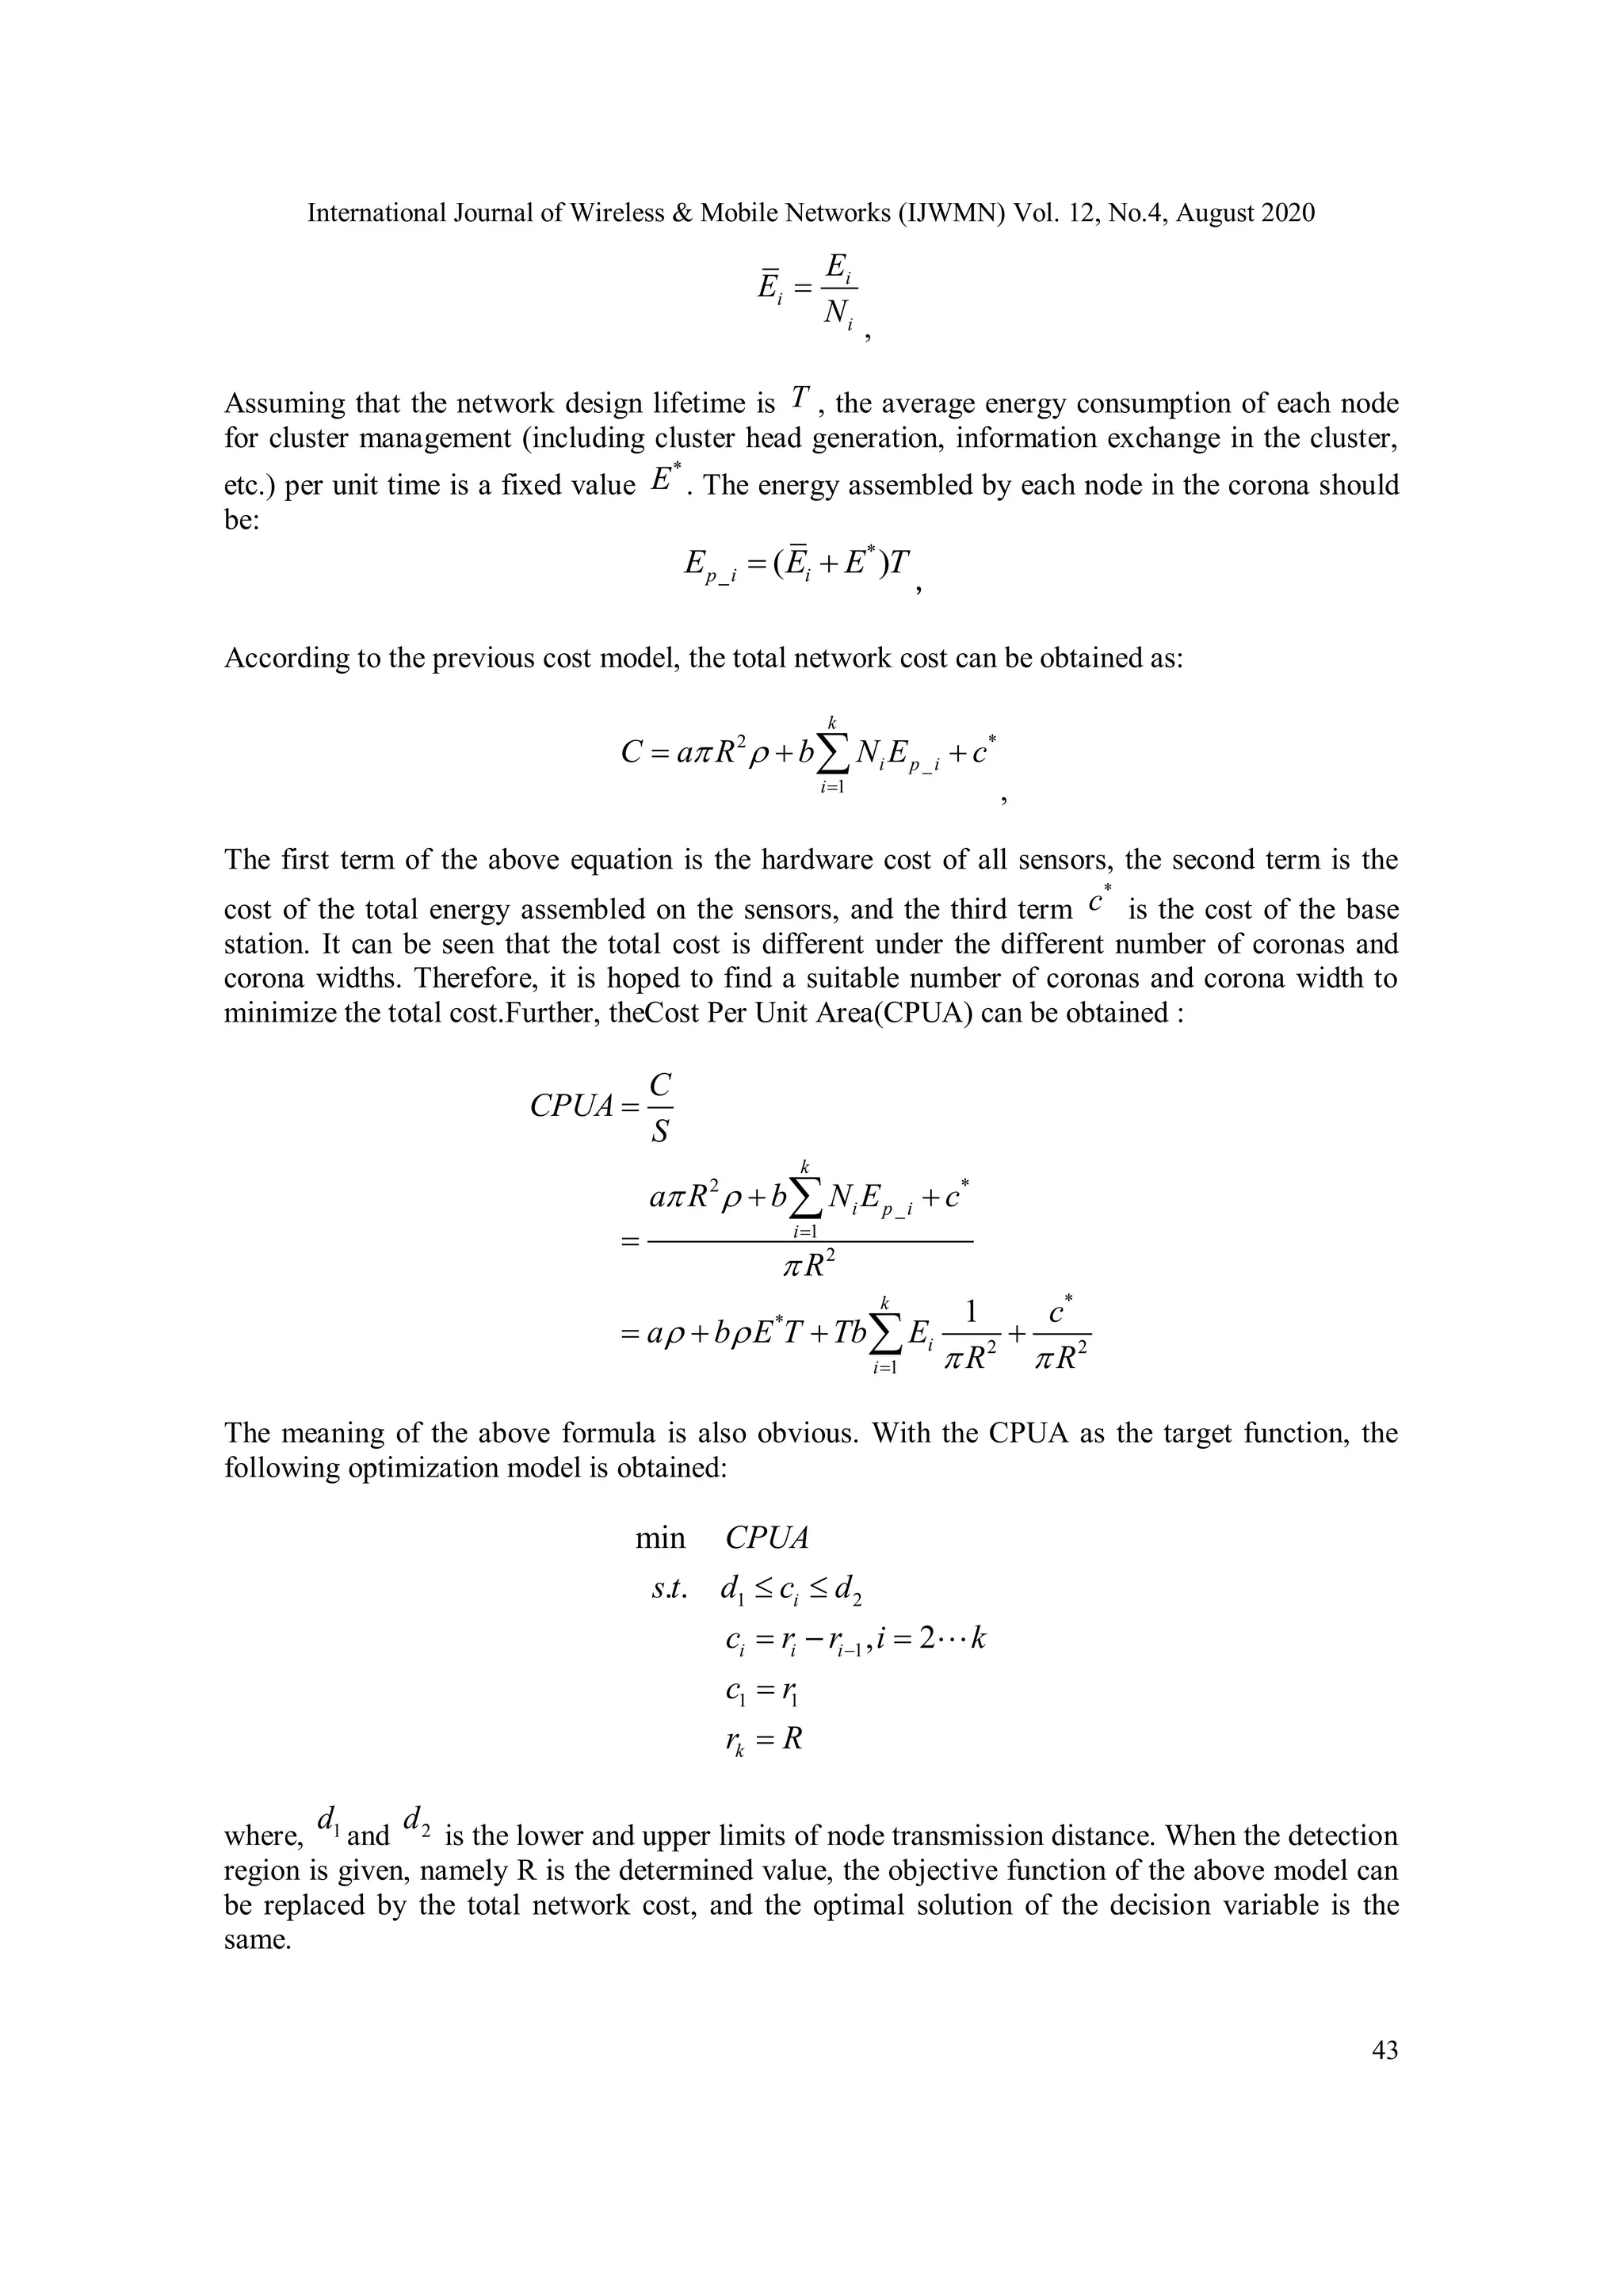

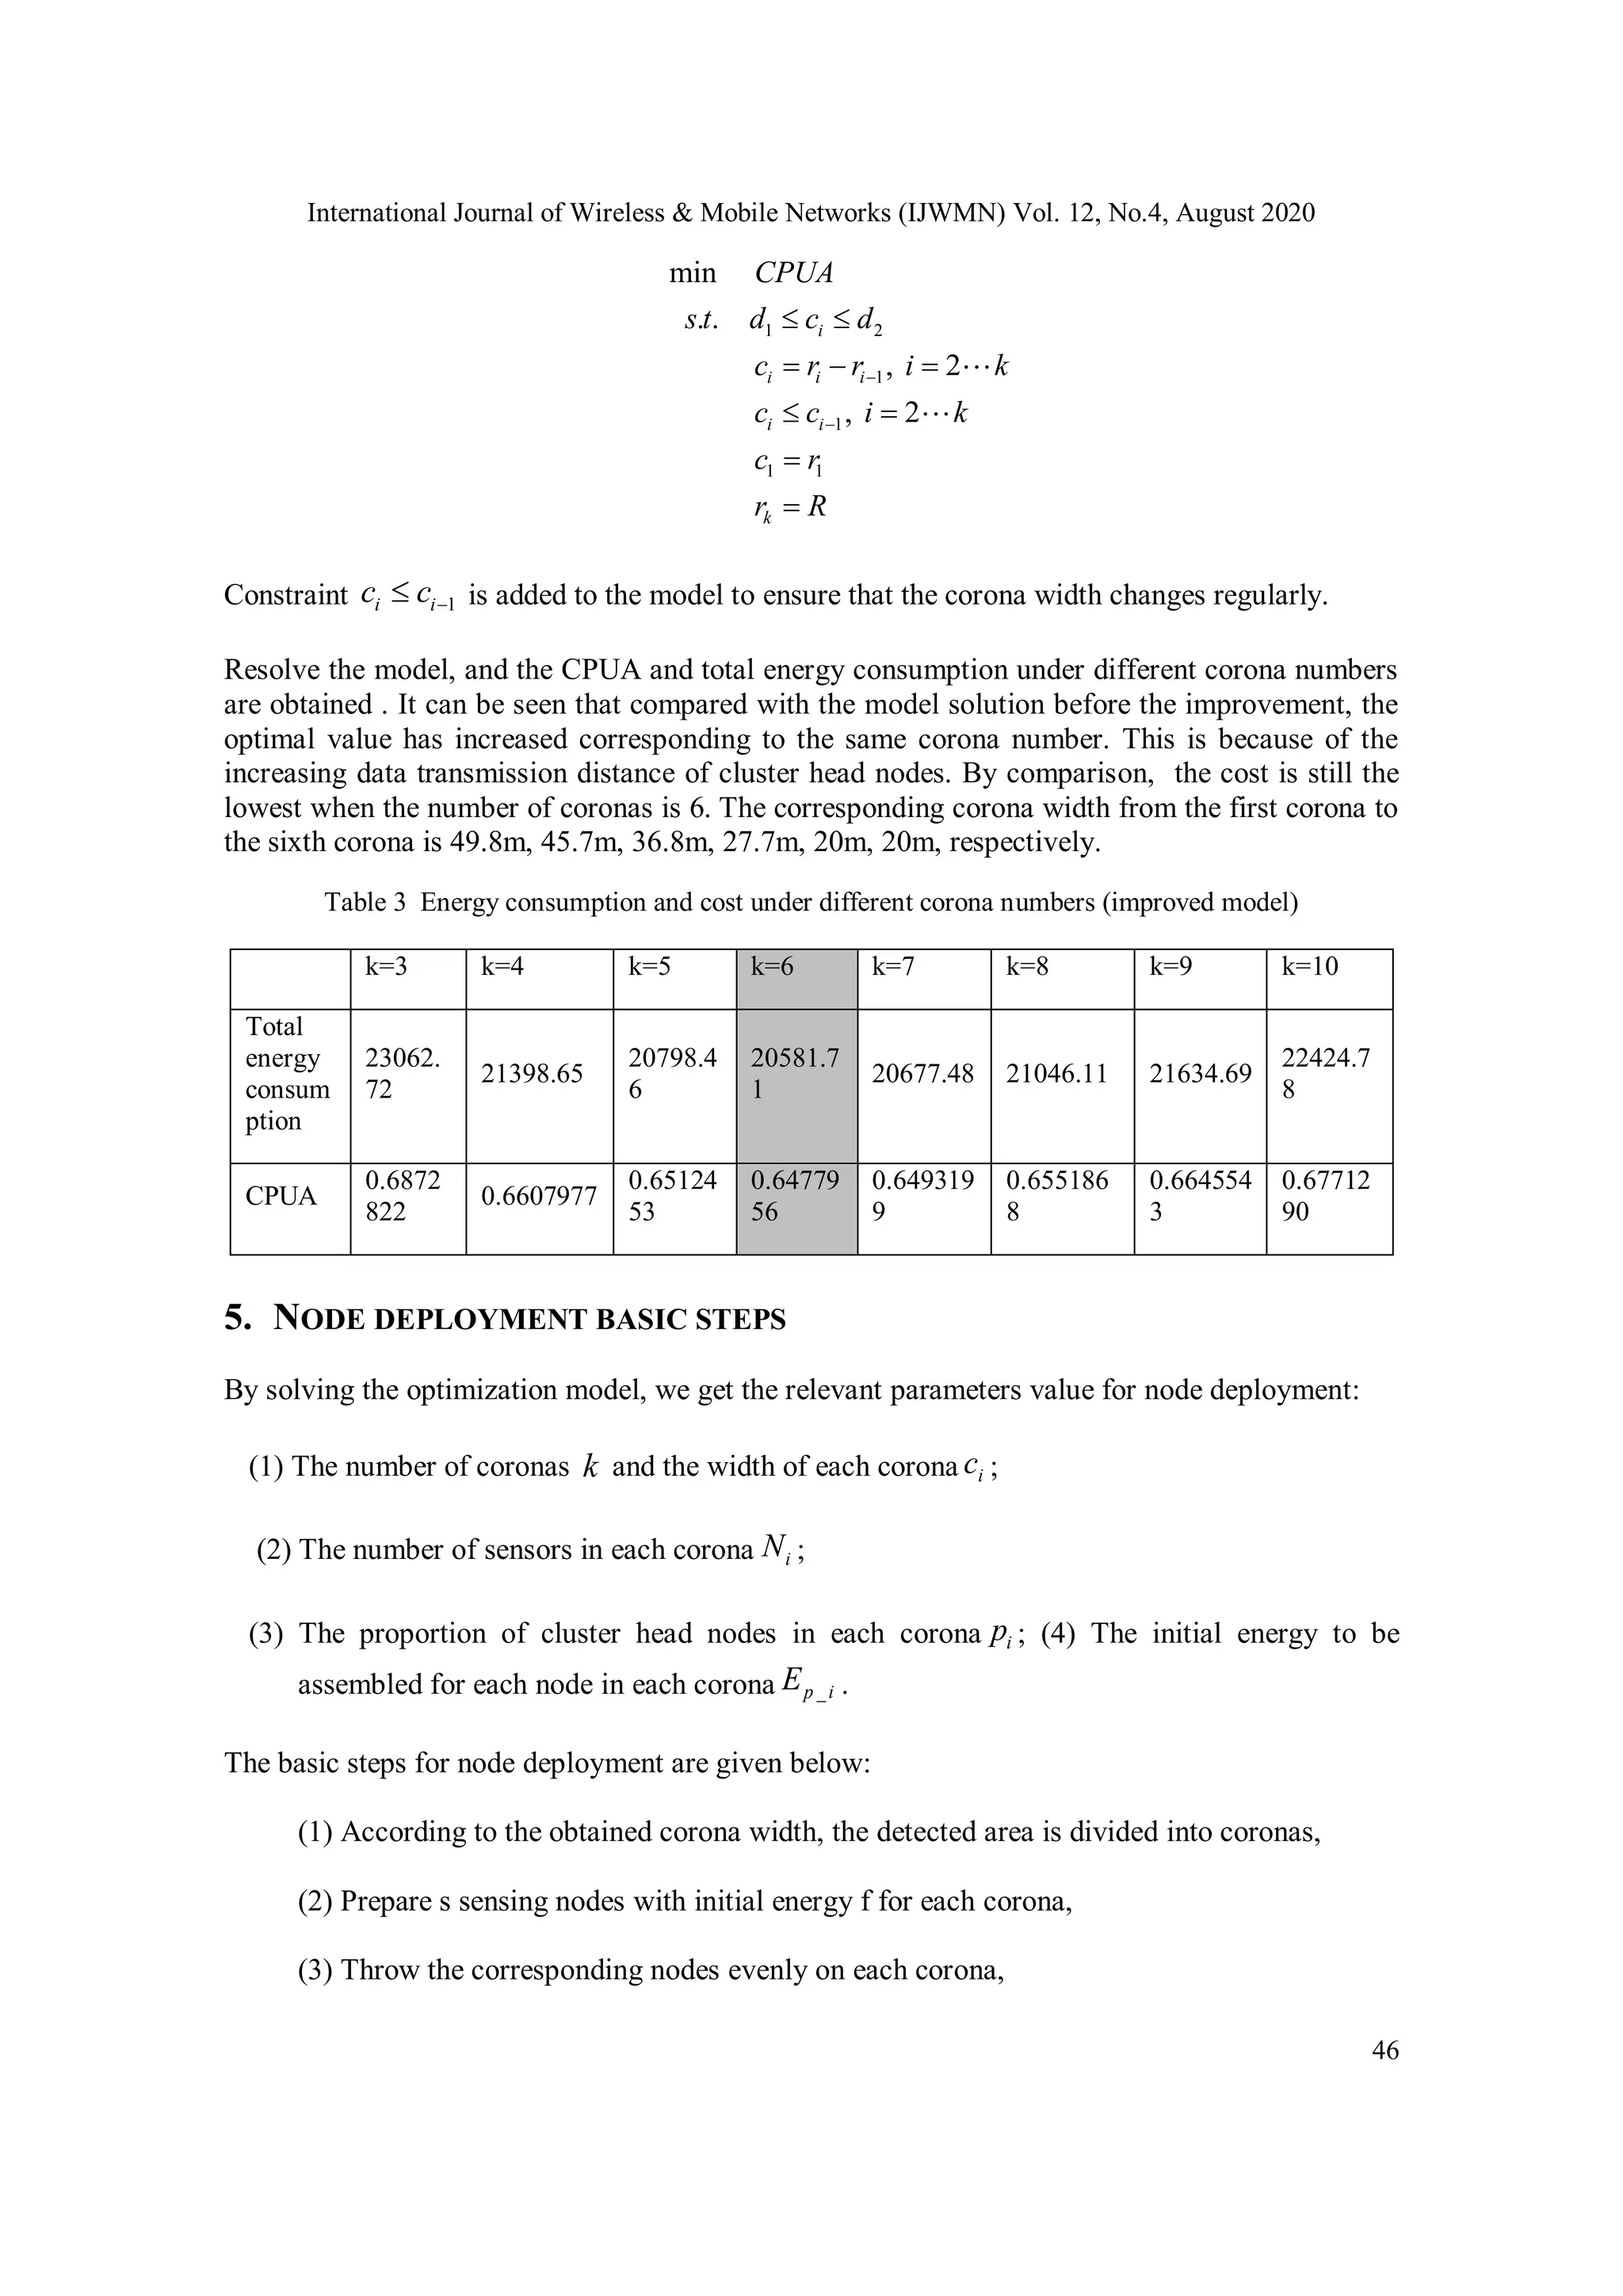
![International Journal of Wireless & Mobile Networks (IJWMN) Vol. 12, No.4, August 2020 45 sixth corona are: 58.5m, 42.3m, 33.9m, 25.3m, 20m, 20m, and the corona width decreases from the inside to the outside. This result is significantly different from the results of many different cluster algorithms[11]. In the EEUC algorithm, the cluster's size far away from the base station is larger than that close to the base station. The main reason is that our deployment strategy assembles different initial energies for the nodes. Table 2 Energy consumption, cost and corona width under different number of coronas k=3 k=4 k=5 k=6 k=7 k=8 k=9 k=10 Total energy consum ption 22817. 15 21171.53 20598.7 7 20395.7 9 20517.97 20924.04 21573.38 22424.78 CPUA 0.6833 738 0.657183 0.64806 72 0.64483 67 0.646781 3 0.653244 1 0.663578 6 0.677129 1 h1 80 70.4 64.8 58.5 52.8 44.9 37.7 20 h2 64.9 51.5 48 42.3 38 32.1 22.3 20 h3 55.1 42.6 39 33.9 29.2 23 20 20 h4 35.5 27 25.3 20 20 20 20 h5 20 20 20 20 20 20 h6 20 20 20 20 20 h7 20 20 20 20 h8 20 20 20 h9 20 20 h10 20 4.3. Model Improvement From the results of the previous model, it can be seen that the width of the outer corona is smaller than the width of the inner corona. In the energy consumption analysis, we set the cluster head node's data transmission distance as the width of its corona, which will lead to uneven energy consumption for different corona's node. To solve this problem, we set the cluster head node's data transmission distance in ith corona as the width of (i-1)th corona -1ic . 2 0 1 3 2 1 1 1 1 1 _ 2 0 1 3 2 -1 1 1 1 1 ( 1) (e ) , 1 1 1 1 ( 1) (e ) , 2 ch i i i i i e l e l e l ml c e i p p p E e l e l e l ml c e i k p p p , 2 2 2 1 2 1 int _ 2 2 2 1 2 -1 ( ) (2 ), 1 ( ) (2 ), 2 i er i i i R r ml e e c i E R r ml e e c i k By replacing _ch iE and int _er iE in CPUA with the _ch iE , and int _er iE , we get the CPUA, and the improved optimization model can be obtained:](https://image.slidesharecdn.com/12420ijwmn03-200910121802/75/A-NODE-DEPLOYMENT-MODEL-WITH-VARIABLE-TRANSMISSION-DISTANCE-FOR-WIRELESS-SENSOR-NETWORKS-9-2048.jpg)
![International Journal of Wireless & Mobile Networks (IJWMN) Vol. 12, No.4, August 2020 47 (4) Each corona generates cluster heads, forms clusters, and starts data collection and transmission. The fourth step above includes the generation and update mechanism of cluster heads and the data routing method between cluster heads, which has an important impact on the normal operation and energy consumption of the network. The previous optimization model does not cover these contents, which becomes our main work in the next step. 6. CONCLUSIONS A node deployment method with variable transmission distance is proposed to minimize the network cost. We adopt the network structure based on "corona+cluster". The data transmission distance of the sensor can be adjusted. Sensors located in different coronas form clusters of different sizes. The nodes in different coronas are equipped with different initial energy. Based on the analysis of node energy consumption and network cost, an optimization model to minimize cost is proposed. The number of coronas and the optimal transmission distance of nodes can be determined by solving the model. It is found that the node's transmission distance gradually increases from the outer corona to the inner corona. For the energy consumption balance of the nodes in the same corona, the transmission distance of the cluster head node is revised, and the model is improved. On this basis, the steps of network node deployment are proposed 7. DISCUSSION The sensors used have various characteristics in this study, such as adjustable data transmission distance and assembled with different initial energy. These characteristics appeared singly in the existing studies only, and the application of these characteristics can effectively reduce the network cost and improve the network performance. New features can be added in future work as the technology evolves. According to the conclusion of this paper, multi-sink network should be deployed for a large detected area. In this paper, the network lifetime is the ideal design lifetime, in general, while the actual network lifetime will be less than it. The generation and updating mechanism of clusters and the data routing algorithm have an important influence on network lifetime. These two elements will be focused on in future work. 8. ACKNOWLEDGMENTS The paper sincerely thank the anonymous reviewers and the associate editor for valuable and constructive comments to improve the manuscript's quality and organization. This work is supported by grants from the Science and Technology Research Projects of Higher Schools(205020517502) in Hebei Province, China. REFERENCES [1]. Vikrant Sharma, R.B. Patel , H.S. Bhadauria D. Prasad,(2016) Deployment schemes in wireless sensor network to your blanket coverage in large - scale open area: A review, Egyptian Informatics Journal, vol. 17, pp:45-56。](https://image.slidesharecdn.com/12420ijwmn03-200910121802/75/A-NODE-DEPLOYMENT-MODEL-WITH-VARIABLE-TRANSMISSION-DISTANCE-FOR-WIRELESS-SENSOR-NETWORKS-11-2048.jpg)
![International Journal of Wireless & Mobile Networks (IJWMN) Vol. 12, No.4, August 2020 48 [2]. X. Wang, G. Xing, Y. Zhang, C. Lu, R. Pless, & C. D. Gill., (2003) Integrated Coverage and Connectivity Configuration in Wireless Sensor Networks. Proceedings of the First ACM Conference on Embedded Networked Sensor Systems, Los Angeles, CA , pp:28-39. [3]. H. Zhang, & J. C. Hou, (2005) Maintaining Sensing Coverage and Connectivity in Large Sensor Networks. Ad Hoc and Sensor Wireless Networks, vol. 1,no.2, pp: 89-123. [4]. M. R. Senouci and A. Mellouk, (2016)"Random Deployment," in Deploying Wireless Sensor Networks,First ed., Great Britain and the United States: ISTE Press Ltd and Elsevier Ltd , pp.21-34. [5]. H. Wang, H. E. Roman, L. Yuan, Y. Huang, and R. Wang, (2014)"Connectivity, coverage and power consumption in large-scale wireless sensor networks," Computer Networks, vol. 75, pp. 212-225. [6]. H.M. Ammari and S. K. Das,(2008) "Integrated coverage and connectivity in Wireless Sensor Networks:a two-dimensional percolation problem," IEEE Transactions on Computers, vol. 57, no. 10, pp. 1423-1434. [7]. Cuneyt Sevgi, and Altan Kocgit, (2014) "Optimal deployment in randomly deployed heterogeneous WSNs: A connected coverage approach," Journal of Network and Computer Applications, vol.46, pp. 182-197. [8]. Z. Yi, & C. Krishnendu, (2004) “Sensor Deployment and Target Localization in Distributed Sensor Networks”, ACM Transactions on Embedded Computing Systems, vol.3,no.1, pp: 61-91. [9]. S. Chellappan, G. Wenjun, B. Xiaole, X. Dong, M. Bin, and Z. Kaizhong, (2007) “Deploying Wireless Sensor Networks under Limited Mobility Constraints”, IEEE Transactions on Mobile Computing, vol.6, no.10, pp:1142-1157. [10]. Xiaobing Wu, Guihai Chen, Xiaobing Wu, and Guihai Chen, (2008) “Avoiding Energy Holes in Wireless Sensor Networks with Nonuniform Node Distribution”,IEEE TRANSACTIONS ON PARALLEL AND DISTRIBUTED SYSTEMS, MAY, vol.19,no.5, pp:710-720. [11]. Guoxi Ma and Zhengsu Tao, (2013) “A Nonuniform Sensor Distribution Strategy forAvoiding Energy Holes in Wireless Sensor Networks”,. International Journal of Distributed Sensor Networks, Article ID 564386, 14 pages. [12]. Kenan Xu, Hossam Hassanein, and Glen Takahara, (2010) “Relay Node Deployment Strategies in Heterogeneous Wireless Sensor Networks”, IEEE Transactions on Mobile Computing,vol.9, no.2, pp: 145 -159. [13]. H. S. Ramos, A. Boukerche, Alyson L.C. Oliveira, Alejandro C. Frery , Eduardo M.R. Oliveira, and Antonio A.F. Loureiro, (2016) "On the deployment of large-scale wireless sensor networks considering the energy hole problem," Computer Networks, vol. 110, no. 9, pp. 154-167. [14]. Fakhrosadat Fanian, and Marjan Kuchaki Rafsanjani, (2019) "Cluster-based routing protocols in wireless sensor networks: A survey based on methodology," Journal of Network and Computer Applications, vol. 142, pp. 111-142. [15]. EM.Ar-Reyouchi, Y.Chatei, K.Ghoumid, M.Hammouti, and B.Hajji,(2017) " Efficient coding techniques algorithm for cluster-heads communication in wireless sensor networks," Elsevier AEU - International Journal of Electronics and Communications, vol. 82, pp. 294-304. [16] Alaa Aadri and Najlae Idrissi,(2017) "A cluster based routing algorithm minimizing energy consumption in wsn",International Journal of Wireless & Mobile Networks (IJWMN) Vol.9, No.4, pp:49-62. [17]. Mihail L. Sichitiu, Rudra Dutta, (2005) “Benefits of Multiple Battery Levels for the Lifetime of LargeWireless Sensor Networks”,Lecture Notes in Computer Science, vol.: 3462, pp:1440-1444. [18]. Yongpan LIU, YiqunWANG, Hengyu LONG, and Huazhong YANG, (2012) “Lifetime-Aware Battery Allocation forWireless Sensor Network under Cost Constraints”, IEICE TRANS. COMMUN., vol.:E95–B(5), pp:1651-1660. [19]. Jagrati Kulshrestha, and Manas Kumar Mishra1, (2018) "Energy balanced data gathering approaches in wireless sensor networks using mixed-hop communication," Computing, vol. 100, pp. 1033--1058. [20]. C. Song, M. Liu, J. Cao, Y. Zheng, H. Gong, and G. Chen, (2009) “Maximizing network lifetime based on transmission range adjustment in wireless sensor networks”, Computer Communications, vol.32,no.11, pp: 1316-1325. [21]. Banu Kabakulak, (2019) "Sensor and sink placement, scheduling and routing algorithms for connected coverage of wireless sensor networks," Ad Hoc Networks, vol. 86, pp. 83-102. [22] T. Shu and M. Krunz, (2010) “Coverage-time optimization for clustered wireless sensor networks: a power-balancing approach”,IEEE/ACM Transactions on Networking, vol.18, no.1,pp: 202-215.](https://image.slidesharecdn.com/12420ijwmn03-200910121802/75/A-NODE-DEPLOYMENT-MODEL-WITH-VARIABLE-TRANSMISSION-DISTANCE-FOR-WIRELESS-SENSOR-NETWORKS-12-2048.jpg)