#include <Graphics\Graphic.mqh>
#include <Math\Stat\T.mqh>
#include <Math\Stat\Math.mqh>
#property script_show_inputs
//--- 输入参数
input double nu_par=10; // 自由度数
//+------------------------------------------------------------------+
//| 脚本程序起始函数 |
//+------------------------------------------------------------------+
void OnStart()
{
//--- 隐藏价格图表
ChartSetInteger(0,CHART_SHOW,false);
//--- 初始化随机数生成器
MathSrand(GetTickCount());
//--- 生成一个随机变量样本
long chart=0;
string name="GraphicNormal";
int n=1000000; // 样本值的数量
int ncells=51; // 直方图区间数
double x[]; // 直方图的区间中心
double y[]; // 区间内样本数量值下降
double data[]; // 随机值样本
double max,min; // 样本的最大最小值
//--- 获得学生t-分布的样本
MathRandomT(nu_par,n,data);
//--- 计算数据来绘制直方图
CalculateHistogramArray(data,x,y,max,min,ncells);
//--- 获得序列边界和绘制理论曲线的步骤
double step;
GetMaxMinStepValues(max,min,step);
step=MathMin(step,(max-min)/ncells);
//--- 获得[min,max]区间的理论计算数据
double x2[];
double y2[];
MathSequence(min,max,step,x2);
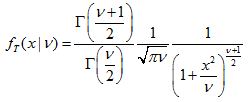
MathProbabilityDensityT(x2,nu_par,false,y2);
//--- 设定比例
double theor_max=y2[ArrayMaximum(y2)];
double sample_max=y[ArrayMaximum(y)];
double k=sample_max/theor_max;
for(int i=0; i<ncells; i++)
y[i]/=k;
//--- 输出图表
CGraphic graphic;
if(ObjectFind(chart,name)<0)
graphic.Create(chart,name,0,0,0,780,380);
else
graphic.Attach(chart,name);
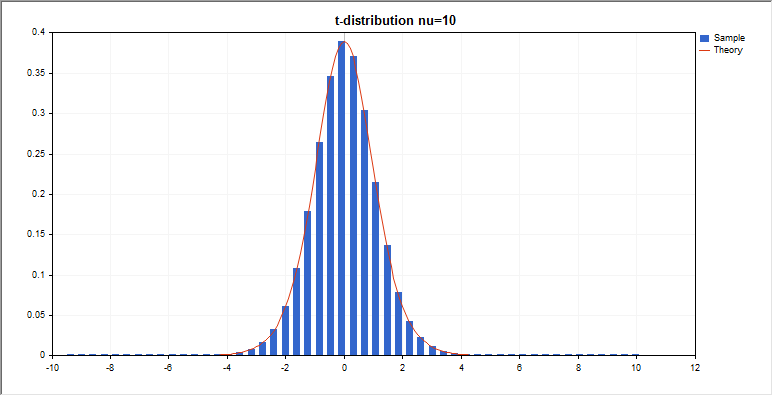
graphic.BackgroundMain(StringFormat("t-distribution nu=%G",nu_par));
graphic.BackgroundMainSize(16);
//--- 绘制全部曲线
graphic.CurveAdd(x,y,CURVE_HISTOGRAM,"Sample").HistogramWidth(6);
//--- 现在绘制分布密度的理论曲线
graphic.CurveAdd(x2,y2,CURVE_LINES,"Theory");
graphic.CurvePlotAll();
//--- 绘制全部曲线
graphic.Update();
}
//+------------------------------------------------------------------+
//| 计算数据集的频率 |
//+------------------------------------------------------------------+
bool CalculateHistogramArray(const double &data[],double &intervals[],double &frequency[],
double &maxv,double &minv,const int cells=10)
{
if(cells<=1) return (false);
int size=ArraySize(data);
if(size<cells*10) return (false);
minv=data[ArrayMinimum(data)];
maxv=data[ArrayMaximum(data)];
double range=maxv-minv;
double width=range/cells;
if(width==0) return false;
ArrayResize(intervals,cells);
ArrayResize(frequency,cells);
//--- 定义区间中心
for(int i=0; i<cells; i++)
{
intervals[i]=minv+(i+0.5)*width;
frequency[i]=0;
}
//--- 填充区间内下降的频率
for(int i=0; i<size; i++)
{
int ind=int((data[i]-minv)/width);
if(ind>=cells) ind=cells-1;
frequency[ind]++;
}
return (true);
}
//+------------------------------------------------------------------+
//| 计算序列生成值 |
//+------------------------------------------------------------------+
void GetMaxMinStepValues(double &maxv,double &minv,double &stepv)
{
//--- 计算序列的绝对范围获得标准化精度
double range=MathAbs(maxv-minv);
int degree=(int)MathRound(MathLog10(range));
//--- 标准化指定精度的最大和最小值
maxv=NormalizeDouble(maxv,degree);
minv=NormalizeDouble(minv,degree);
//--- 也基于指定精度设置序列生成步骤
stepv=NormalizeDouble(MathPow(10,-degree),degree);
if((maxv-minv)/stepv<10)
stepv/=10.;
} |