//--- description
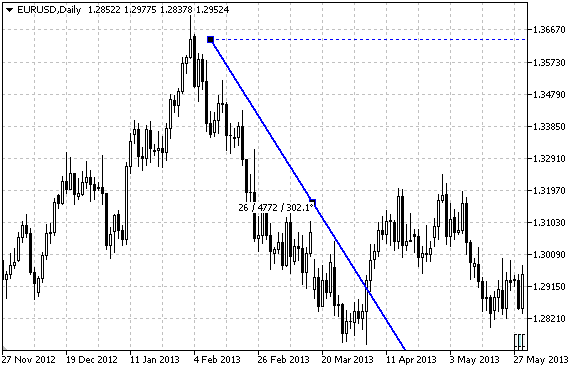
#property description "Script draws \"Trend Line By Angle\" graphical object."
#property description "Anchor point coordinates are set in percentage of the size of"
#property description "the chart window."
//--- display window of the input parameters during the script's launch
#property script_show_inputs
//--- input parameters of the script
input string InpName="Trend"; // Line name
input int InpDate1=50; // 1 st point's date, %
input int InpPrice1=75; // 1 st point's price, %
input int InpAngle=0; // Line's slope angle
input color InpColor=clrRed; // Line color
input ENUM_LINE_STYLE InpStyle=STYLE_DASH; // Line style
input int InpWidth=2; // Line width
input bool InpBack=false; // Background line
input bool InpSelection=true; // Highlight to move
input bool InpRayLeft=false; // Line's continuation to the left
input bool InpRayRight=true; // Line's continuation to the right
input bool InpHidden=true; // Hidden in the object list
input long InpZOrder=0; // Priority for mouse click
//+------------------------------------------------------------------+
//| Create a trend line by angle |
//+------------------------------------------------------------------+
bool TrendByAngleCreate(const long chart_ID=0, // chart's ID
const string name="TrendLine", // line name
const int sub_window=0, // subwindow index
datetime time=0, // point time
double price=0, // point price
const double angle=45.0, // slope angle
const color clr=clrRed, // line color
const ENUM_LINE_STYLE style=STYLE_SOLID, // line style
const int width=1, // line width
const bool back=false, // in the background
const bool selection=true, // highlight to move
const bool ray_left=false, // line's continuation to the left
const bool ray_right=true, // line's continuation to the right
const bool hidden=true, // hidden in the object list
const long z_order=0) // priority for mouse click
{
//--- create the second point to facilitate dragging the trend line by mouse
datetime time2=0;
double price2=0;
//--- set anchor points' coordinates if they are not set
ChangeTrendEmptyPoints(time,price,time2,price2);
//--- reset the error value
ResetLastError();
//--- create a trend line using 2 points
if(!ObjectCreate(chart_ID,name,OBJ_TRENDBYANGLE,sub_window,time,price,time2,price2))
{
Print(__FUNCTION__,
": failed to create a trend line! Error code = ",GetLastError());
return(false);
}
//--- change trend line's slope angle; when changing the angle, coordinates of the second
//--- point of the line are redefined automatically according to the angle's new value
ObjectSetDouble(chart_ID,name,OBJPROP_ANGLE,angle);
//--- set line color
ObjectSetInteger(chart_ID,name,OBJPROP_COLOR,clr);
//--- set line style
ObjectSetInteger(chart_ID,name,OBJPROP_STYLE,style);
//--- set line width
ObjectSetInteger(chart_ID,name,OBJPROP_WIDTH,width);
//--- display in the foreground (false) or background (true)
ObjectSetInteger(chart_ID,name,OBJPROP_BACK,back);
//--- enable (true) or disable (false) the mode of moving the line by mouse
//--- when creating a graphical object using ObjectCreate function, the object cannot be
//--- highlighted and moved by default. Inside this method, selection parameter
//--- is true by default making it possible to highlight and move the object
ObjectSetInteger(chart_ID,name,OBJPROP_SELECTABLE,selection);
ObjectSetInteger(chart_ID,name,OBJPROP_SELECTED,selection);
//--- enable (true) or disable (false) the mode of continuation of the line's display to the left
ObjectSetInteger(chart_ID,name,OBJPROP_RAY_LEFT,ray_left);
//--- enable (true) or disable (false) the mode of continuation of the line's display to the right
ObjectSetInteger(chart_ID,name,OBJPROP_RAY_RIGHT,ray_right);
//--- hide (true) or display (false) graphical object name in the object list
ObjectSetInteger(chart_ID,name,OBJPROP_HIDDEN,hidden);
//--- set the priority for receiving the event of a mouse click in the chart
ObjectSetInteger(chart_ID,name,OBJPROP_ZORDER,z_order);
//--- successful execution
return(true);
}
//+------------------------------------------------------------------+
//| Change trend line anchor point's coordinates |
//+------------------------------------------------------------------+
bool TrendPointChange(const long chart_ID=0, // chart's ID
const string name="TrendLine", // line name
datetime time=0, // anchor point time coordinate
double price=0) // anchor point price coordinate
{
//--- if point position is not set, move it to the current bar having Bid price
if(!time)
time=TimeCurrent();
if(!price)
price=SymbolInfoDouble(Symbol(),SYMBOL_BID);
//--- reset the error value
ResetLastError();
//--- move trend line's anchor point
if(!ObjectMove(chart_ID,name,0,time,price))
{
Print(__FUNCTION__,
": failed to move the anchor point! Error code = ",GetLastError());
return(false);
}
//--- successful execution
return(true);
}
//+------------------------------------------------------------------+
//| Change trend line's slope angle |
//+------------------------------------------------------------------+
bool TrendAngleChange(const long chart_ID=0, // chart's ID
const string name="TrendLine", // trend line name
const double angle=45) // trend line's slope angle
{
//--- reset the error value
ResetLastError();
//--- change trend line's slope angle
if(!ObjectSetDouble(chart_ID,name,OBJPROP_ANGLE,angle))
{
Print(__FUNCTION__,
": failed to change the line's slope angle! Error code = ",GetLastError());
return(false);
}
//--- successful execution
return(true);
}
//+------------------------------------------------------------------+
//| Delete the trend line |
//+------------------------------------------------------------------+
bool TrendDelete(const long chart_ID=0, // chart's ID
const string name="TrendLine") // line name
{
//--- reset the error value
ResetLastError();
//--- delete a trend line
if(!ObjectDelete(chart_ID,name))
{
Print(__FUNCTION__,
": failed to delete a trend line! Error code = ",GetLastError());
return(false);
}
//--- successful execution
return(true);
}
//+------------------------------------------------------------------+
//| Check the values of trend line's anchor points and set default |
//| values for empty ones |
//+------------------------------------------------------------------+
void ChangeTrendEmptyPoints(datetime &time1,double &price1,
datetime &time2,double &price2)
{
//--- if the first point's time is not set, it will be on the current bar
if(!time1)
time1=TimeCurrent();
//--- if the first point's price is not set, it will have Bid value
if(!price1)
price1=SymbolInfoDouble(Symbol(),SYMBOL_BID);
//--- set coordinates of the second, auxiliary point
//--- the second point will be 9 bars left and have the same price
datetime second_point_time[10];
CopyTime(Symbol(),Period(),time1,10,second_point_time);
time2=second_point_time[0];
price2=price1;
}
//+------------------------------------------------------------------+
//| Script program start function |
//+------------------------------------------------------------------+
void OnStart()
{
//--- check correctness of the input parameters
if(InpDate1<0 || InpDate1>100 || InpPrice1<0 || InpPrice1>100)
{
Print("Error! Incorrect values of input parameters!");
return;
}
//--- number of visible bars in the chart window
int bars=(int)ChartGetInteger(0,CHART_VISIBLE_BARS);
//--- price array size
int accuracy=1000;
//--- arrays for storing the date and price values to be used
//--- for setting and changing line anchor points' coordinates
datetime date[];
double price[];
//--- memory allocation
ArrayResize(date,bars);
ArrayResize(price,accuracy);
//--- fill the array of dates
ResetLastError();
if(CopyTime(Symbol(),Period(),0,bars,date)==-1)
{
Print("Failed to copy time values! Error code = ",GetLastError());
return;
}
//--- fill the array of prices
//--- find the highest and lowest values of the chart
double max_price=ChartGetDouble(0,CHART_PRICE_MAX);
double min_price=ChartGetDouble(0,CHART_PRICE_MIN);
//--- define a change step of a price and fill the array
double step=(max_price-min_price)/accuracy;
for(int i=0;i<accuracy;i++)
price[i]=min_price+i*step;
//--- define points for drawing the line
int d1=InpDate1*(bars-1)/100;
int p1=InpPrice1*(accuracy-1)/100;
//--- create a trend line
if(!TrendByAngleCreate(0,InpName,0,date[d1],price[p1],InpAngle,InpColor,InpStyle,
InpWidth,InpBack,InpSelection,InpRayLeft,InpRayRight,InpHidden,InpZOrder))
{
return;
}
//--- redraw the chart and wait for 1 second
ChartRedraw();
Sleep(1000);
//--- now, move and rotate the line
//--- loop counter
int v_steps=accuracy/2;
//--- move the anchor point and change the line's slope angle
for(int i=0;i<v_steps;i++)
{
//--- use the following value
if(p1>1)
p1-=1;
//--- move the point
if(!TrendPointChange(0,InpName,date[d1],price[p1]))
return;
if(!TrendAngleChange(0,InpName,18*(i+1)))
return;
//--- check if the script's operation has been forcefully disabled
if(IsStopped())
return;
//--- redraw the chart
ChartRedraw();
}
//--- 1 second of delay
Sleep(1000);
//--- delete from the chart
TrendDelete(0,InpName);
ChartRedraw();
//--- 1 second of delay
Sleep(1000);
//---
} |