MetaTrader 5 / Indicators
PTB - indicator for MetaTrader 5
8265
Indicator Description: PTB.mq5
- Overview:
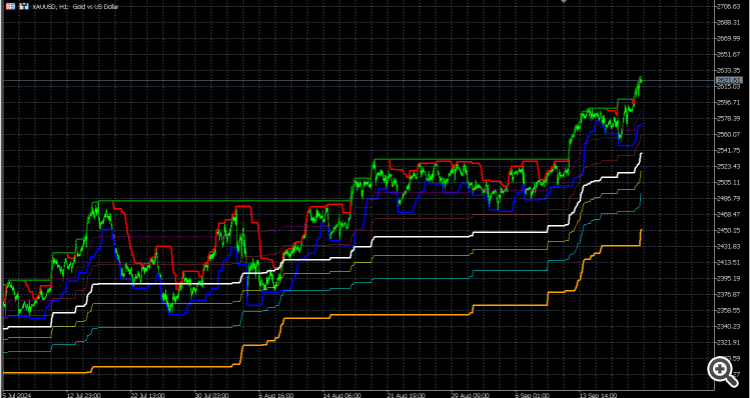
The PTB.mq5 indicator is designed for use in the MetaTrader 5 trading platform. It calculates and displays short-term and long-term high and low levels, along with Fibonacci retracement levels based on these extremes.
- Features:
- Short-Term High and Low: The indicator computes the highest and lowest prices over a user-defined short length, which can help traders identify immediate support and resistance levels.
- Long-Term High and Low: It also calculates the highest and lowest prices over a longer period, providing insights into broader market trends.
- Fibonacci Levels: The indicator plots important Fibonacci retracement levels (23.6%, 38.2%, 50%, 61.8%, and 78.6%) based on the long-term high and low, which are widely used by traders to identify potential reversal points in the market.
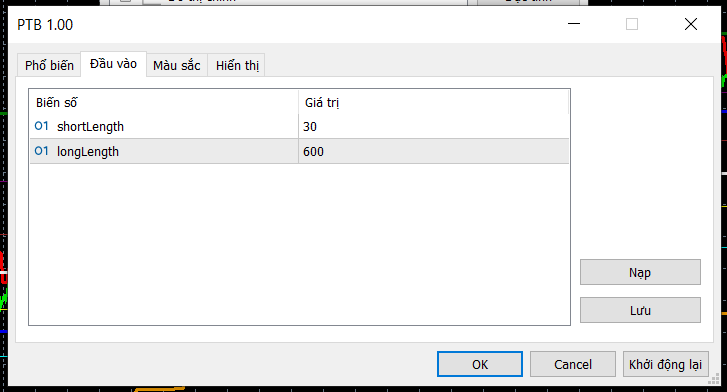
- Input Parameters:
- shortLength: The number of candles to consider for calculating short-term high and low.
- longLength: The number of candles to consider for calculating long-term high and low.
- Visual Representation:
- The indicator uses distinct colors and widths for different plotted lines:
- Short High: Red (width: 3)
- Short Low: Blue (width: 3)
- Long High: Green (width: 3)
- Long Low: Orange (width: 3)
- Fibonacci Levels:
- 78.6%: Purple (width: 1)
- 23.6%: Aqua (width: 1)
- 38.2%: Yellow (width: 1)
- 61.8%: Brown (width: 1)
- 50%: White (width: 3)
- Calculation Logic:
- The indicator iterates over the price data to compute the highest and lowest values for both short and long periods.
- It then calculates the Fibonacci levels based on the difference between the long-term high and low.