


InfluxDB 3 OSS is now GA. Transform, enrich, and act on time series data directly in the database. Automate critical tasks and eliminate the need to move data externally. Download now. Learn more →
Top 23 JavaScript D3 Projects
-
acko.net is one I thought of immediately too. The front page for Three.js usually has some nice examples too.
Of course, with WebGL and WebGPU support becoming ever more ubiquitous I'm not sure when 'impressive 3D website' just becomes either 'impressive website' or 'impressive 3D'.
[1] https://threejs.org/
-
SurveyJS
SurveyJS: Build JSON-Driven Surveys and Forms with Full Data Control. Add the SurveyJS UI components to your JS app (React/Angular/Vue3). Securely collect and analyze data without sending it to 3rd-party servers. Fully customizable, works with any backend, and ideal for data-heavy apps. Learn more.

-
I also chucked in some extra fluff, like a csv download and a couple of charts provided by my favourite chart library chart.js
-
30-Days-Of-JavaScript
30 days of JavaScript programming challenge is a step-by-step guide to learn JavaScript programming language in 30 days. This challenge may take more than 100 days, please just follow your own pace. These videos may help too: https://www.youtube.com/channel/UC7PNRuno1rzYPb1xLa4yktw
-
p5.js
p5.js is a client-side JS platform that empowers artists, designers, students, and anyone to learn to code and express themselves creatively on the web. It is based on the core principles of Processing. Looking for p5.js 2.0? http://beta.p5js.org
p5.js – JavaScript framework for creative interactive coding
-
It turns out we have many options for graphing libraries. Let’s take a look at D3. It advertises itself as “the JavaScript library for bespoke data visualization,” and is also the base of several other graphing libraries, including Observable Plot (developed by the same team as D3), Vega, and Plotly (we’ll come back to that one). The fact that so many people built other projects on top of D3 should give us an idea of what we’re in for – it’s clearly very useful, but probably not so easy to use.
-
-
paper.js
The Swiss Army Knife of Vector Graphics Scripting – Scriptographer ported to JavaScript and the browser, using HTML5 Canvas. Created by @lehni & @puckey
Paper.js - Vector graphics scripting framework
-
InfluxDB
InfluxDB – Built for High-Performance Time Series Workloads. InfluxDB 3 OSS is now GA. Transform, enrich, and act on time series data directly in the database. Automate critical tasks and eliminate the need to move data externally. Download now.

-
## **Follow-up use case - building a query in a query language that the user may not know** This feature is useful when a user needs to query a tool with its own specific query language or with a structure that the user doesn’t know. AWS seems to be running an A/B test of a feature where you can generate a CloudWatch search query based on a natural language input. 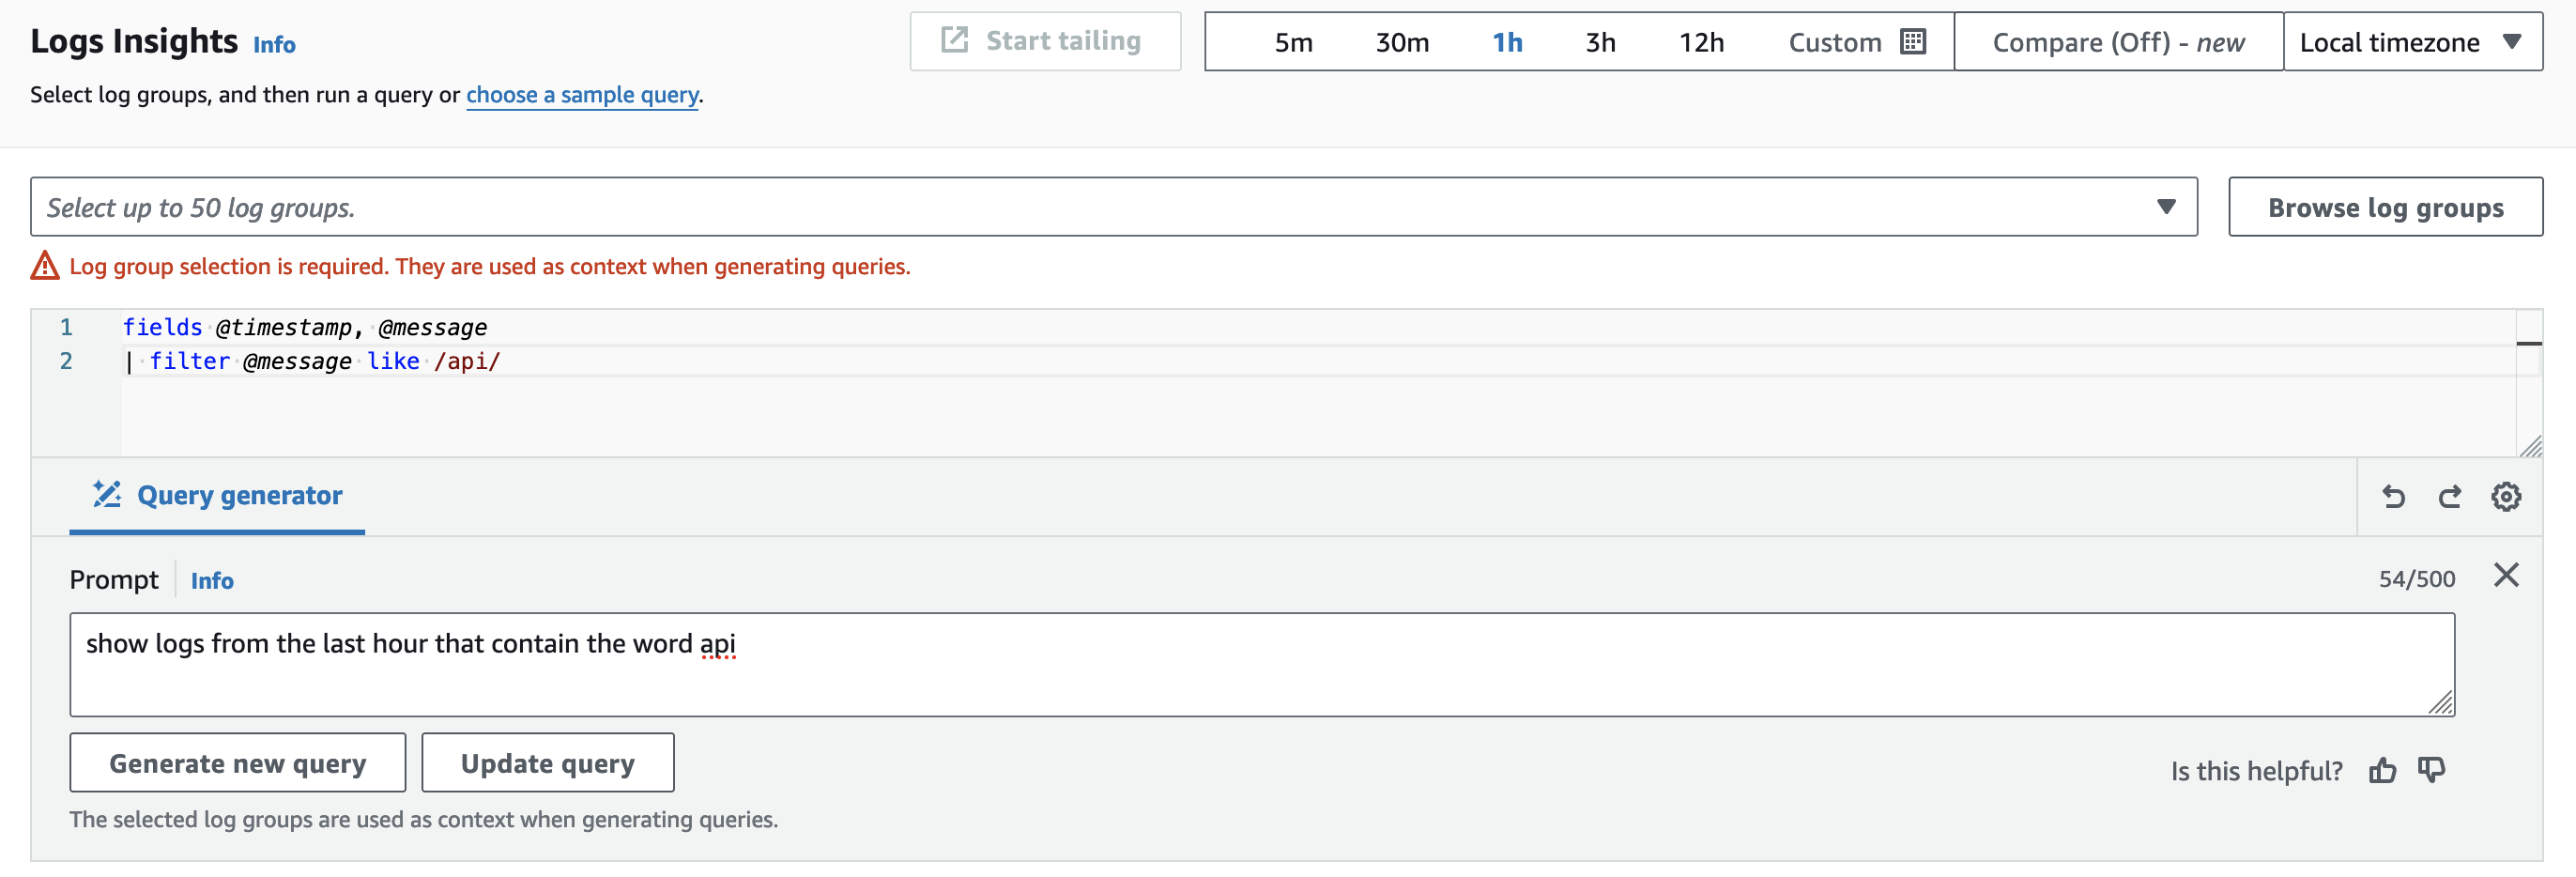 **Use case - data visualization** Interesting use case - you allow users to pull report data (by e.g. querying an ElasticSearch index or a database). This is often combined with visualizing the data. Could we allow the user to also define how they’d like the data presented? Let’s say a manager needs a pie chart for their PowerPoint presentation. Fortunately, there’s a tool called [Vega](https://vega.github.io/vega/) which is a visualization grammar that allows you to define graphs using a JSON schema. It also comes with [Vega-Lite](https://vega.github.io/vega-lite/), which allows us to easily render these charts using JavaScript. There’s also an [interactive playground](https://vega.github.io/editor/#/examples/vega-lite/) that we can use for testing our diagrams. Let’s take [a sample CSV file from Vega-Lite’s demo](https://vega.github.io/editor/data/stocks.csv) that contains the stock prices history of a few tech companies. It will be easy for us to reference it on the playground. The file is a regular CSV that contains a few columns:
-
Locked fps of animation · Issue #1003 · svgdotjs/svg.js - Github
-
-
-
-
-
-
-
-
-
-
-
-
-
-
-
Stream
Stream - Scalable APIs for Chat, Feeds, Moderation, & Video. Stream helps developers build engaging apps that scale to millions with performant and flexible Chat, Feeds, Moderation, and Video APIs and SDKs powered by a global edge network and enterprise-grade infrastructure.

NOTE: The open source projects on this list are ordered by number of github stars. The number of mentions indicates repo mentiontions in the last 12 Months or since we started tracking (Dec 2020).
JavaScript D3 discussion
JavaScript D3 related posts
-
Learning shader effect with Three.js TSL
-
Dev.to Tag Hacking
-
How to Create High-Performance 3D Product Viewers Using Three.js + React for Modern eCommerce Stores
-
How Leo9 Design Reimagined KPIT’s Digital Identity for the Future of Mobility
-
Resources: Data Visualisation
-
Chartly – no code chart creator
-
Project of the Week: Chart.js
- A note from our sponsor - InfluxDB www.influxdata.com | 24 Dec 2025
Index
What are some of the best open-source D3 projects in JavaScript? This list will help you:
| # | Project | Stars |
|---|---|---|
| 1 | three.js | 109,935 |
| 2 | Chart.js | 66,903 |
| 3 | 30-Days-Of-JavaScript | 45,741 |
| 4 | p5.js | 23,267 |
| 5 | plotly.js | 17,999 |
| 6 | Frappe Charts | 15,075 |
| 7 | paper.js | 14,858 |
| 8 | vega | 11,747 |
| 9 | svg.js | 11,722 |
| 10 | raphael | 11,297 |
| 11 | trianglify | 10,100 |
| 12 | c3 | 9,360 |
| 13 | two.js | 8,567 |
| 14 | dc.js | 7,440 |
| 15 | nvd3 | 7,235 |
| 16 | rickshaw | 6,522 |
| 17 | heatmap.js | 6,351 |
| 18 | flot | 5,930 |
| 19 | Frappe Gantt | 5,751 |
| 20 | NN-SVG | 5,643 |
| 21 | cubism | 4,931 |
| 22 | d3-cloud | 3,922 |
| 23 | iD | 3,698 |
Sponsored
SurveyJS: Build JSON-Driven Surveys and Forms with Full Data Control
Add the SurveyJS UI components to your JS app (React/Angular/Vue3). Securely collect and analyze data without sending it to 3rd-party servers. Fully customizable, works with any backend, and ideal for data-heavy apps. Learn more.
surveyjs.io