Matplotlib - Ticks and Tick Labels
Ticks
Ticks are the markers denoting data points on axes. In most situation, it is generally sufficient to let the Matplotlib automatically decide the ticks. However, it is possible to set the ticks explicitly by using Axes.set_xticks() and Axes.set_yticks() functions.
Syntax
#sets the x-axis tick locations Axes.set_xticks(self, ticks, minor=False) #sets the y-axis tick locations Axes.set_yticks(self, ticks, minor=False)
Parameters
ticks | Required. Specify list of tick locations. |
minor | Optional. If False, set the major ticks; if True, the minor ticks. |
Tick Labels
Similarly, labels corresponding to tick marks can be set by using Axes.set_xlabels() and Axes.set_ylabels() functions respectively.
Syntax
#Set the x-axis labels with list of string labels Axes.set_xticklabels(self, labels, minor=False) #Set the y-axis labels with list of string labels Axes.set_yticklabels(self, labels, minor=False)
Parameters
labels | Required. Specify the label texts. |
minor | Optional. If False, set the major ticklabels; if True, the minor ticklabels. |
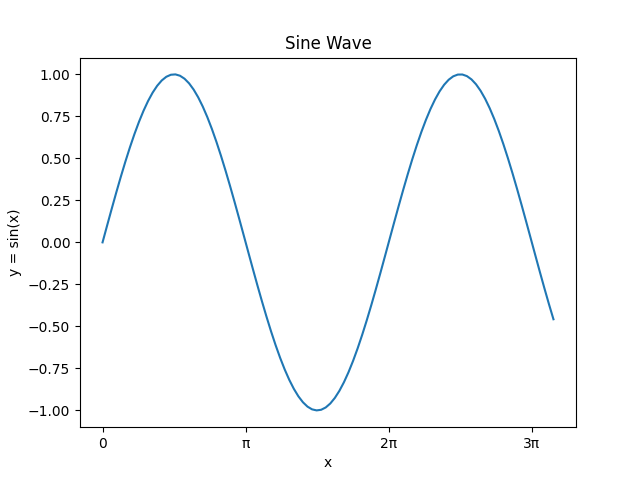
Example: setting ticks and tick labels
In the example below, user-defined ticks and tick labels are used.
import matplotlib.pyplot as plt import numpy as np import math #creating an array of values between #0 to 10 with a difference of 0.1 x = np.arange(0, 10, 0.1) y = np.sin(x) fig, ax = plt.subplots() #plotting curves ax.plot(x, y) #formatting axes ax.set_title("Sine Wave") ax.set_xlabel("x") ax.set_ylabel("y = sin(x)") #setting ticks and tick labels pi = math.pi ax.set_xticks([0, pi, 2*pi, 3*pi]) ax.set_xticklabels(['0', 'π', '2π', '3π']) #displaying the figure plt.show() The output of the above code will be: