Performance metrics are essential for daily database maintenance and troubleshooting. ApsaraDB RDS for MySQL provides multi-dimensional monitoring metrics and visualizations. It also supports anomaly detection and root cause analysis to help you quickly identify and resolve issues.
Features
On the Performance Trend page, you can view the following metrics:
Metric Category | Metrics |
Basic metrics | CPU/Memory utilization, Physical memory, Disk utilization, Storage usage, Physical storage usage, Temporary tables, Network traffic, IOPS utilization, IOPS. |
Database metrics | Sessions, Connection usage, transactions per second (TPS)/queries per second (QPS), Executions, SelectScan, Threads, Slow queries, Prepared statements. |
InnoDB storage engine | InnoDB Buffer Pool hit rate, InnoDB Buffer Pool dirty blocks, InnoDB Buffer Pool request rate, InnoDB Data read/write throughput, InnoDB row locks, InnoDB memory pages, Disk flushes, Rows sorted per second, InnoDB Row Operations, InnoDB Redo log writes, InnoDB Redo log write requests. |
MyISAM storage engine | MyISAM Key Buffer read/write/utilization rate, MyISAM read/write requests. |
Replication | Node replication thread status, Node replication delay. Note The Replication metrics are supported only for instances of High-availability Edition and Cluster Edition. |
View performance trends
Go to the Instances page. In the top navigation bar, select the region in which the RDS instance resides. Then, find the RDS instance and click the ID of the instance.
In the navigation pane on the left, choose .
On the Dashboard page, perform the following operations:
Query monitoring metrics for a specific time range
Select a time range to view the corresponding monitoring metrics. You can query monitoring data from the last 30 days only.

Enable real-time mode
Click the
 icon before the time range selection box to enable real-time mode. The system automatically refreshes the monitoring metrics every 5 seconds. This lets you view real-time changes in database performance.
Change the monitoring frequency
Set Data Granularity to view metric trends at different time granularities, such as 5 seconds, 30 seconds, or 1 minute.
View metric descriptions
In a metric trend chart, click the
 icon next to a metric to view its sub-metrics and their descriptions.
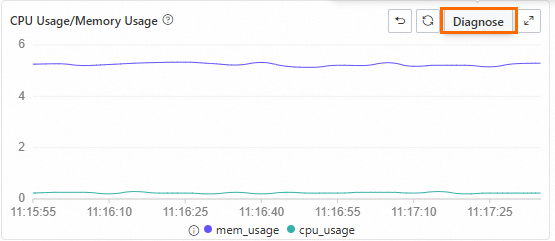
Diagnose and analyze metrics
In any metric trend chart, drag the pointer to select a time range to zoom in on that period. Click the Diagnose button on the chart to diagnose and analyze the metric for the selected time range.
Switch nodes
For ApsaraDB RDS for MySQL instances that use the Cluster Edition, you can select different nodes to view their metrics. You can also select multiple nodes at the same time to compare and analyze their metrics.
NoteClick the Old Version button in the upper-right corner of the Standard Monitoring page to return to the previous version of Performance Trends.
Appendix: Old version of the Performance Trend page
Go to the Instances page. In the top navigation bar, select the region in which the RDS instance resides. Then, find the RDS instance and click the ID of the instance.
In the navigation pane on the left, choose .
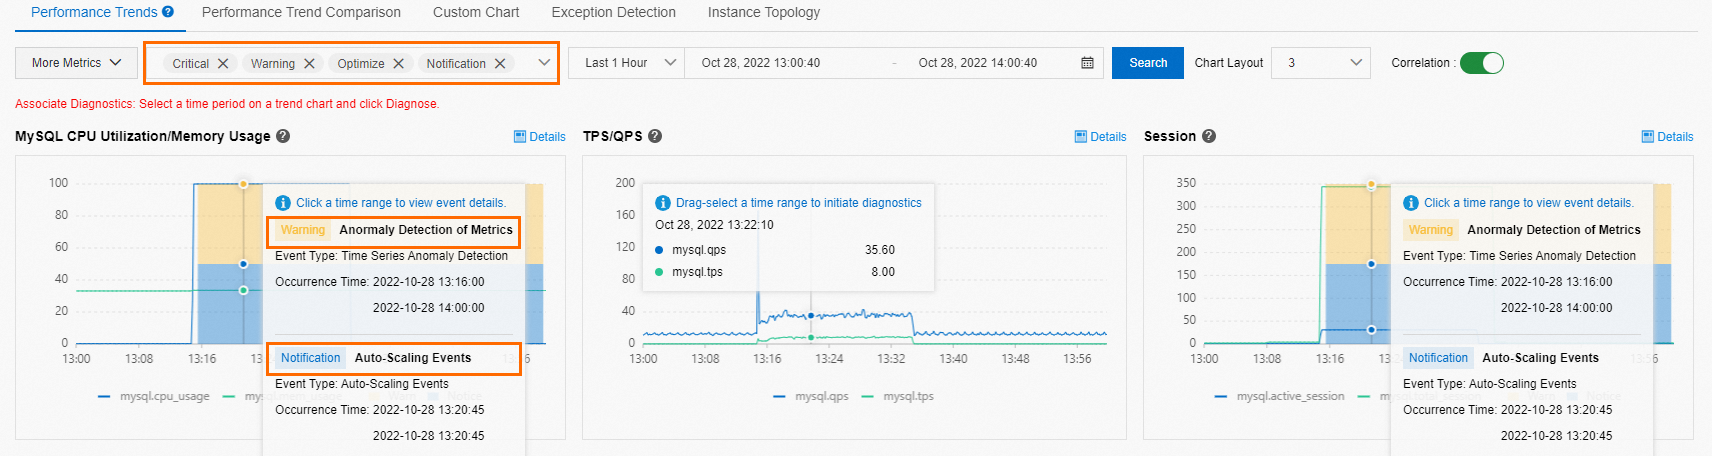
On the Performance Trends tab, you can view the trend charts of metrics within a specific time range.
You can click More Metrics and select the metrics that you want to view.
You can drag and select a time range in the trend chart of a metric and click Diagnose to analyze the performance trend of the metric within the selected time range.
You can click Details in the trend chart of a metric to expand the chart. You can also change the time range to view the change trends of the metric within different time ranges.
Select the level of events that you want to view. When the system detects events at the specified level, the system displays the events in the MySQL CPU Utilization/Memory Usage and Session charts.
You can click an event in a trend chart to view the diagnosis result in the event details.
On the Performance Trend Comparison tab, you can view the comparison of performance trends for a metric within different time ranges.
You can click More Metrics and select the metrics that you want to view.
On the Custom Charts tab, you can create dashboards to display the performance metrics that you want to view. When you create a chart, you can specify multiple performance metrics that you want the chart to display. This way, you can analyze metrics that are displayed on the dashboards and troubleshoot performance issues.
Click Add Monitoring Dashboard. In the Create Monitoring Dashboard dialog box, configure the Dashboard Name parameter and click OK.
Click Select Instances and Metrics, select the required nodes and metrics that you want to view, and then click the
 icon.
icon. Click Confirm.
On the Exception Detection tab, you can view the results of exception detection and predictions for core metrics. For more information, see Performance anomaly detection.
You can click More Metrics and select the metrics based on which you want to detect exceptions.
On the Instance Topology tab, you can view the topology of the instance.
References
Common performance issues:
You can use the autonomy service-related features to perform performance diagnosis and optimization on your RDS instance. For more information, see Overview of DAS.