Managed Service for Prometheus supports service discovery using the ServiceMonitor custom resource definition (CRD). You can use a ServiceMonitor to define the namespace for pod discovery and select Services to monitor with matchLabel. This topic describes how to create a service discovery configuration using a ServiceMonitor for an application that is built on the Spring Boot framework.
Demo
Download the demo project for a complete example of how to create a service discovery configuration using a ServiceMonitor.
Step 1: Add dependencies
Create a Maven application and add the following dependencies to the pom.xml file.
<dependencies> <dependency> <groupId>org.springframework.boot</groupId> <artifactId>spring-boot-starter-actuator</artifactId> </dependency> <dependency> <groupId>org.springframework.boot</groupId> <artifactId>spring-boot-starter-web</artifactId> </dependency> <dependency> <groupId>io.micrometer</groupId> <artifactId>micrometer-registry-prometheus</artifactId> <version>1.6.6</version> </dependency> <dependency> <groupId>org.springframework.boot</groupId> <artifactId>spring-boot-configuration-processor</artifactId> <optional>true</optional> </dependency> <dependency> <groupId>org.projectlombok</groupId> <artifactId>lombok</artifactId> <optional>true</optional> </dependency> <dependency> <groupId>org.springframework.boot</groupId> <artifactId>spring-boot-starter-test</artifactId> <scope>test</scope> </dependency> </dependencies>Add the following configuration to the src/resources/applications.properties file in the project.
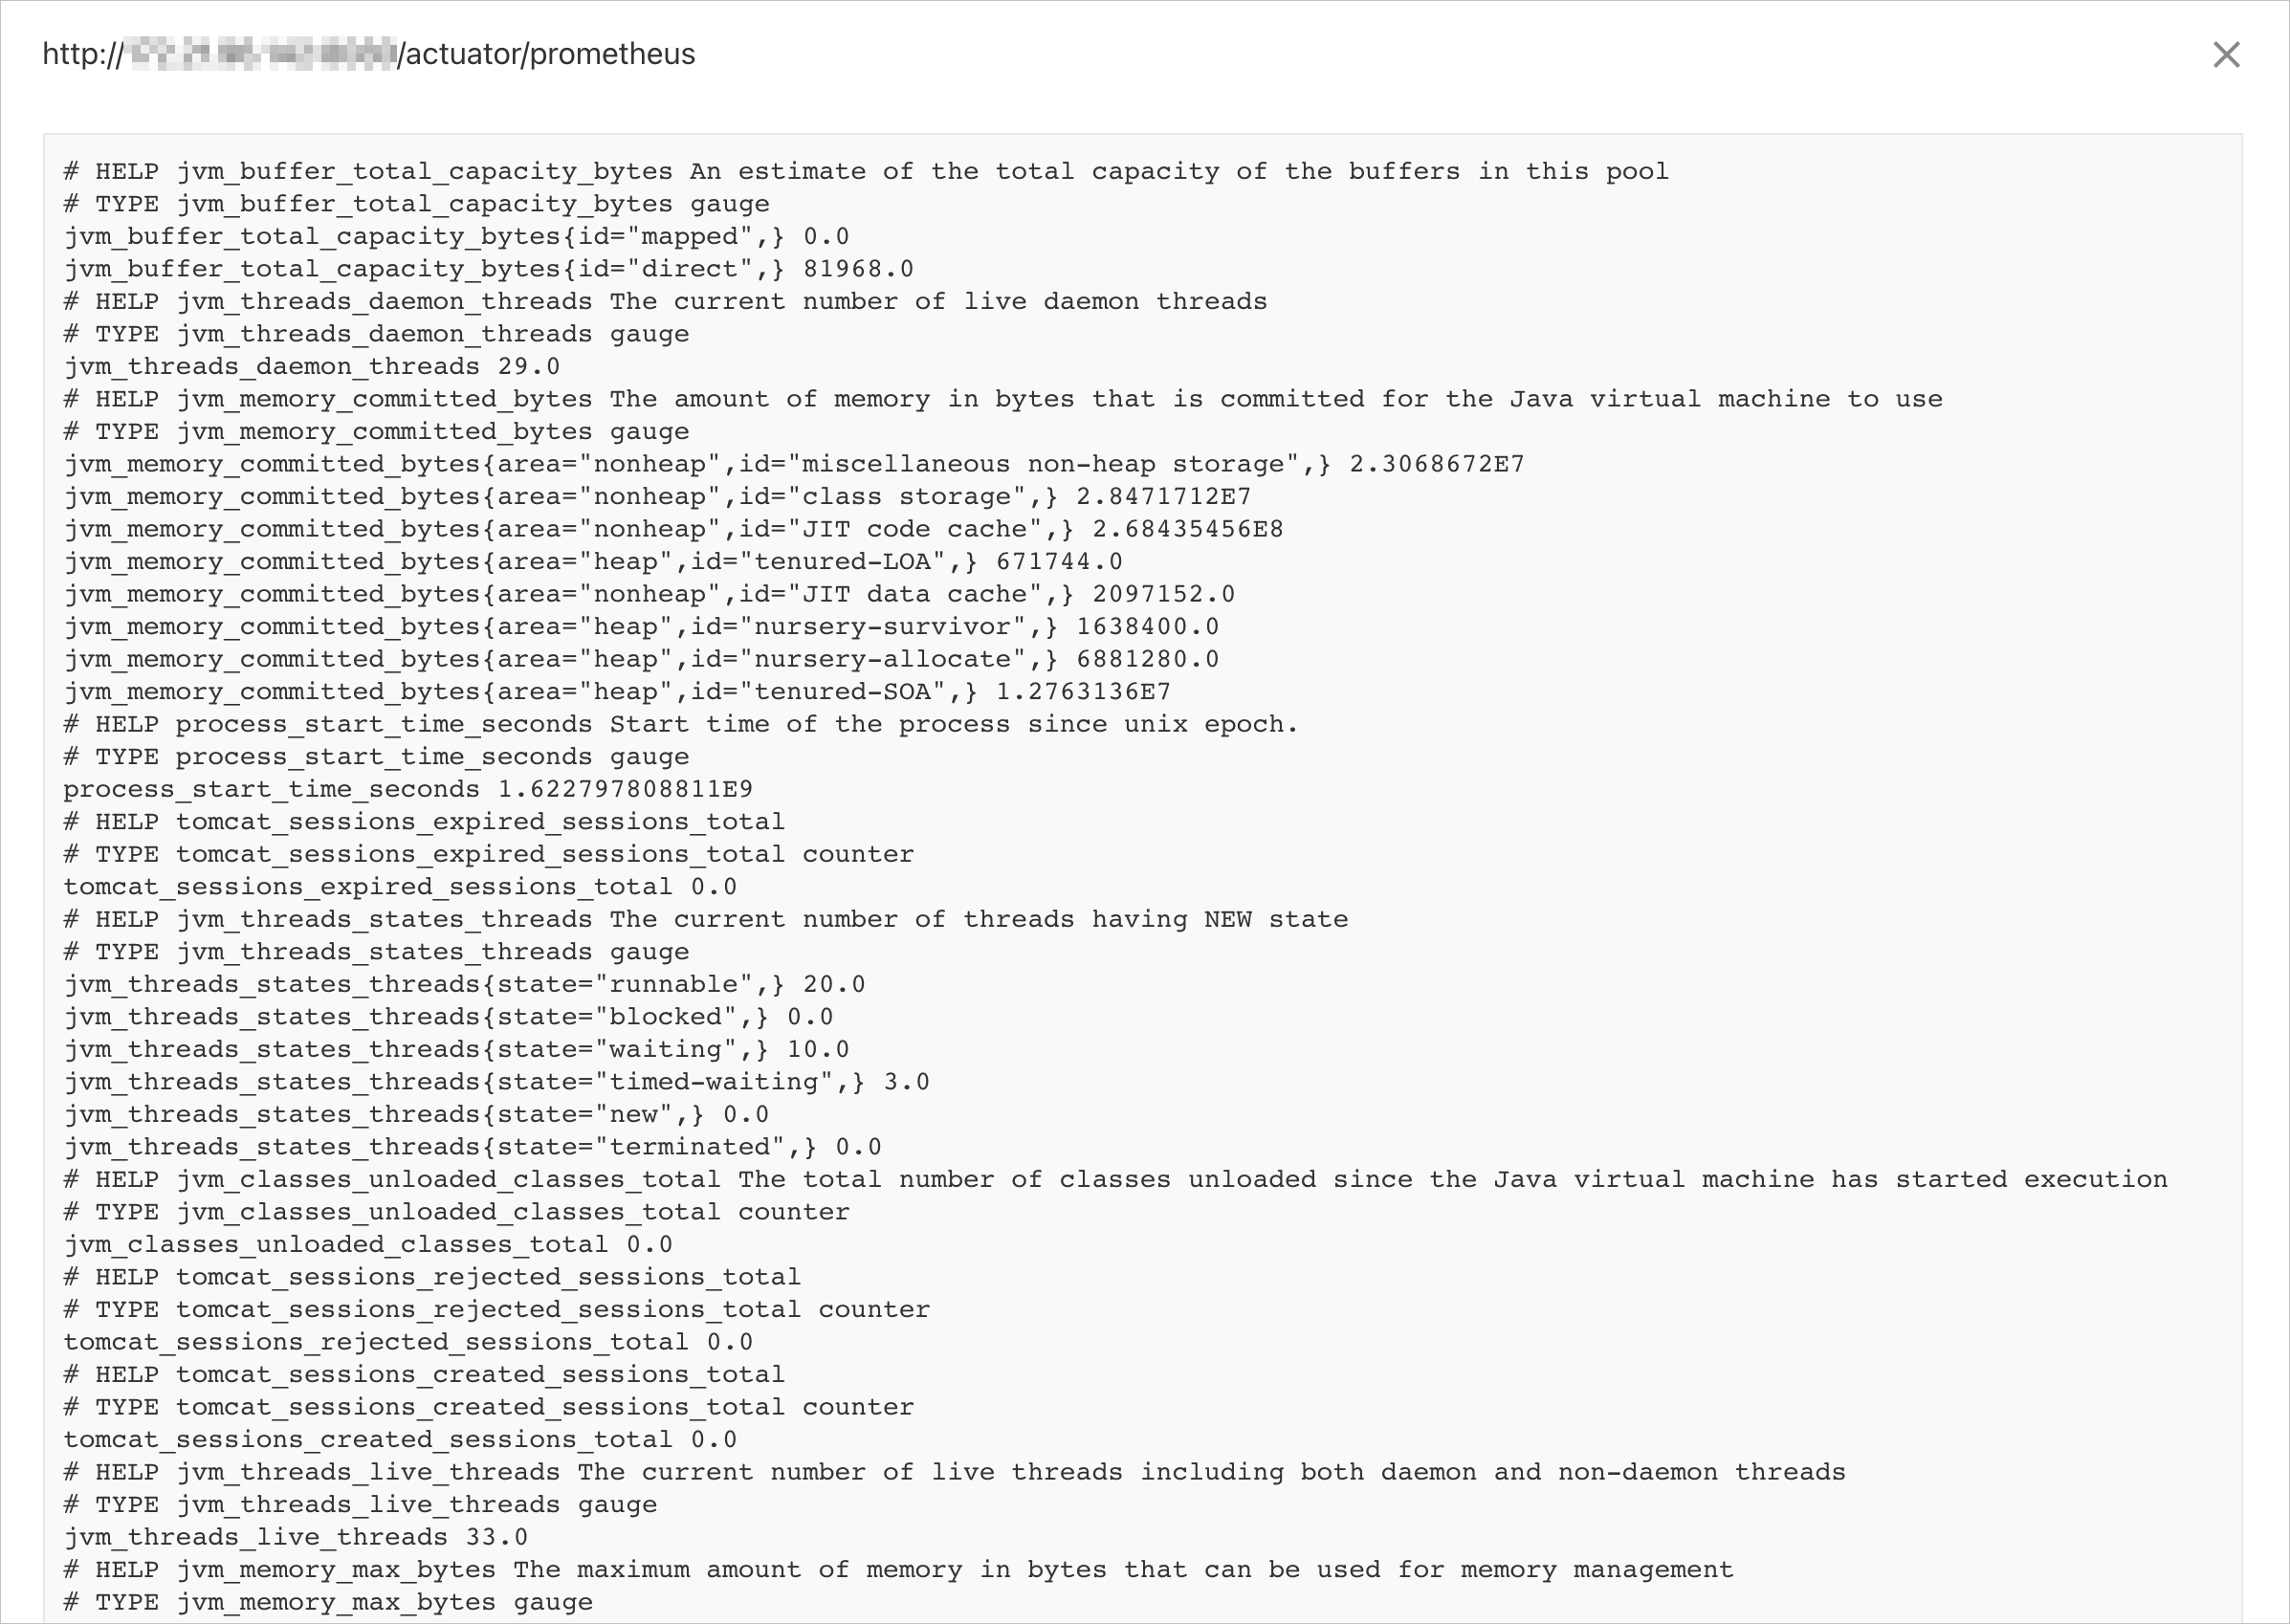
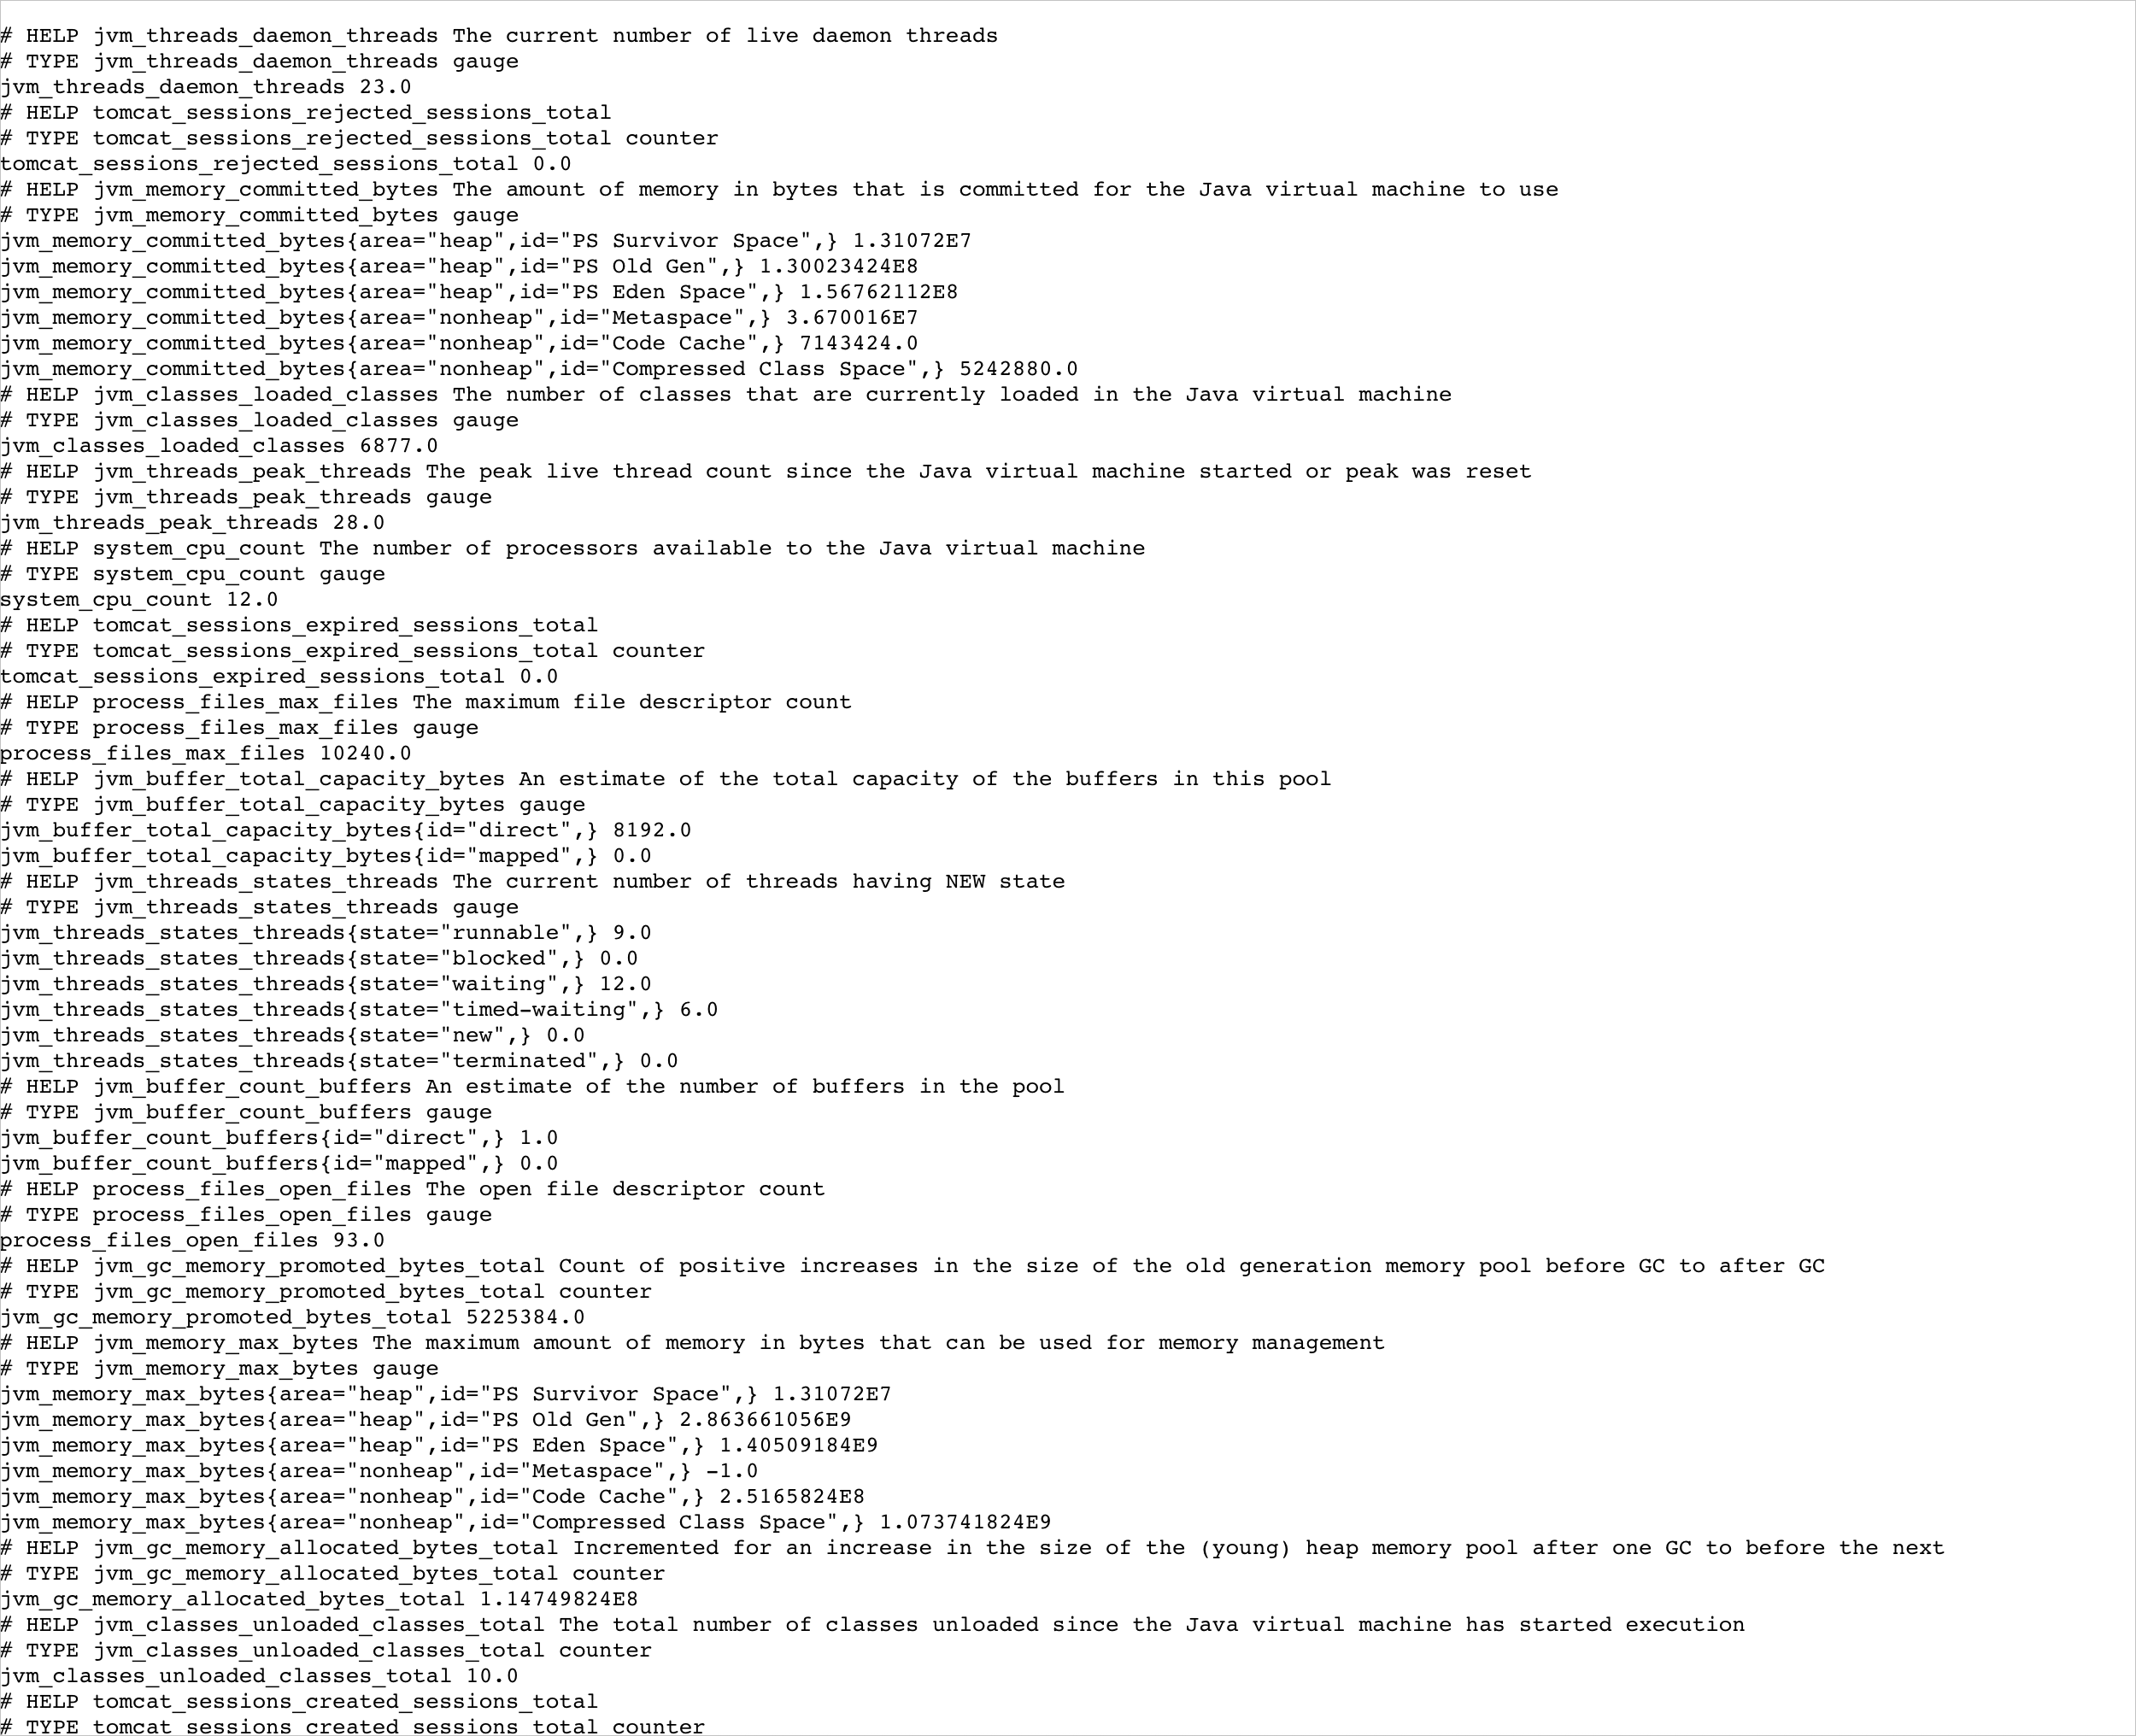
management.endpoints.web.exposure.include=prometheusStart the project and access
http://{host}:{port}/actuator/prometheusin a browser.The monitoring data for the corresponding Java Virtual Machine (JVM) is returned. The following figure shows an example.
Step 2: Deploy a Kubernetes cluster
Build an image and upload it to an image repository. For more information, see Bind a source code hosting platform.
Create a deployment using the following content.
apiVersion: apps/v1 kind: Deployment metadata: name: micrometer-prometheus namespace: default labels: app: demo-prometheus spec: replicas: 3 selector: matchLabels: app: demo-prometheus template: metadata: labels: app: demo-prometheus spec: containers: - name: micrometer-prometheus image: manjusakalza/micrometer-prometheus:latest ports: - containerPort: 8080Create a Service using the following content.
apiVersion: v1 kind: Service metadata: name: prometheus-metrics-demo namespace: default labels: micrometer-prometheus-discovery: 'true' spec: selector: app: demo-prometheus ports: - protocol: TCP port: 8080 targetPort: 8080 name: metrics
Step 3: Create a ServiceMonitor
The following is a sample YAML file for a ServiceMonitor:
apiVersion: monitoring.coreos.com/v1 kind: ServiceMonitor metadata: name: micrometer-demo namespace: default spec: endpoints: - interval: 15s path: /actuator/prometheus port: metrics # Note: Configure the port name, not the port number. namespaceSelector: any: true selector: matchLabels: micrometer-prometheus-discovery: 'true'The fields in this YAML file are described as follows:
The
metadatafieldsnameandnamespacespecify key metadata for the ServiceMonitor.The
specfieldendpointsspecifies the server endpoints from which Prometheus scrapes metrics.endpointsis an array, allowing you to specify multipleendpoints. Eachendpointcontains the following fields:interval: The interval, in seconds, at which Prometheus scrapes theendpoint. This example sets the interval to15s.path: Specifies the scrape path for Prometheus. In this example, the value is set to/actuator/prometheus.port: The name of the port from which to collect metrics. Set this parameter to the value of thenameparameter specified for the Service that you created in Step 2. In this example, this parameter is set tometrics.ImportantSpecify the port name, not the port number.
The
specfieldnamespaceSelectordefines the scope of Services to discover. ThenamespaceSelectorfield contains two mutually exclusive fields:any: The only valid value istrue. When set, changes to all Services that match the selector filter conditions are monitored.matchNames: An array ofnamespacesto monitor. For example, to monitor Services in only the default and arms-prom namespaces, setmatchNamesas follows:namespaceSelector: matchNames: - default - arms-prom
The
specfieldselectoris used to select Services.The Service in this example has the label micrometer-prometheus-discovery: 'true', so the
selectoris set as follows:selector: matchLabels: micrometer-prometheus-discovery: 'true'
You can create a ServiceMonitor for Managed Service for Prometheus in one of the following two ways.
Create a ServiceMonitor using the console
Log on to the Managed Service for Prometheus console. In the left-side navigation pane, click Integration Management.
On the Integrated Environments tab, view the environment list on the Container Service tab. Find the ACK instance and click Metric Scraping in the Actions column.
On the Metric Collection tab, click Service Monitor, and then click Add.
In the Add ServiceMonitor Configuration panel, set the parameters and click Create.
Parameter
Description
Namespace
The namespace where the Service resource resides.
Service
The target Service.
Port
The target port.
Metric Path
The path where the metrics are located.
Scrape Interval
Prometheus scrapes monitoring metrics at the specified interval. The unit is seconds.
Create a ServiceMonitor using a command
Save the YAML file to your computer.
Run the following command to apply the YAML file.
kubectl apply -f {Path of the YAML file}
To use the basic authentication feature, refer to the following YAML file example.
apiVersion: monitoring.coreos.com/v1 kind: ServiceMonitor metadata: name: cloud-open-api-monitor # Set a unique name for the ServiceMonitor. namespace: default # Set the namespace where the ServiceMonitor resides. spec: endpoints: - interval: 30s # Specify the interval at which Prometheus scrapes the current endpoint. port: tcp-8080 # Enter the path exposed in the Prometheus exporter code. path: /api/actuator/prometheus basicAuth: password: name: basic-auth key: <password> username: name: basic-auth key: <userName> scheme: http namespaceSelector: any: true selector: matchLabels: # Match Services with the following label. edas.oam.acname: cloud-open-apiIf you encounter permission errors when you use the basic authentication feature, create a ClusterRole that contains the required permissions in the cluster. Then, create a ClusterRoleBinding to bind the ClusterRole to the arms-prom-operator ServiceAccount in the arms-prom namespace. This grants the Prometheus Agent the required permissions.
ClusterRole YAML file
apiVersion: rbac.authorization.k8s.io/v1 kind: ClusterRole metadata: name: prometheus-agent-role labels: app: prometheus-agent rules: - apiGroups: [""] resources: ["pods", "services", "endpoints", "nodes"] verbs: ["get", "list", "watch"] # Adjust as needed. - apiGroups: ["monitoring.coreos.com"] # Adjust the apiGroups as needed. resources: ["*"] verbs: ["get", "list", "watch", "create", "update", "delete"] # Adjust as needed.ClusterRoleBinding YAML file
apiVersion: rbac.authorization.k8s.io/v1 kind: ClusterRoleBinding metadata: name: prometheus-agent-binding subjects: - kind: ServiceAccount name: arms-prom-operator # Service account name namespace: arms-prom # The namespace where the service account resides. roleRef: kind: ClusterRole name: prometheus-agent-role # The name of the ClusterRole defined above. apiGroup: rbac.authorization.k8s.io
Step 4: Verify the ServiceMonitor
Follow these steps to verify that Prometheus successfully discovered the service.
Log on to the Managed Service for Prometheus console. In the left-side navigation pane, click Integration Management.
On the Integrated Environments tab, find the target container environment in the Container Environments list and click its name.
Click the Self-Monitoring tab, and then click the Targets tab.
On the Targets tab, verify that a target named {namespace}/{serviceMonitorName}/x exists.
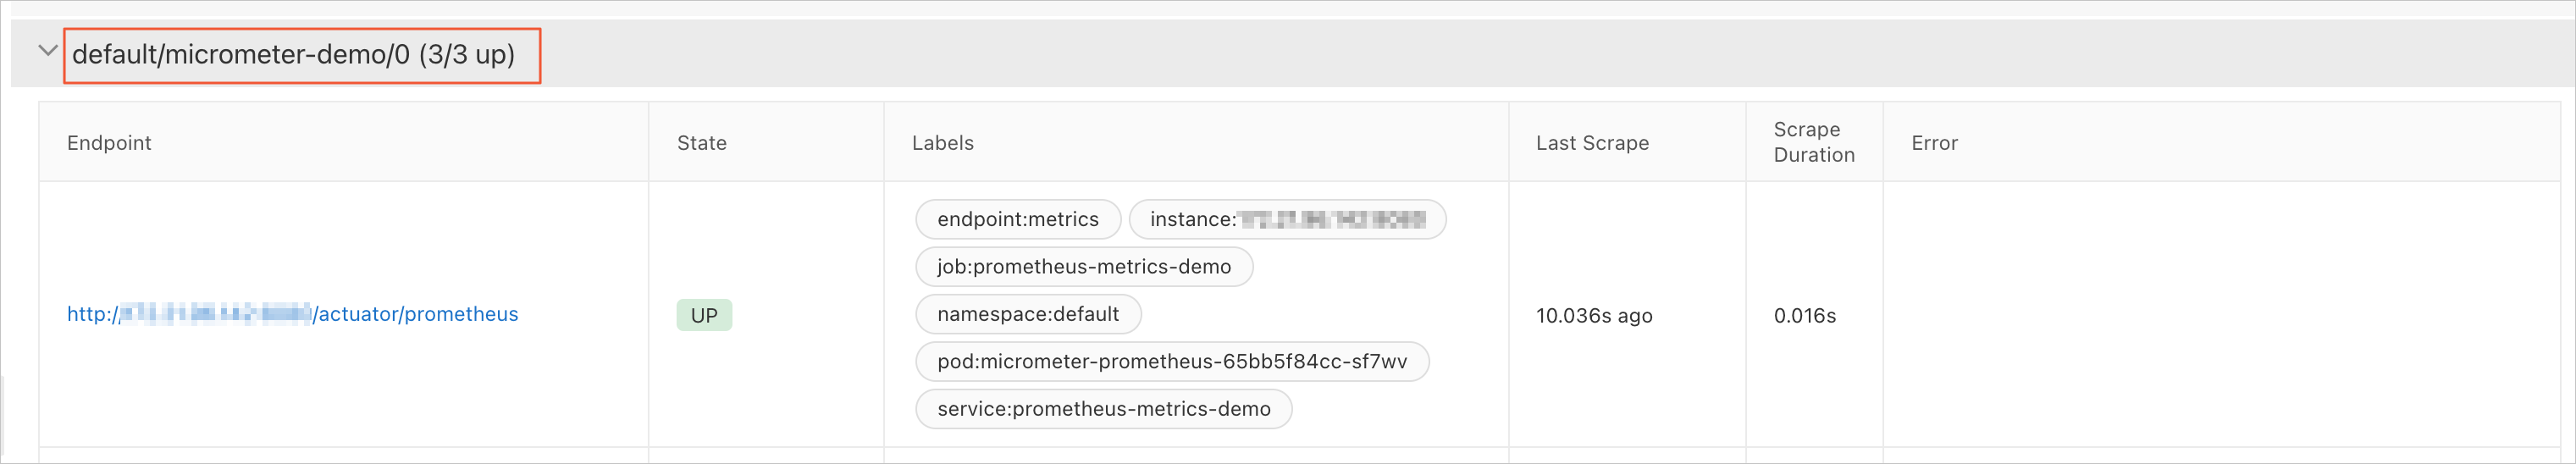
Click the row that corresponds to {namespace}/{serviceMonitorName}/x to expand the target details, and then click the Endpoint link.
Verify that the metrics are collected as expected.