The atop tool monitors Linux resource usage and processes, and records and reports the activities of the operating system and all processes at a specific frequency. If an issue occurs on a Linux Elastic Compute Service (ECS) instance, you can obtain the atop log files and analyze the files. This topic describes how to install, use, and configure the atop tool on a Linux instance.
Introduction
The data collected by the atop tool includes the process running status and resource usage information, such as the CPU utilization, memory usage, disk usage, and network resource usage. The data is stored on a disk in the form of log files. For each process, the atop tool can report information such as CPU utilization, memory usage, disk usage, priority, usernames, status, and exit codes. You can use the atop configuration file to configure parameters, such as the sampling interval of logs, storage path of log files, and log rotation policy.
Install the atop tool
In this example, an ECS instance that runs Alibaba Cloud Linux is used. Perform the following steps:
Connect to the ECS instance.
For more information, see Use Workbench to connect to a Linux instance over SSH.
Install the
atoptool. The command varies based on the operating system of the ECS instance.Alibaba Cloud Linux 2 or 3
Run the following command to install the
atoptool:sudo yum install -y atopRun the following command to start the
atopservice:sudo systemctl start atop
CentOS 7 or 8
Run the following command to install the
atoptool:sudo yum install -y atopRun the following command to start the
atopservice:sudo systemctl start atop
Ubuntu or Debian
Run the following command to update the list of all software in the repository:
sudo apt updateRun the following command to install the
atoptool:sudo apt install -y atopRun the following command to start the
atopservice:sudo systemctl start atop
CentOS Stream 9
Run the following command to download and install the atop tool:
sudo wget https://www.atoptool.nl/download/atop-2.11.0-1.el9.x86_64.rpm && sudo rpm -i atop-2.11.0-1.el9.x86_64.rpmRun the following command to start the atop service:
sudo systemctl start atop
Fedora
Run the following command to install the atop tool:
sudo yum install -y atopRun the following command to start the atop service:
sudo systemctl start atop
openSUSE
Run the following command to install the atop tool:
sudo zypper install -y atop atop-daemonRun the following command to start the atop service:
sudo systemctl start atop
Rocky Linux 9
Run the following command to install the atop tool:
sudo wget https://www.atoptool.nl/download/atop-2.11.0-1.el9.x86_64.rpm && sudo rpm -i atop-2.11.0-1.el9.x86_64.rpmRun the following command to start the atop service:
sudo systemctl start atop
NoteIf your ECS instance runs a Linux distribution different from the preceding distributions, obtain the required installation information from the official
atopwebsite. For more information, see Download atop.
(Optional) Configure the atop sampling interval and log retention period
To configure the atop sampling interval, log retention period, and log storage path, perform the following steps. Expand the following configuration file section to view information about the configuration file:
Configure the
atopsampling interval and log retention period.Run one of the following commands based on the instance operating system to open the
atopconfiguration file:Alibaba Cloud Linux 2, Alibaba Cloud Linux 3, CentOS 7, CentOS 8, or Fedora
sudo vim /etc/sysconfig/atopUbuntu, Debian, openSUSE, CentOS Stream 9, or Rocky Linux 9
sudo vim /etc/default/atopPress the
ikey to enter Insert mode.Change the sampling interval, log retention period, and log storage path based on your business requirements. In this example, the sampling interval is changed to 30 seconds, the log retention period is set to 10 days, and the default value of the log storage path is retained.
LOGOPTS="" LOGINTERVAL=30 LOGGENERATIONS=10 LOGPATH=/var/log/atopImportantA shorter sampling interval enables sampling at a finer granularity, but increases the I/O burden on the system and results in larger log files. If you use the
atoptool in a production environment, specify an appropriate sampling interval based on your business requirements to prevent excessive log files or log records from occupying excessive I/O resources and affecting business operation.A longer log retention period allows you to view earlier historical logs but occupies more disk space. Specify an appropriate log retention period based on your business requirements.
Press the
Esckey, enter:wq, and then press the Enter key to save and close the configuration file.
Run the following command to restart the
atopservice:sudo systemctl restart atop
Use the atop tool
When you use the atop tool to monitor Linux metrics, take note of the common commands and resource monitoring fields. Expand the following sections to view more information:
The following figure shows specific monitoring fields and the values of the fields. The values of the fields vary based on the sampling interval. The following figure is provided only for reference.
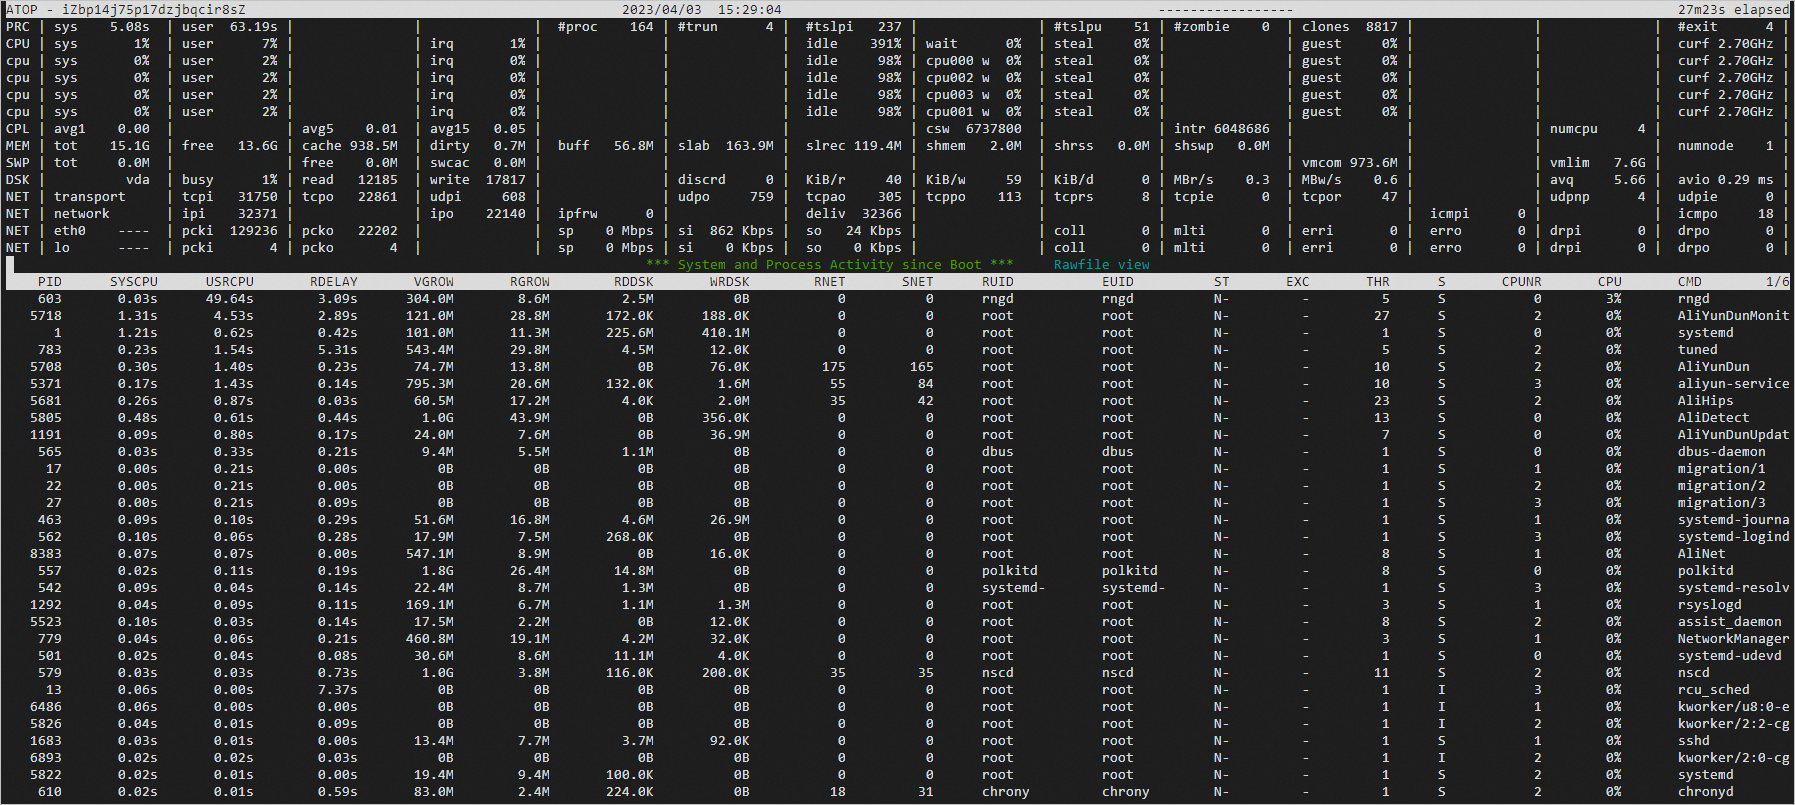
The following table describes the fields.
Field (line) | Description |
ATOP | The hostname, sampling date, and period of time that elapsed since data was last sampled. |
PRC | The overall running status of the processes.
|
CPU | The overall multi-core CPU utilization. The sum of the field values in a CPU line is N × 100%. N is the number of CPU cores.
|
CPL | The information about the CPU load.
|
MEM | The memory usage.
|
SWP | The swap space usage.
|
PAG | The virtual memory paging information. swin and swout: the number of swapped in memory pages and the number of swapped out memory pages. |
DSK | The disk usage. Each DSK line corresponds to a single disk. If a device named vdb exists, a DSK line for vdb is added.
|
NET | The NET line indicates the network status, such as the TCP and UDP status at the transport layer, the network status at the IP layer, and the status of each active network port.
|
By default, when you run atop commands in the CLI, the interactive mode is used. In interactive mode, you can filter data by using keyboard commands. For example, press the m key to switch to the memory information view. Press the q key to exit interactive mode. For information about the supported commands, see the Command commands section of this topic. You can also press the ? key in interactive mode to obtain more information.
Query real-time system metrics
Query system metrics every 5 seconds.
atop 5Query system metrics 30 times at 10-second intervals within a 5-minute period.
atop -M 10 30Query system metrics 10 times at 60-second intervals within a 10-minute period and write the results to a file.
atop -M 60 10 > /log/atop.mem
Query historical metric logs
After the atop service is started, the service collects data and stores the data in a log file. By default, the log file is stored in the /var/log/atop directory. You can run the following commands to query the historical metric logs that match the specified filter conditions.
Run the following sample
atop -rcommands to query metric logs. Do not use a text editor to open theatoplog file.When you use the
atoptool to query historical metric logs generated on a specific date, make sure that the historical metric logs that you want to query exist in a log file. If no log file contains the historical metric logs, thestat raw file: No such file or directoryerror message appears.
Query the historical metric logs generated on the current day.
atop -rQuery the historical metric logs generated on the previous day.
atop -r yQuery the historical metric logs generated on a specific date. In this example, the specified date is November 6, 2024.
atop -r 20241106Query the historical metric logs generated on a specific date starting from a specific point in time. In this example, the specified date is November 6, 2024 and the start time is 14:00.
atop -r 20241106 -b 14:00Query the historical metric logs generated within a specific time period on a specific date. In this example, the specified date is November 5, 2024 and the time period is from 00:04 to 00:08.
atop -r 20241105 -b 00:04 -e 00:08
Query the reports of system activities
Query the CPU utilization report of the current system 12 times at 5-second intervals within a 1-minute period.
atopsar -c 5 12Query the memory metric report within a specific time period on the current day. In this example, the time period is from 18:00 to 18:01.
atopsar -m -b 18:00 -e 18:01Query the memory metric report within a specific time period on a specific date. In this example, the specified date is November 5, 2024 and the time period is from 18:00 to 18:01.
atopsar -c -r 20241105 -b 18:00 -e 18:01
Related operations
Configure a daily log rotation policy
To generate an atop metric log file every day, perform the following steps:
(Optional) Change the sampling interval, log retention period, and log storage path based on your business requirements. For more information, see the (Optional) Configure the atop sampling interval and log retention period section of this topic.
Run the following command to enable the service related to daily log rotation to start on system startup and start the service:
sudo systemctl enable --now atop atopacct atop-rotate.timer
In the preceding example, a log file is generated every day. If your business requires more complex processing of logs, you can use the logrotate tool or custom scripts to manage logs.
Load an optional netatop kernel module
To monitor network usage, install the netatop network monitoring module. In this example, Alibaba Cloud Linux 3 is used.
Netatop can collect statistics on TCP and UDP packets sent and received by each process or thread. By default, netatop is not installed in the atop service. If you want to load an optional netatop kernel module in another Linux distribution, refer to the official atop manuals to install the module. For more information, see Module netatop.
Run the following command to install the kernel development package and the software environment required for compilation for the current kernel:
sudo yum install -y kernel-devel dkms elfutils-libelf-develRun the following command to download the latest version of the
netatopsource code to the specified directory:cd /usr/src/ && sudo wget https://www.atoptool.nl/download/netatop-3.2.2.tar.gz --no-check-certificateRun the following command to decompress the source code and access the source code directory:
sudo tar -zxvf netatop-3.2.2.tar.gz && cd netatop-3.2.2Run the following command to build and install the
netatopmodule and the daemon of the module based on the source code:sudo make && sudo make installRun the following command to start the
netatopservice:sudo systemctl start netatop