You can use CloudLens for EBS in the Elastic Block Storage (EBS) console to view the monitoring data of disks to track business fluctuations and resource consumption in real time. This topic describes how to view disk performance data, disk events, and performance burst details of ESSD AutoPL disks.
Enable CloudLens for EBS
The first time you log on to the CloudLens for EBS console, follow the on-screen instructions to enable CloudLens for EBS.
Log on to the Elastic Block Storage (EBS) console.
NoteThe first time you log on to the EBS console, you must create a service-linked role for EBS as prompted. For more information, see Service-linked role for EBS.
In the left-side navigation pane, choose .
On the CloudLens for EBS page, click Enable Now to enable CloudLens for EBS.
NoteAfter you enable CloudLens for EBS for the first time, the system needs to prepare data. Please wait for about 5 minutes. After the preparation is complete, CloudLens for EBS starts to monitor disk performance and collect statistics. The historical data of disks that was generated before CloudLens for EBS is enabled is not collected.
View the near real-time monitoring data of a disk
Log on to the Elastic Block Storage (EBS) console.
NoteThe first time you log on to the EBS console, you must create a service-linked role for EBS as prompted. For more information, see Service-linked role for EBS.
In the left-side navigation pane, choose .
In the upper-left corner of the top navigation bar, select a region.
On the Cloud Disk Analysis page, find the disk for which you want to view monitoring data, and click Monitor in the Actions column.
On the Near Real-time Monitoring page, specify a time range to view the monitoring data of the disk.
NoteNear real-time monitoring data may be delayed by 1 to 5 minutes. Therefore, during the query, the data in the previous 1 to 5 minutes may be zero, which indicates that the data is not obtained.
Metric descriptions
Metric
Description
Throughput
The amount of data that is successfully transmitted within the query time range. Unit: MB/s. High throughput is essential for applications that require many sequential reads and writes.
If the disk is an ESSD AutoPL disk, near real-time monitoring data of the baseline throughput and provisioned throughput is displayed. For more information about ESSD AutoPL disks, see ESSD AutoPL disk.
IOPS
The number of input/output operations per second (IOPS) that can be processed by the disk. High IOPS is essential for transaction-intensive applications.
If the disk is an ESSD AutoPL disk, near real-time monitoring data of the baseline IOPS and provisioned IOPS is displayed. For more information about ESSD AutoPL disks, see ESSD AutoPL disk.
Average I/O Read/Write by Size
The amount of data read or written in an I/O operation on the disk. Unit: bytes. I/O sizes affect the throughput and efficiency of storage systems. Some systems are optimized for transferring large blocks of data, while others perform better with small I/O operations. You can understand and optimize I/O sizes based on the requirements of applications to improve overall system performance.
BPS Watermark
The throughput utilization, expressed as the percentage of the allowed throughput. When this value approaches 100%, the disk is operating at its maximum capacity. Any additional load may cause performance bottlenecks and slower application response times. Therefore, monitoring this metric helps you adjust disk configurations or optimize applications in a timely manner to prevent potential performance issues.
IOPS Watermark
The IOPS utilization, expressed as the percentage of the allowed IOPS. When this value approaches 100%, the disk is approaching its limit in processing concurrent requests, which may cause increased latency or request failures. Therefore, monitoring this metric helps you determine whether the disk can meet the real-time performance requirements of applications and make adjustments accordingly to maintain efficient and stable application operation.
Metric value descriptions
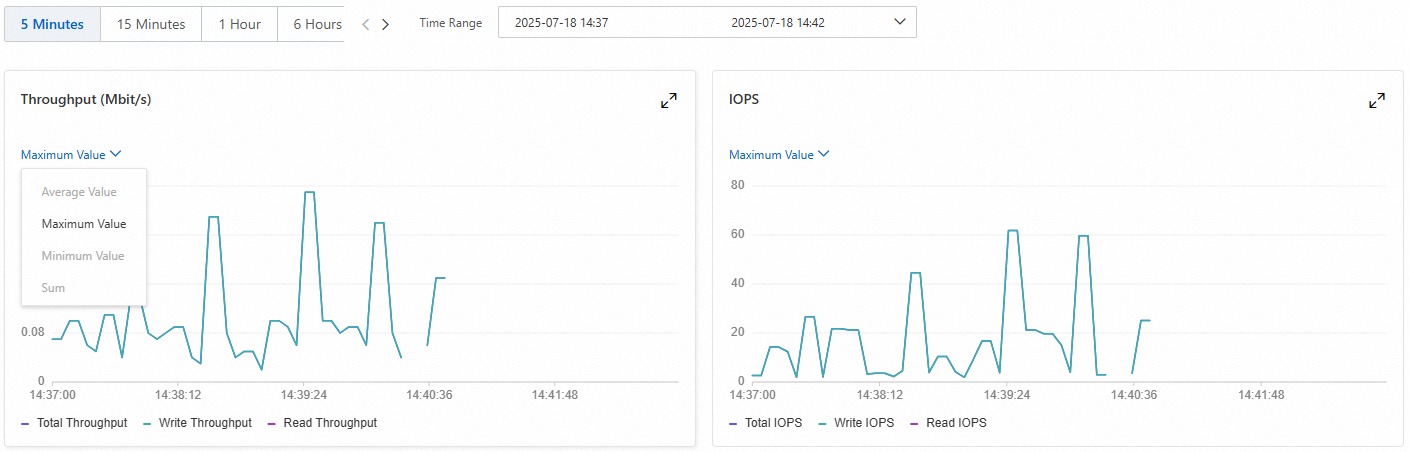
Near real-time monitoring supports querying monitoring data from the last 5 minutes, 15 minutes, 1 hour, 6 hours, or 1 day. Each metric value is the maximum value of the disk monitoring data within 5 seconds.
Time range: 5 minutes or 15 minutes
You can only query the maximum values of disk monitoring data. The minimum granularity displayed in the metric window is 5 seconds.
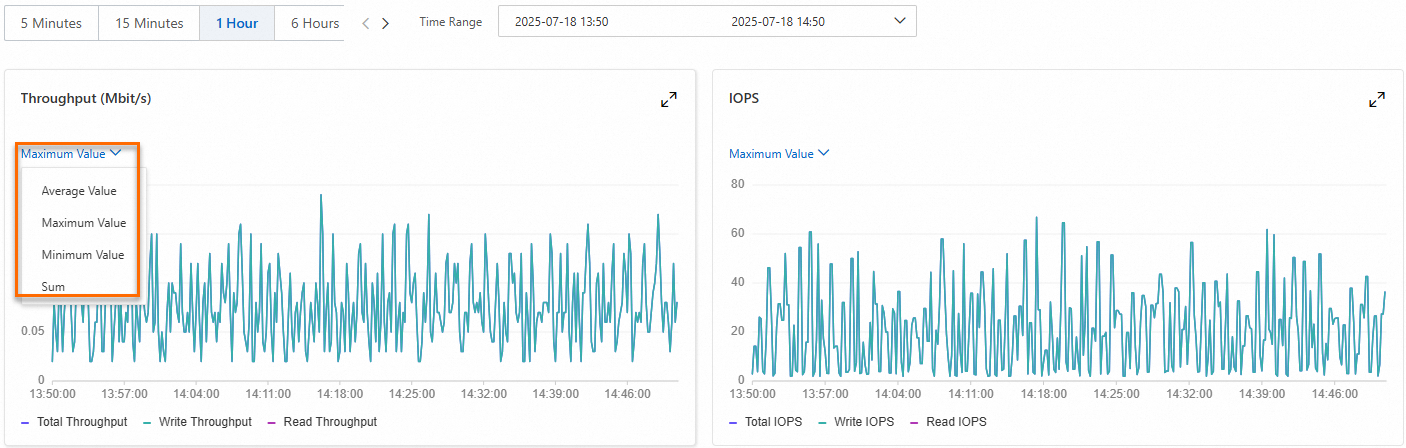
Time range: 1 hour, 6 hours, or 1 day
You can query the maximum, minimum, average, and total values of disk monitoring data. The minimum granularity displayed in the metric window varies depending on the time range. For example, if you query monitoring data from the last hour, the minimum granularity displayed in the metric window is 10 seconds.
Maximum value: The maximum value among the metric values collected every 10 seconds (2 metric values) within 1 hour.
Minimum value: The minimum value among the metric values collected every 10 seconds (2 metric values) within 1 hour.
Average value: The average of the metric values collected every 10 seconds (2 metric values) within 1 hour.
Total value: The sum of the metric values collected every 10 seconds (2 metric values) within 1 hour.
View the burst performance data of an ESSD AutoPL disk
After you enable the performance burst feature for an ESSD AutoPL disk, CloudLens for EBS monitors the performance burst details of the disk in real time, such as the burst duration and the number of burst IOPS. For more information about ESSD AutoPL disks, see ESSD AutoPL disk.
Log on to the Elastic Block Storage (EBS) console.
NoteThe first time you log on to the EBS console, you must create a service-linked role for EBS as prompted. For more information, see Service-linked role for EBS.
In the left-side navigation pane, choose .
In the upper-left corner of the top navigation bar, select a region.
On the Cloud Disk Analysis page, find the ESSD AutoPL disk that you want to view, and click Monitor in the Actions column.
In the navigation pane on the left, click the AutoPL Burst IO tab.
On the AutoPL Burst IO page, view the performance burst details of the ESSD AutoPL disk, such as the burst duration and the number of burst IOPS.
NoteBurst events and the details of performance bursts have a delay of up to 1 hour.
View the risk events of a disk
The Threats feature displays disks that are currently at risk, prompting you to address them promptly to ensure stable operation and data security.
Log on to the Elastic Block Storage (EBS) console.
NoteThe first time you log on to the EBS console, you must create a service-linked role for EBS as prompted. For more information, see Service-linked role for EBS.
In the left-side navigation pane, choose .
In the upper-left corner of the top navigation bar, select a region.
On the Cloud Disk Analysis page, find the disk for which you want to view risk events, and click Event in the Actions column.
On the Cloud Disk Event page, view the event notifications for the disk and handle them based on the suggestions.
For more information, see Cloud disk events and Disk events.