Data Quality provides a variety of built-in table-level and field-level rule templates. This topic describes how to configure a monitoring rule based on a template.
Limits
You can configure monitoring rules based on templates for MaxCompute, E-MapReduce, Hologres, CDH Hive, AnalyticDB for PostgreSQL, AnalyticDB for MySQL, StarRocks, and MySQL data sources.
Procedure
You can perform the following steps to configure a monitoring rule based on a template:
Select a rule template and configure the rule parameters.
Built-in rule templates are classified into table-level and field-level rule templates. After you select a template, you can configure a rule based on the template to check the data quality of a table. You can use the monitoring rule to determine whether the table data is as expected.
Add multiple tables or fields whose data quality needs to be checked by the rule at the same time
You can select tables or fields whose data quality needs to be checked and apply the rule to the tables or fields.
Associate the rule with a new monitor or an existing monitor
You can associate the rule with a new monitor or an existing monitor to specify The Range Of Data Whose Quality You Want To Monitor based on the rule. If you want to monitor the data quality of a partitioned table, the data range is a partition.
Procedure
Step 1: Go to the Configure Monitoring Rules by Template page
Log on to the DataWorks console. In the top navigation bar, select the desired region. In the left-side navigation pane, choose . On the page that appears, select the desired workspace from the drop-down list and click Go to Data Quality.
In the left-side navigation pane, choose .
Data Quality provides built-in Table-level rule templates and Field-level rule templates. You can find the desired template and click Configure Monitoring Rules to the right of the template to configure a monitoring rule based on the template for multiple tables or fields at the same time.
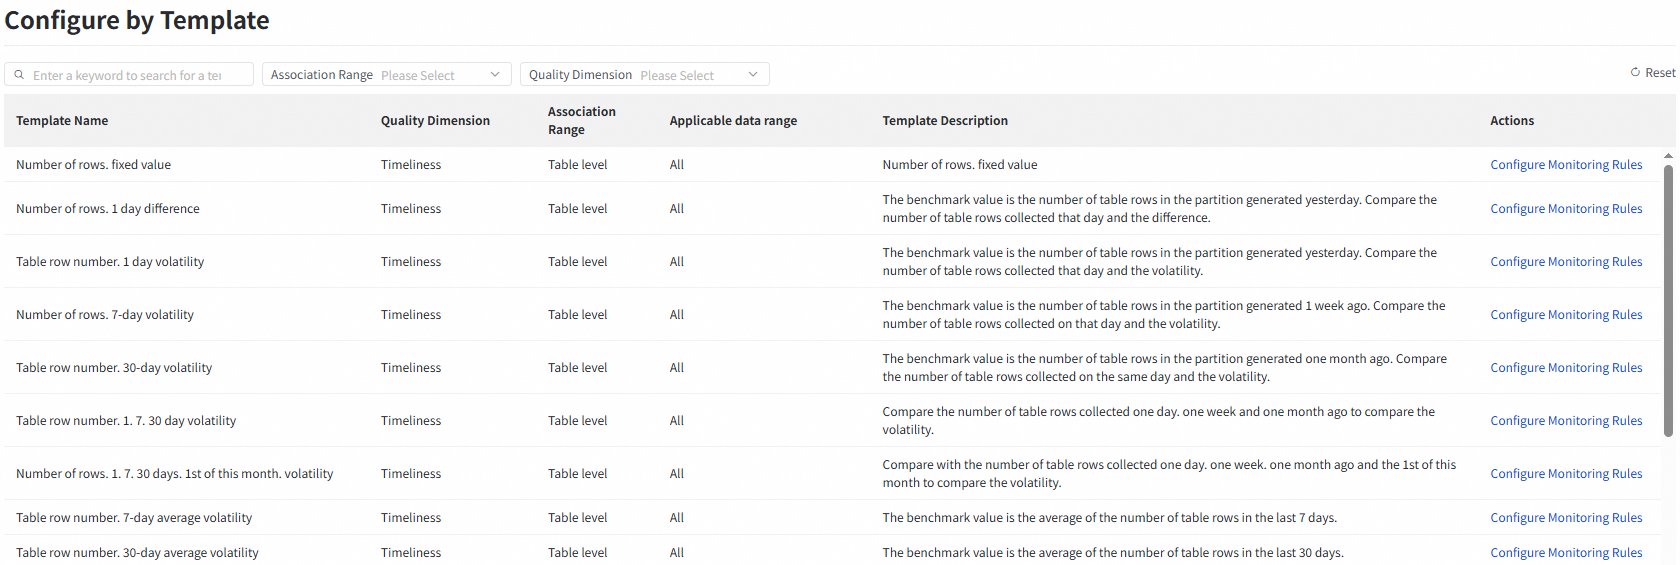
Step 2: Configure the attributes of the monitoring rule
Select the template that you want to apply to multiple tables or partitions, and click Configure Monitoring Rules in the Actions column to go to the Batch Add Monitoring Rules wizard.
Configure Basic Attributes for the monitoring rule.
Parameter
Description
Data Source Type
The type of the data source of tables for which you want to configure a monitoring rule.
NoteYou can configure monitoring rules based on templates for MaxCompute, E-MapReduce, Hologres, CDH Hive, AnalyticDB for PostgreSQL, AnalyticDB for MySQL, StarRocks, and MySQL data sources.
Rule Source
The value is fixed as Built-in Template and the selected rule template. You cannot modify this parameter. For more information about built-in rule templates, see View built-in rule templates.
Template
Rule Name
The naming format of the monitoring rule. The name of the monitoring rule is automatically generated. You can change the suffix in the naming format based on your business requirements.
Configure advanced attributes for the monitoring rule.
Parameter
Description
Degree Of Importance
The strength of the rule in your business.
Strong rules are important rules. If you set the parameter to Strong rules and the critical threshold is exceeded, the scheduling node that you associate with the monitor is blocked by default.
Weak rules are regular rules. If you set the parameter to Weak rules and the critical threshold is exceeded, the scheduling node that you associate with the monitor is not blocked by default.
Comparison Method
The comparison method that is used by the rule to check whether the table data is as expected.
Manual Settings: You can configure the comparison method to compare the data output result with the expected result based on your business requirements.
You can select different comparison methods for different rule templates. You can view the comparison methods that are supported by a rule template in the DataWorks console.
Numeric results: You can compare a numeric result with a fixed value, which is the expected value. The following comparison methods are supported: greater than, greater than or equal to, equal to, not equal to, less than, and less than or equal to. You can configure the normal data range (normal threshold) and abnormal data range (critical threshold) based on your business requirements.
Fluctuation results: You can compare a fluctuation result with a fluctuation range. The following comparison methods are supported: absolute value, rise, and drop. You can configure the normal data range (normal threshold) based on your business requirements. You can also define data output exceptions (warning threshold) and unexpected data outputs (critical threshold) based on the degree of abnormal deviation.
Intelligent Dynamic Threshold: If you select this option, you do not need to manually configure the fluctuation threshold or expected value. The system automatically determines the reasonable threshold based on intelligent algorithms. If abnormal data is detected, an alert is immediately triggered or the related task is immediately blocked. When the Comparison Method parameter is set to Intelligent Dynamic Threshold, you can configure the Degree of importance parameter.
NoteOnly monitoring rules that you configure based on a custom SQL statement, a custom range, or a dynamic threshold support the intelligent dynamic threshold comparison method.
Monitoring Threshold
If you set the Comparison Method parameter to Manual Settings, you can configure the Normal threshold and Red Threshold parameters.
Normal threshold: If the data quality check result meets the specified condition, the data output is as expected.
Red Threshold: If the data quality check result meets the specified condition, the data output is not as expected.
If the rule that you configure is a rule of the fluctuation type, you must configure the warning threshold.
Warning Threshold: If the data quality check result meets the specified condition, the data is abnormal but your business is not affected.
Status
Specifies whether to enable the rule in the production environment.
ImportantIf you turn off the switch for the rule, the rule cannot be triggered to perform a test run or triggered by the associated scheduling nodes.
Click Next to go to the Generate Monitoring Rule step.
Step 3: Add multiple tables or fields whose data quality needs to be checked by the rule at the same time
You can add multiple tables or fields whose data quality needs to be checked based on the selected Table-level or Field-level Rule Template.
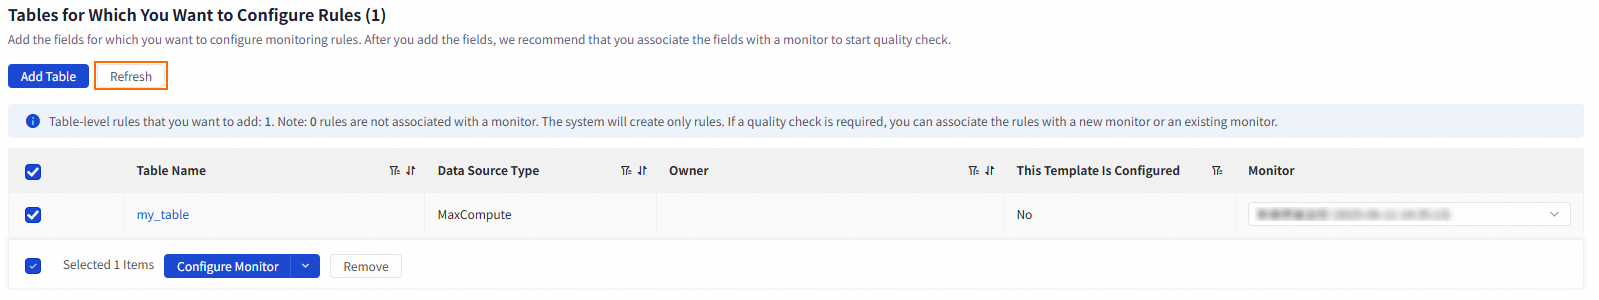
Add tables
Click Add Table. In the Batch Create panel, select the tables for which you want to configure a monitoring rule.
NoteAll tables of the Data Source Type that you specified in the Basic Attributes section are displayed in the list. You can also enter a Table Name to filter the results.
After you select tables, click Confirm to add the tables to the Tables To Configure Rules list.
Add fields
Click Add Fields. In the Select A Field dialog box, select the tables that contain the fields for which you want to configure a monitoring rule.
NoteAll tables of the Data Source Type that you specified in the Basic Attributes section are displayed in the Tables To Be Selected section.
After you select tables, the Select Fields section displays all fields in the selected tables. You can filter the fields by Field Name or Field Description.
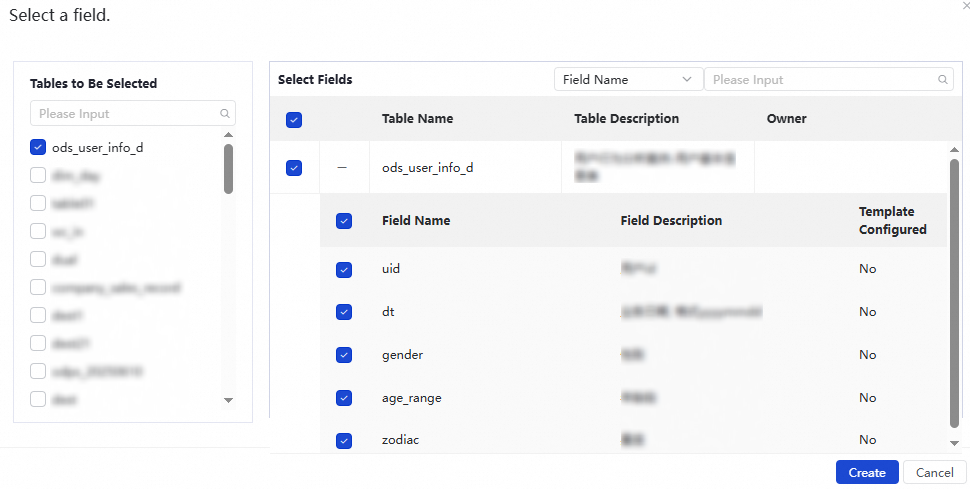
Select the fields for which you want to configure a monitoring rule and click Create to add the fields to the Fields To Configure Rules list.
Step 4: Associate the rule with a new monitor or an existing monitor
You can associate the rule with a new monitor or an existing monitor to specify the range of data whose quality you want to monitor based on the rule. If you want to monitor the data quality of a partitioned table, the data range is a partition.
You can separately configure a monitor for each table or field or configure a monitor for multiple tables or fields at the same time.
Configure a monitor for multiple tables or fields at the same time
Select multiple tables or fields and click Configure Monitor.
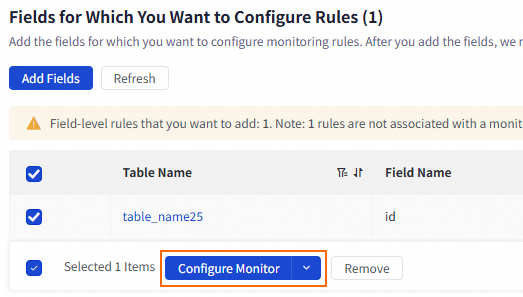
Select Automatically Associate, Disassociate, or Batch Add from the Configure Monitor drop-down list.
Automatically Associate: The selected tables or fields are automatically associated with an existing monitor.
Disassociate: The selected tables or fields are disassociated from a monitor.
Batch Add: You can configure the data range and running settings for the selected tables or fields.
Parameter
Description
Data Range
Partitioned Table
The range of table data whose quality you want to monitor. You can use a partition filter expression to define the partition that needs to be checked.
Non-partitioned table: The default value is the entire table. You can set a range by using a WHERE condition.
For a partitioned table, you must set this parameter to a value in the
Partition key=Partition valueformat. The partition value can be a constant or a built-in partition filter expression.
Running Settings
Trigger Method
The running mode of the monitoring rules.
Triggered by Node Scheduling in Production Environment: After the scheduling node that you associate with the monitor finishes running in Operation Center, the rules that are associated with the monitor are automatically triggered. Note that dry-run nodes do not trigger monitoring rules to run.
Triggered Manually: The monitoring rules that are associated with the monitor are manually triggered.
ImportantIf the table whose data quality you want to check is a non-MaxCompute table and Triggered by Node Scheduling in Production Environment is selected for Trigger Method on the Create Monitor page, you cannot associate scheduling nodes that are run on the shared resource group for scheduling with the monitor. Otherwise, an error may be reported when the monitor is run.
Associated Scheduling Node
If you set the Trigger Method parameter to Triggered by Node Scheduling in Production Environment, you can configure this parameter to select the scheduling nodes that you want to associate with the monitor. After the scheduling nodes finish running, the rules that are associated with the monitor are automatically triggered.
Running Resources
The resources that are required to run the rules. By default, the data source to which the monitored table in the current workspace belongs is selected. If you select another data source, make sure that the related resources can access the monitored table.
Separately configure a monitor for each table or field
Associate the monitoring rule with a monitor. To associate the rule with a monitor, find the desired table or field, click the drop-down list in the Monitor column, and then select an existing monitor or Create Monitor.
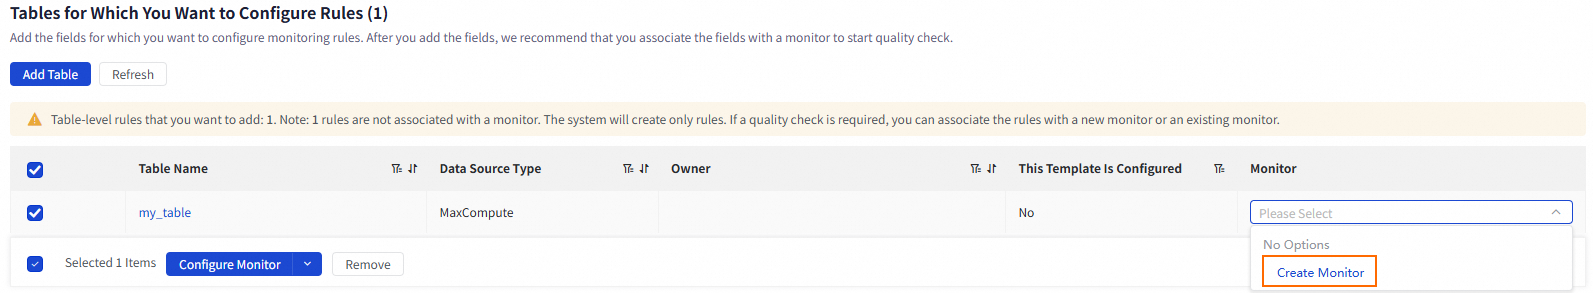
If no monitor is available, select Create Monitor from the drop-down list to create a monitor and associate the rule with the created monitor. In the "Enter information" step, configure the parameters. The following tables describe the parameters:
Section
Parameter
Description
Basic Configurations
Monitor Name
The name of the monitor.
Monitored Object
The object for which you want to check the data quality. The default value is the current table.
Data Range
The range of table data whose quality you want to monitor. You can use a partition filter expression to define the partition that needs to be checked.
For a non-partitioned table, you do not need to configure this parameter. All data in the table is checked by default.
For a partitioned table, you must set this parameter to a value in the
Partition key=Partition valueformat. The partition value can be a constant or a built-in partition filter expression.
NoteIf you configure a monitoring rule based on a custom template or a custom SQL statement, this parameter does not take effect. Instead, the partition checked by the rule is determined by the custom SQL statement that is specified in the rule.
Monitoring Rule
Monitoring Rule
The monitoring rules that you want to associate with the monitor. The quality of data in the specified range is monitored based on the rules.
NoteYou can create different monitors for different partitions of the same table and associate different monitoring rules with the monitors. This way, the partitions can be monitored based on different data quality check logic.
If you have not created monitoring rules, you can skip the configuration of this parameter and complete the creation of the monitor first. When you create and configure a monitoring rule, you can add the monitoring rule to a monitor. For information about how to create and configure a monitoring rule, see Step 3: Configure a monitoring rule.
Running Settings
Trigger Method
The running mode of the monitoring rules.
Triggered by Node Scheduling in Production Environment: After the scheduling node that you associate with the monitor finishes running in Operation Center, the rules that are associated with the monitor are automatically triggered. Note that dry-run nodes do not trigger monitoring rules to run.
Triggered Manually: The monitoring rules that are associated with the monitor are manually triggered.
ImportantIf the table whose data quality you want to check is a non-MaxCompute table and Triggered by Node Scheduling in Production Environment is selected for Trigger Method on the Create Monitor page, you cannot associate scheduling nodes that are run on the shared resource group for scheduling with the monitor. Otherwise, an error may be reported when the monitor is run.
Associated Scheduling Node
If you set the Trigger Method parameter to Triggered by Node Scheduling in Production Environment, you can configure this parameter to select the scheduling nodes that you want to associate with the monitor. After the scheduling nodes finish running, the rules that are associated with the monitor are automatically triggered.
Running Resources
The resources that are required to run the rules. By default, the data source to which the monitored table in the current workspace belongs is selected. If you select another data source, make sure that the related resources can access the monitored table.
Handling Policies
Quality Issue Handling Policies
The blocking or alerting policy that is used to process detected data quality issues.
Blocks: If a data quality issue is detected in the table, the scheduling node in the production environment that generates the table is identified, and the system sets the running status of the node to Failed. In this case, the descendant nodes of the node cannot be run, which blocks the production link to prevent the spread of dirty data.
Default value:
Strong rules Red anomaly.Alert: If a data quality issue is detected in the table, the system sends alert notifications to the alert recipient by using the configured notification method.
Default values:
Strong rules · Red anomaly,Strong rules · Orange exception,Strong rules · Check Failed,Weak rules · Red anomaly,Weak rules · Orange exception, andWeak rules · Check Failed.
Go back to the Batch Add Monitoring Rules wizard, click Refresh, and then select the created monitor from the drop-down list in the Monitor column.
Step 5: Test the rule
Click Generate Monitoring Rule to go to the Verify Monitoring Rule step. On the Verify Monitoring Rule page, you can perform the following operations:
Test Run: Verify the reasonableness of the rule configurations.
After the rules of the selected tables are created, you can select one or more rules to perform a Test Run. In the Test Run dialog box, configure the Scheduling Time parameter, which specifies the simulated triggering time of the rule, and the Resource Group parameter. The system calculates the value of a partition key in a partitioned table that you want to monitor based on the specified simulated triggering time and the value of the Data Range parameter. Click Test Run to check whether the data in the partition of the table complies with the configured monitoring rule.
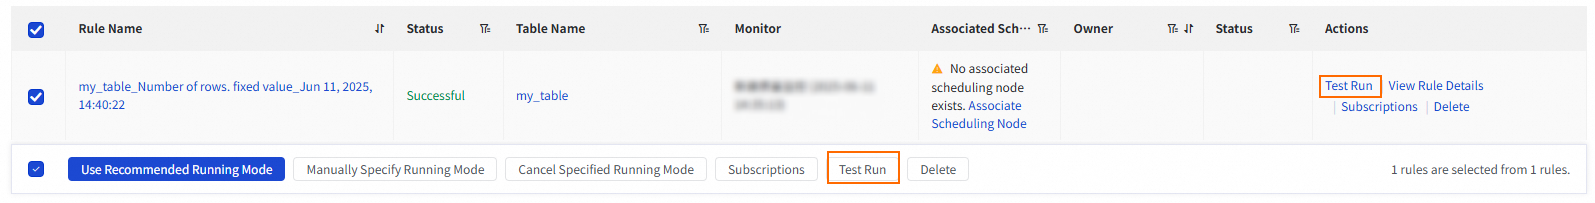
After the test run is complete, you can click Running Records in the Actions column of the rule to view the details of the test run and perform related operations.
Subscriptions: Specify the alert recipient.
You can receive alert notifications by using one of the following notification methods: Email, Email And SMS, DingTalk Chatbot, DingTalk Chatbot @ALL, Lark Group Chatbot, WeCom Robot, Custom WebHook, and Telephone.
NoteYou can add a DingTalk chatbot, Lark chatbot, or WeCom chatbot and obtain a webhook URL. Then, copy the webhook URL to the Recipient field in the Manage Subscriptions dialog box.
The Custom Webhook notification method is supported only in DataWorks Enterprise Edition. For information about the message format of an alert notification sent by using a Custom Webhook URL, see Appendix: Message format of alert notifications sent by using a custom webhook URL in this topic.
If you select Email, Email And SMS, or Telephone as the notification method, you can specify Authorization Object as Monitor Owner, Shift Schedule, or Scheduling Task Owner.
Monitor Owner: Alert notifications are sent to the owner that is specified in the Basic Settings section of the Monitor Owner parameter.
Shift Schedule: When an alert is triggered for a monitoring rule that is associated with a node, the system sends alert notifications to the on-duty personnel in the shift schedule.
Scheduling Task Owner: Alert notifications are sent to the Owner of the scheduling node that is associated with the monitor.
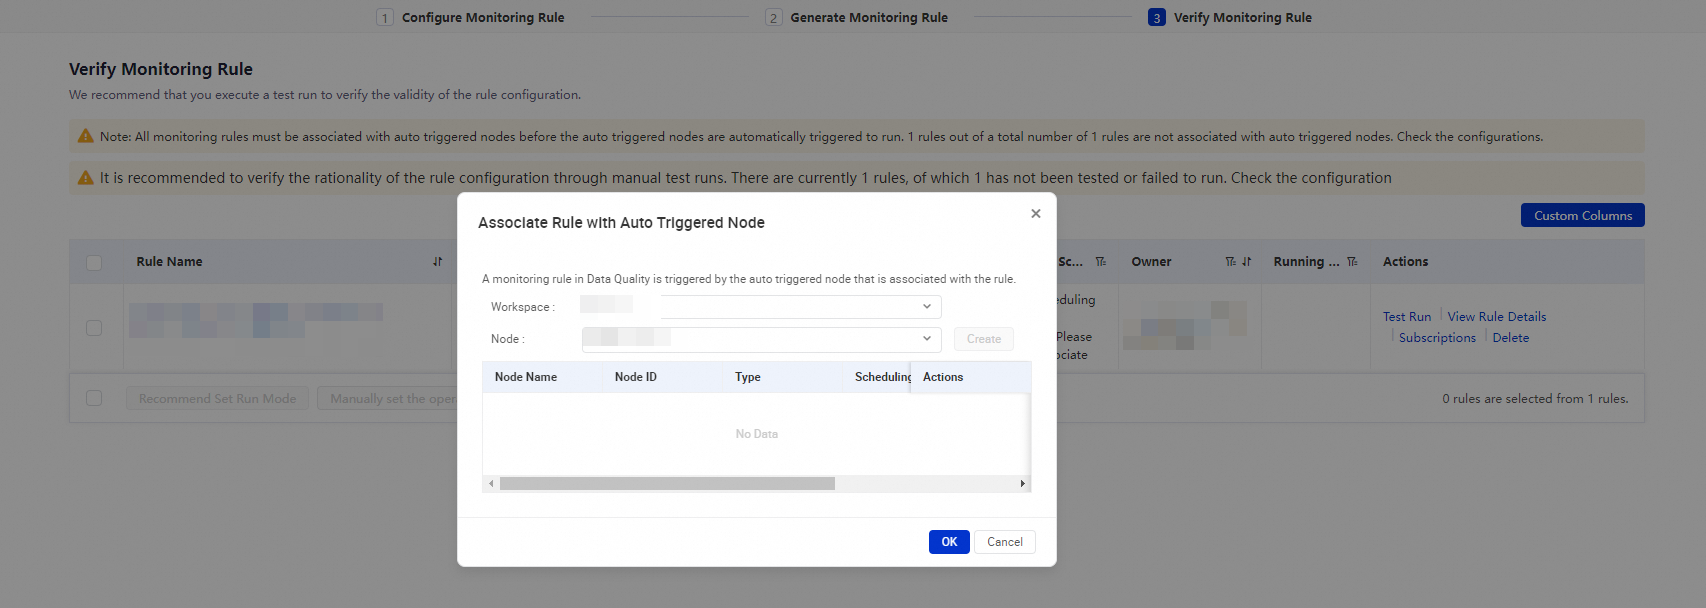
Associate Rule With Auto Triggered Node: Specify a trigger method for a rule.
You can click Use Recommended Running Mode or Manually Specify Running Mode to associate one or more monitoring rules with the auto triggered nodes that generate table data. In Operation Center, auto triggered nodes generate the table data after the auto triggered node instances, data backfill instances, or test instances generated for the auto triggered nodes are successfully run. When the auto triggered nodes start to run, the monitoring rules are triggered. You can specify the strength of a rule to control whether to block the running of the descendant nodes of an associated auto triggered node. This helps reduce the impact of dirty data records.
Use Recommended Running Mode: The system associates the selected monitoring rules with auto triggered nodes based on the lineages of the auto triggered nodes that generate the table data.
Manually Specify Running Mode: You can manually associate the selected monitoring rule with specific auto triggered nodes.
ImportantA monitoring rule can be triggered only when the rule is associated with related auto triggered nodes.
Delete: You can select one or more rules that you want to delete.
Rule Details: You can click View Rule Details in the Actions column of a rule to view the rule details. On the page that appears, you can perform the following operations: modify, start, stop, and delete the rule, specify the rule strength, and view logs.
After the test on the monitoring rule is complete and the monitoring rule is associated with auto triggered nodes, click Complete Check.
What to do next
After the monitor is run, you can choose Quality O&M > Monitor in the left-side navigation pane of the Data Quality page to view the quality check status of the specified table and choose Quality O&M > Running Records to view the complete check records of the rule.
Appendix: Message format of alert notifications sent by using a custom webhook URL
The following section describes the message format of an alert notification sent by using a Custom Webhook URL and the related parameters.
Sample message
{ "detailUrl": "https://dqc-cn-zhangjiakou.data.aliyun.com/?defaultProjectId=3058#/jobDetail?envType=ODPS&projectName=yongxunQA_zhangbei_standard&tableName=sx_up_001&entityId=10878&taskId=16876941111958fa4ce0e0b5746379cd9bc67999d05f8&bizDate=1687536000000&executeTime=1687694111000", "datasourceName": "emr_test_01", "engineTypeName": "EMR", "projectName": "Project name", "dqcEntityQuality": { "entityName": "tb_auto_test", "actualExpression": "ds=20230625", "strongRuleAlarmNum": 1, "weakRuleAlarmNum": 0 }, "ruleChecks": [ { "blockType": 0, "warningThreshold": 0.1, "property": "id", "tableName": "tb_auto_test", "comment": "Test a monitoring rule", "checkResultStatus": 2, "templateName": "Compare the Number of Unique Field Values Against Expectation", "checkerName": "fulx", "ruleId": 123421, "fixedCheck": false, "op": "", "upperValue": 22200, "actualExpression": "ds=20230625", "externalId": "123112232", "timeCost": "10", "trend": "up", "externalType": "CWF2", "bizDate": 1600704000000, "checkResult": 2, "matchExpression": "ds=$[yyyymmdd]", "checkerType": 0, "projectName": "auto_test", "beginTime": 1600704000000, "dateType": "YMD", "criticalThreshold": "0.6", "isPrediction": false, "ruleName": "Rule name", "checkerId": 7, "discreteCheck": true, "endTime": 1600704000000, "MethodName": "max", "lowerValue": 2344, "entityId": 12142421, "whereCondition": "type!='type2'", "expectValue": 90, "templateId": 5, "taskId": "16008552981681a0d6", "id": 234241453, "open": true, "referenceValue": [ { "discreteProperty": "type1", "value": 20, "bizDate": "1600704000000", "singleCheckResult": 2, "threshold": 0.2 } ], "sampleValue": [ { "discreteProperty": "type2", "bizDate": "1600704000000", "value": 23 } ] } ] }The following table describes the parameters in the preceding code.
Name | Type | Sample value | Description |
ProjectName | String | autotest | The name of the compute engine or data source whose data quality is monitored. |
actualExpression | String | ds=20200925 | The monitored partition in the data source table. |
RuleChecks | Array of RuleChecks | The monitoring results returned. | |
BlockType | Integer | 1 | The strength type of the monitoring rule. The strength type of a monitoring rule indicates the importance of the rule. Valid values:
|
WarningThreshold | Float | 0.1 | The warning threshold. The threshold indicates the deviation of the monitoring result from the expected value. You can customize this threshold based on your business requirements. |
Property | String | type | The field whose data quality is checked based on the monitoring rule. This field is a column in the data source table that is monitored. |
TableName | String | dual | The name of the table that is monitored. |
Comment | String | Description of the monitoring rule | The description of the monitoring rule. |
CheckResultStatus | Integer | 2 | The status of the monitoring result. |
TemplateName | String | Compare the Number of Unique Field Values Against Expectation | The name of the monitoring template. |
CheckerName | String | fulx | The name of the checker. |
RuleId | Long | 123421 | The ID of the monitoring rule. |
FixedCheck | Boolean | false | Indicates whether the monitoring is performed based on a fixed value. Valid values:
|
Op | String | > | The comparison operator. |
UpperValue | Float | 22200 | The upper limit of the predicted result. The value of this parameter is automatically generated based on the threshold that you specify. |
ActualExpression | String | ds=20200925 | The partition in the monitored data source table. |
ExternalId | String | 123112232 | The node ID of the scheduling task. |
TimeCost | String | 10 | The time consumed to run the monitoring task. |
Trend | String | up | The trend of the monitoring result. |
ExternalType | String | CWF2 | The type of the CDN mapping system. Only CWF is supported. |
BizDate | Long | 1600704000000 | The data timestamp of the instance. In most cases, if the monitored business entity is offline data, the value is one day before the monitoring is performed. |
CheckResult | Integer | 2 | The monitoring result. |
MatchExpression | String | ds=$[yyyymmdd] | The partition filter expression. |
CheckerType | Integer | 0 | The type of the checker. |
ProjectName | String | autotest | The name of the compute engine or data source whose data quality you want to monitor. |
BeginTime | Long | 1600704000000 | The time when the check operation started. |
DateType | String | YMD | The type of the scheduling cycle. In most cases, the value of this parameter is YMD. This value indicates year, month, and day tasks. |
CriticalThreshold | Float | 0.6 | Critical threshold. The threshold indicates the deviation of the monitoring result from the expected value. You can customize this threshold based on your business requirements. If a strong rule is used and a critical alert is triggered, nodes are blocked. |
IsPrediction | Boolean | false | Indicates whether the check result meets your business requirements. Valid values:
|
RuleName | String | The name of the rule. | The name of the rule. |
CheckerId | Integer | 7 | The checker ID. |
DiscreteCheck | Boolean | true | Indicates whether the monitoring is discrete monitoring. Valid values:
|
EndTime | Long | 1600704000000 | The time when the check process ended. |
MethodName | String | max | The method used to collect sample data, such as avg, count, sum, min, max, count_distinct, user_defined, table_count, table_size, table_dt_load_count, table_dt_refuseload_count, null_value, null_value/table_count, (table_count-count_distinct)/table_count, table_count-count_distinct. |
LowerValue | Float | 2344 | The lower limit of the predicted result. The value of this parameter is automatically generated based on the threshold that you specify. |
EntityId | Long | 14534343 | The partition filter expression ID. |
WhereCondition | String | type!='type2' | The filter condition of the monitoring task. |
ExpectValue | Float | 90 | The expected value. |
TemplateId | Integer | 5 | The ID of the monitoring template that is used. |
TaskId | String | 16008552981681a0d6**** | The ID of the verification task. |
Id | Long | 2231123 | The primary key ID. |
ReferenceValue | Array of ReferenceValue | The historical sample values. | |
DiscreteProperty | String | type1 | The values of the sample field that are grouped by using the GROUP BY clause. For example, the values of the Gender field are grouped by using the GROUP BY clause. In this case, the values of DiscreteProperty are Male, Female, and null. |
Value | Float | 20 | The sample value. |
BizDate | String | 1600704000000 | The data timestamp of the instance. In most cases, if the monitored business entity is offline data, the value is one day before the monitoring is performed. |
SingleCheckResult | Integer | 2 | The string of the check result. |
Threshold | Float | 0.2 | Threshold. |
SampleValue | Array of SampleValue | The current sample values. | |
DiscreteProperty | String | type2 | The values of the sample field that are grouped by using the GROUP BY clause. For example, the values of the Gender field are grouped by using the GROUP BY clause. In this case, the values of DiscreteProperty are Male, Female, and null. |
BizDate | String | 1600704000000 | The data timestamp. In most cases, if the monitored business entity is offline data, the value is one day before the monitoring is performed. |
Value | Float | 23 | The sample value. |
Open | Boolean | true | Indicates whether the rule is enabled. |