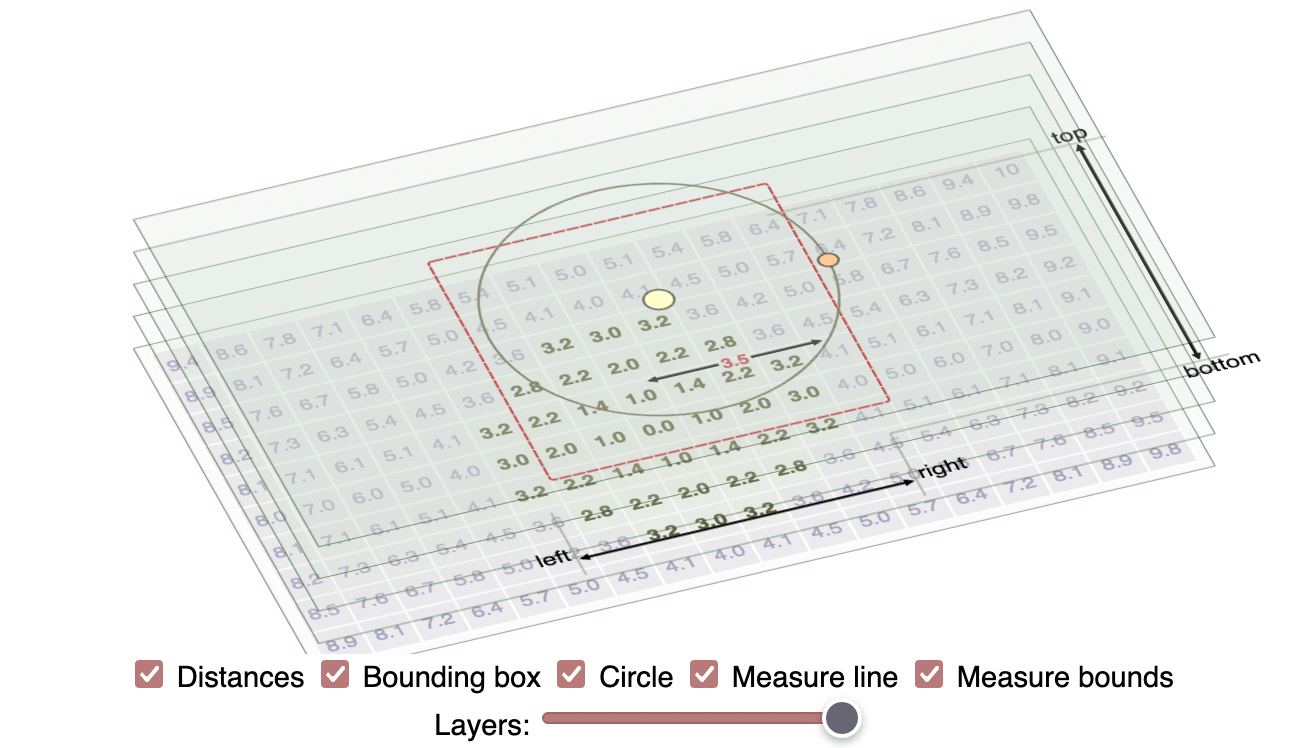
Making-of: circle drawing page #
People sometimes ask me how I write my interactive tutorials. I started out using d3.js, and five years ago I wrote an interactive tutorial about how I made interactive pages with d3.js. I recreated a diagram from my line drawing tutorial, which was implemented in d3.js. I now use Vue.js v2, so I wrote a new tutorial about how I make interactive pages with Vue. I recreated several diagrams from my circle drawing tutorial.

April updates: hex grid guide #
“We can rebuild it—we have the technology.”
Over the past few weeks I've been reimplementing my guide to hexagonal grids. I'm generally not a fan of rewrites that have no end-user benefits but there are lots of improvements I want to make to the page, and the convoluted code was making it harder to make the changes I wanted. I ended up spending 60 hours on this, reduced the number of lines of code from 2400 to 1400, and reduced the total Javascript sent to the browser (gzipped) from 85k to 54k. A large part of this was rewriting the diagrams to use Vue.js instead of D3.js. As much as I love D3, there's not much on the hexagon guide that benefits from it, and I ended up using it as a nicer JQuery. In a previous blog post I described wanting dependency tracking. That's why Vue.js worked well for this page. I think React would've been a reasonable choice as well, but on this page Vue fit my needs better.
Using Vue with Canvas #
In my last post I had said I was trying out some libraries to automatically track dependencies for me. The one I'm playing with right now is Vue.js. It can track dependencies between data and the HTML/SVG elements. For example if I write SVG:
<circle :cx="center.x" :cy="center.y" r="30"/>
and I have it hooked up to data:
data: { center: {x: 100, y: 150} } then Vue will remember that the circle depends on those x and y properties. If I modify the data with center.x = 75; Vue will detect this and update the circle. This is quite convenient!