Visualize Neural Networks
How to visualize Neural Networks as computation graph
Here, we'll demonstrate how to use mx.viz.plot_network for visualizing your neural networks. mx.viz.plot_network represents the neural network as a computation graph consisting of nodes and edges. The visualizations make clear which nodes correspond to inputs, where the computation starts, and which correspond to output nodes, from which the result can be read.
Prerequisites
You need the Jupyter Notebook and Graphviz libraries to visualize the network. Please make sure you have followed installation instructions in setting up above dependencies along with setting up MXNet.
Visualize the sample Neural Network
mx.viz.plot_network takes Symbol, with your Network definition, and optional node_attrs, parameters for the shape of the node in the graph, as input and generates a computation graph.
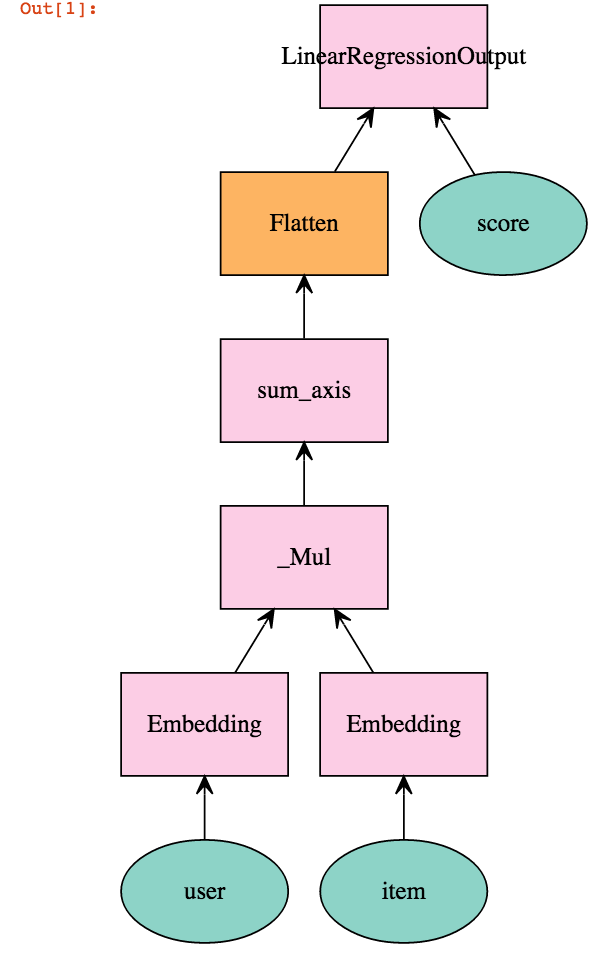
We will now try to visualize a sample Neural Network for linear matrix factorization: - Start Jupyter notebook server bash $ jupyter notebook - Access Jupyter notebook in your browser - http://localhost:8888/. - Create a new notebook - "File -> New Notebook -> Python 2" - Copy and run below code to visualize a simple network.
import mxnet as mx user = mx.symbol.Variable('user') item = mx.symbol.Variable('item') score = mx.symbol.Variable('score') # Set dummy dimensions k = 64 max_user = 100 max_item = 50 # user feature lookup user = mx.symbol.Embedding(data = user, input_dim = max_user, output_dim = k) # item feature lookup item = mx.symbol.Embedding(data = item, input_dim = max_item, output_dim = k) # predict by the inner product, which is elementwise product and then sum net = user * item net = mx.symbol.sum_axis(data = net, axis = 1) net = mx.symbol.Flatten(data = net) # loss layer net = mx.symbol.LinearRegressionOutput(data = net, label = score) # Visualize your network mx.viz.plot_network(net) You should see computation graph something like the following image: