pyHH is a simple Python implementation of the Hodgkin-Huxley spiking neuron model. pyHH simulates conductances and calculates membrane voltage at discrete time points without requiring a differential equation solver. HHSharp is a similar project written in C#.
A full Hodgkin-Huxley spiking neuron model and simulation was created in fewer than 100 lines of Python (dev/concept4.py). Unlike other code examples on the internet, this implementation is object-oriented and Pythonic. When run, it produces the image above.
The pyhh package includes Hodgkin-Huxley models and additional tools to organize simulation data.
- Create a model cell and customize its properties if desired
- Create a stimulus waveform (a numpy array)
- Create a simulation by giving it model the waveform you created
- Plot various properties of the stimulation
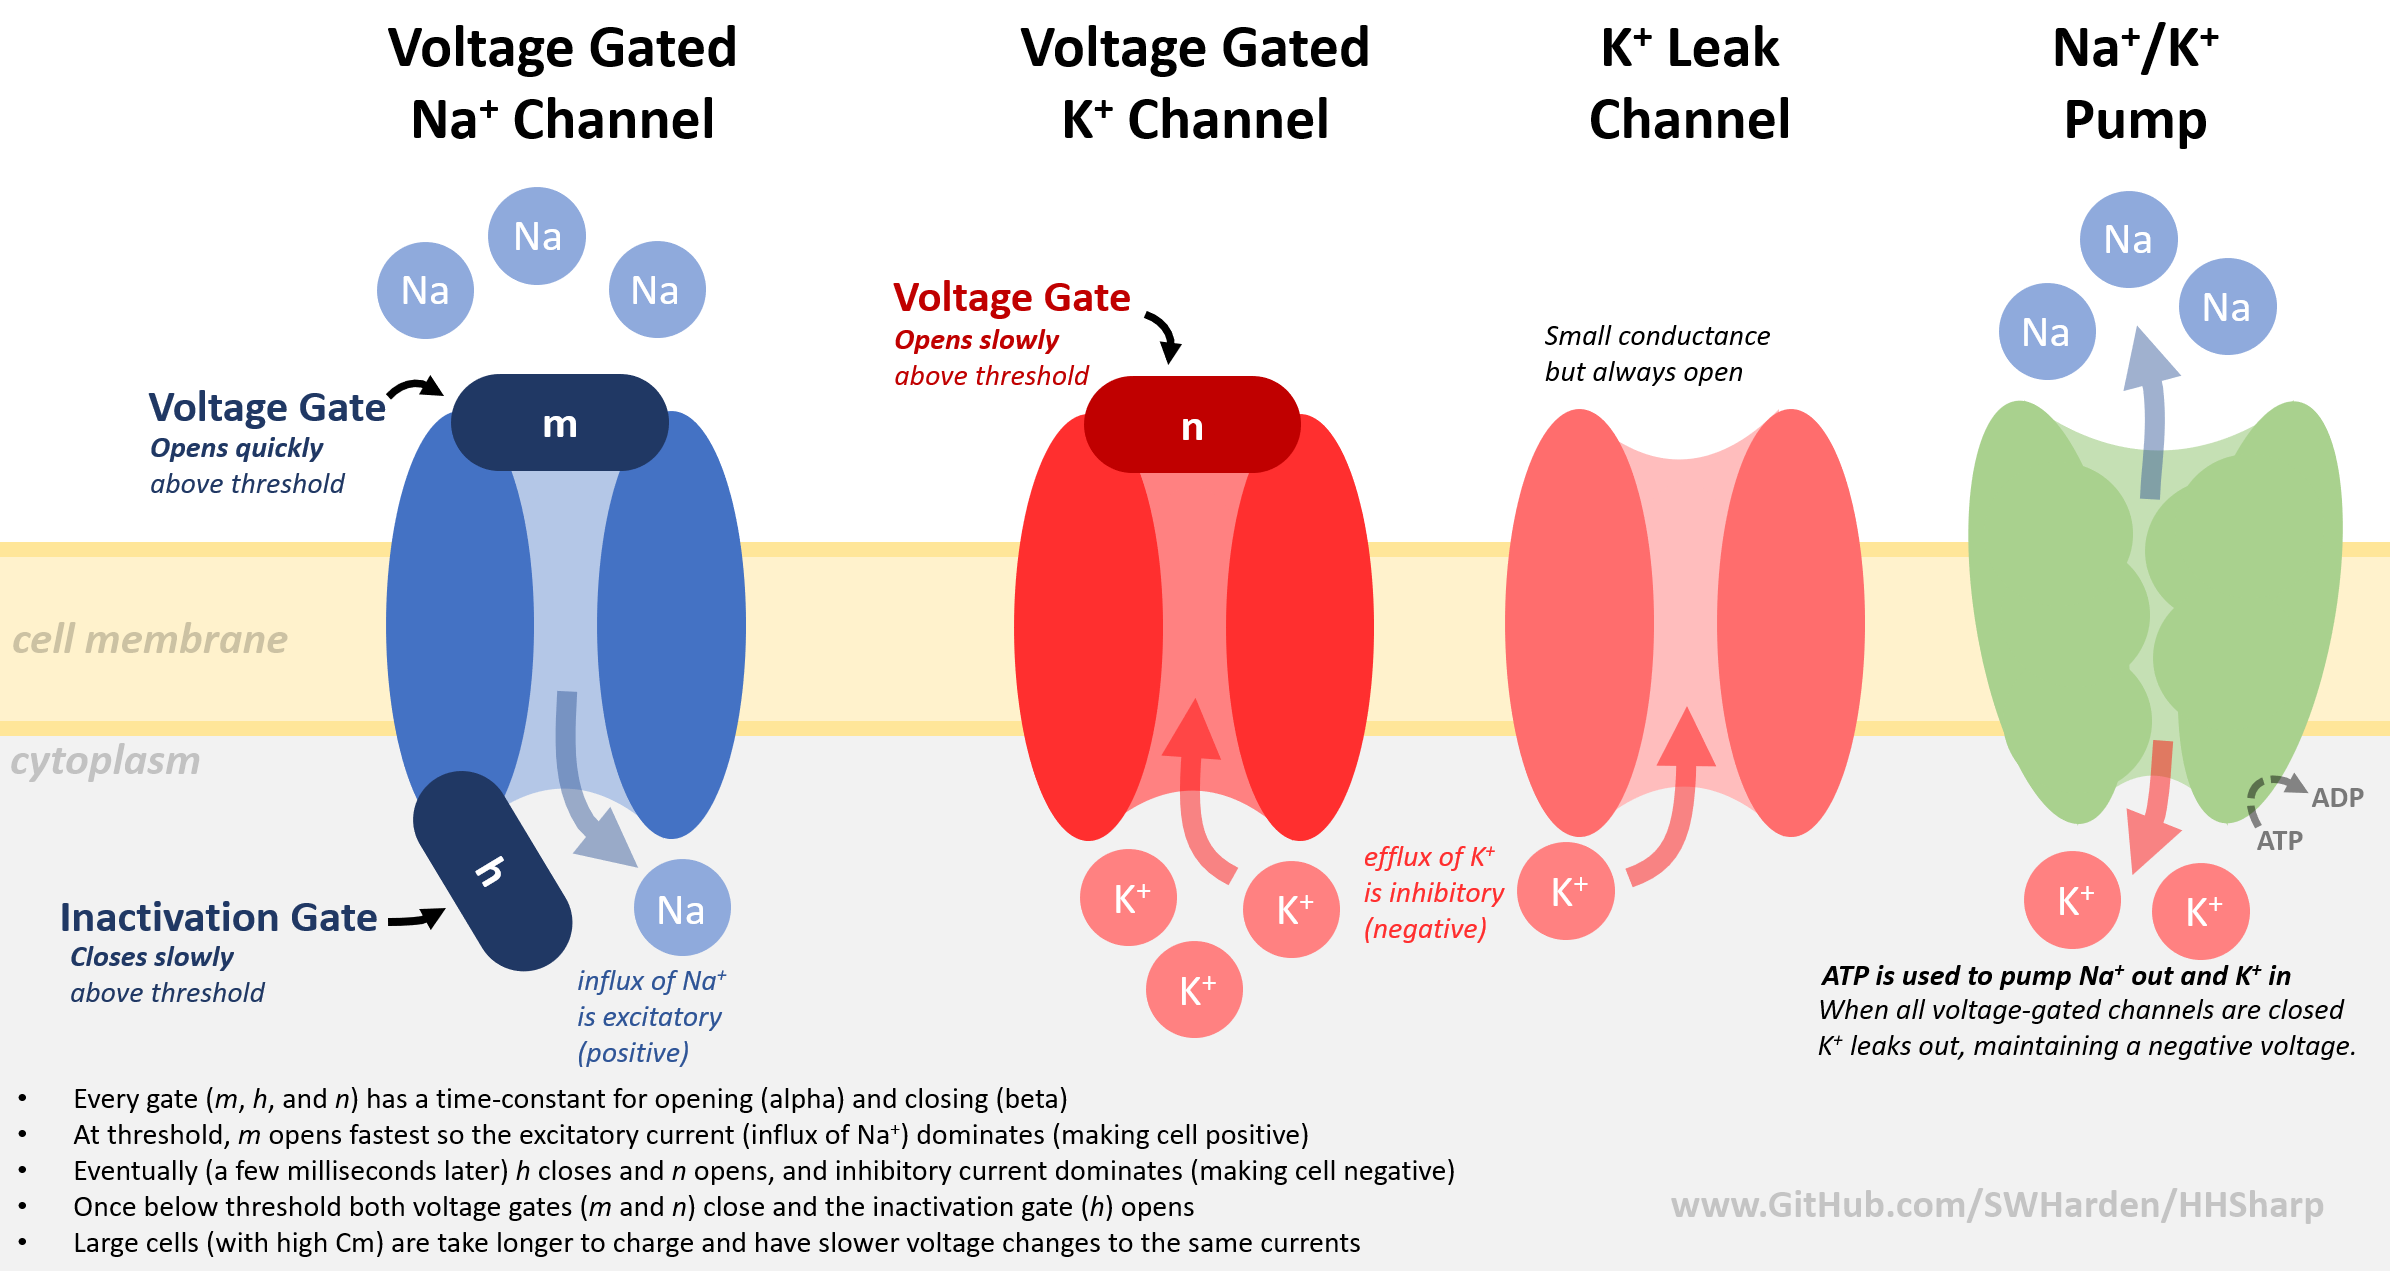
# customize a neuron model if desired model = pyhh.HHModel() model.gNa = 100 # typically 120 model.gK = 5 # typically 36 model.EK = -35 # typically -12 # customize a stimulus waveform stim = np.zeros(20000) stim[7000:13000] = 50 # add a square pulse # simulate the model cell using the custom waveform sim = pyhh.Simulation(model) sim.Run(stimulusWaveform=stim, stepSizeMs=0.01)# plot the results with MatPlotLib plt.figure(figsize=(10, 8)) ax1 = plt.subplot(411) ax1.plot(sim.times, sim.Vm - 70, color='b') ax1.set_ylabel("Potential (mV)") ax1.set_title("Hodgkin-Huxley Spiking Neuron Model", fontSize=16) ax2 = plt.subplot(412) ax2.plot(sim.times, stim, color='r') ax2.set_ylabel("Stimulation (µA/cm²)") ax3 = plt.subplot(413, sharex=ax1) ax3.plot(sim.times, sim.StateH, label='h') ax3.plot(sim.times, sim.StateM, label='m') ax3.plot(sim.times, sim.StateN, label='n') ax3.set_ylabel("Activation (frac)") ax3.legend() ax4 = plt.subplot(414, sharex=ax1) ax4.plot(sim.times, sim.INa, label='VGSC') ax4.plot(sim.times, sim.IK, label='VGKC') ax4.plot(sim.times, sim.IKleak, label='KLeak') ax4.set_ylabel("Current (µA/cm²)") ax4.set_xlabel("Simulation Time (milliseconds)") ax4.legend() plt.tight_layout() plt.savefig("tests/demo.png") plt.show()Visit https://github.com/swharden/HHSharp for code concepts and simulation notes. Although the language is different, the biology and implementation is the same.
- Hodgkin and Huxley, 1952 (the original manuscript)
- The Hodgkin-Huxley Mode (The GENESIS Simulator, Chapter 4)
- Wikipedia: Hodgkin–Huxley model
- Hodgkin-Huxley spiking neuron model in Python by Giuseppe Bonaccorso - a HH model which uses the
scipy.integrate.odeintordinary differential equation solver - Introduction to Computational Modeling: Hodgkin-Huxley Model by Andrew Jahn - a commentary of the HH model with matlab code which discretely simulates conductances
- NeuroML Hodgkin Huxley Tutorials
- Summary of the Hodgkin-Huxley model by Dave Beeman


