Your code reads some data, processes it, and uses too much memory. In order to reduce memory usage, you need to learn what code is responsible, and specifically what code is responsible for peak memory usage.
And that's exactly what Fil will help you find. Fil an open source memory profiler designed for data processing applications written in Python, and includes native support for Jupyter.
At the moment it only runs on Linux and macOS.
"Within minutes of using your tool, I was able to identify a major memory bottleneck that I never would have thought existed. The ability to track memory allocated via the Python interface and also C allocation is awesome, especially for my NumPy / Pandas programs."
—Derrick Kondo
For more information, including an example of the output, see https://pythonspeed.com/products/filmemoryprofiler/
Assuming you're on macOS or Linux, and are using Python 3.6 or later, you can use either Conda or pip (or any tool that is pip-compatible and can install manylinux2010 wheels).
To install on Conda:
$ conda install -c conda-forge filprofilerTo install the latest version of Fil you'll need Pip 19 or newer. You can check like this:
$ pip --version pip 19.3.0If you're using something older than v19, you can upgrade by doing:
$ pip install --upgrade pip If that doesn't work, try running that in a virtualenv.
Assuming you have a new enough version of pip:
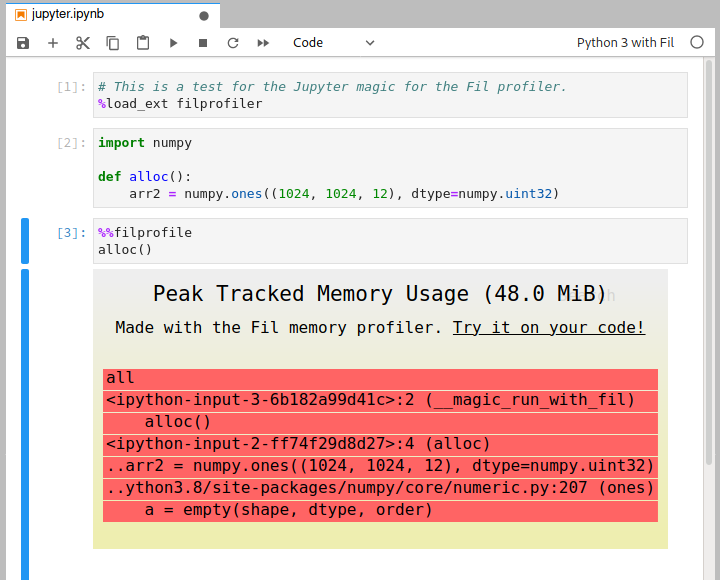
$ pip install filprofilerTo measure memory usage of some code in Jupyter you need to do three things:
- Use an alternative kernel, "Python 3 with Fil". You can choose this kernel when you create a new notebook, or you can switch an existing notebook in the Kernel menu; there should be a "Change Kernel" option in there in both Jupyter Notebook and JupyterLab.
- Load the extension by doing
%load_ext filprofiler. - Add the
%%filprofilemagic to the top of the cell with the code you wish to profile.
Instead of doing:
$ python yourscript.py --input-file=yourfileJust do:
$ fil-profile run yourscript.py --input-file=yourfile And it will generate a report.
As of version 0.11, you can also run it like this:
$ python -m filprofiler run yourscript.py --input-file=yourfile First, run free to figure out how much memory is available—in this case about 6.3GB—and then set a corresponding limit on virtual memory with ulimit:
$ free -h total used free shared buff/cache available Mem: 7.7Gi 1.1Gi 6.3Gi 50Mi 334Mi 6.3Gi Swap: 3.9Gi 3.0Gi 871Mi $ ulimit -Sv 6300000Then, run your program under Fil, and it will generate a SVG at the point in time when memory runs out:
$ fil-profile run oom.py ... =fil-profile= Wrote memory usage flamegraph to fil-result/2020-06-15T12:37:13.033/out-of-memory.svgYou've found where memory usage is coming from—now what?
If you're using data processing or scientific computing libraries, I have written a relevant guide to reducing memory usage.
Fil uses the LD_PRELOAD/DYLD_INSERT_LIBRARIES mechanism to preload a shared library at process startup. This shared library captures all memory allocations and deallocations and keeps track of them.
At the same time, the Python tracing infrastructure (used e.g. by cProfile and coverage.py) to figure out which Python callstack/backtrace is responsible for each allocation.
In general, Fil will track allocations in threads correctly.
First, if you start a thread via Python, running Python code, that thread will get its own callstack for tracking who is responsible for a memory allocation.
Second, if you start a C thread, the calling Python code is considered responsible for any memory allocations in that thread. This works fine... except for thread pools. If you start a pool of threads that are not Python threads, the Python code that created those threads will be responsible for all allocations created during the thread pool's lifetime.
Therefore, in order to ensure correct memory tracking, Fil disables thread pools in BLAS (used by NumPy), BLOSC (used e.g. by Zarr), OpenMP, and numexpr. They are all set to use 1 thread, so calls should run in the calling Python thread and everything should be tracked correctly. The downside is that this can reduce performance in some cases, since you're doing computation with one CPU instead of many.
Fil does this for the whole program when using fil-profile run. When using the Jupyter kernel, anything run with the %%filprofile magic will have thread pools disabled, but other code should run normally.
Fil will track memory allocated by:
- Normal Python code.
- C code using
malloc()/calloc()/realloc()/posix_memalign(). - C++ code using
new(including viaaligned_alloc()). - Anonymous
mmap()s. - Fortran 90 explicitly allocated memory (tested with gcc's
gfortran).
Still not supported, but planned:
mremap()(resizing ofmmap()).- File-backed
mmap(). The semantics are somewhat different than normal allocations or anonymousmmap(), since the OS can swap it in or out from disk transparently, so supporting this will involve a different kind of resource usage and reporting. - Other forms of shared memory, need to investigate if any of them allow sufficient allocation.
- Anonymous
mmap()s created via/dev/zero(not common, since it's not cross-platform, e.g. macOS doesn't support this). memfd_create(), a Linux-only mechanism for creating in-memory files.- Possibly
memalign,valloc(),pvalloc(),reallocarray(). These are all rarely used, as far as I can tell.
Copyright 2020 Hyphenated Enterprises LLC
Licensed under the Apache License, Version 2.0 (the "License"); you may not use this file except in compliance with the License. You may obtain a copy of the License at
http://www.apache.org/licenses/LICENSE-2.0 Unless required by applicable law or agreed to in writing, software distributed under the License is distributed on an "AS IS" BASIS, WITHOUT WARRANTIES OR CONDITIONS OF ANY KIND, either express or implied. See the License for the specific language governing permissions and limitations under the License.