Map Machine is a Python OpenStreetMap renderer and tile generator.
| Tests |  |
|---|---|
| Activity |    |
| QA |  |
| Other |   |
The Map Machine project consists of
- a Python OpenStreetMap renderer:
- SVG map generation,
- SVG and PNG tile generation,
- the Röntgen icon set: unique CC-BY 4.0 map icons.
The idea behind the Map Machine project is to show all the richness of the OpenStreetMap data: to have a possibility to display any map feature represented by OpenStreetMap data tags by means of colors, shapes, and icons. Map Machine is created both for map contributors: to display all changes one made on the map even if they are small, and for map users: to dig down into the map and find every detail that was mapped.
Unlike standard OpenStreetMap layers, Map Machine is a playground for experiments where one can easily try to support any unsupported tag, proposed tagging scheme, tags with little or even single usage, deprecated ones that are still in use.
Map Machine is intended to be highly configurable, so it can generate precise but messy maps for OSM contributors as well as pretty and clean maps for OSM users. It can also use some slow algorithms for experimental features.
map-machine render -b 2.284,48.860,2.290,48.865will automatically download OSM data and render an SVG map of the specified area to out/map.svg.
map-machine tile -b 2.361,48.871,2.368,48.875will automatically download OSM data and render PNG tiles that cover the specified area to the out/tiles directory.
The central feature of the project is the Röntgen icon set. It is a set of monochrome 14 × 14 px pixel-aligned icons specially created for the Map Machine project. Unlike the Map Machine source code, which is under the MIT license, all icons are under the CC BY license. So, with the appropriate credit the icon set can be used outside the project. Some icons can be used as emoji symbols.
All icons tend to support a common design style, which is heavily inspired by Maki, Osmic, and Temaki.

Generate an icon grid and sets of individual icons with map-machine icons. It will update the doc/grid.svg file, and create SVG files in the out/icons_by_id directory where files are named using shape identifiers (e.g. power_tower_portal_2_level.svg) and in the icons_by_name directory where files are named using shape names (e.g. Röntgen portal two-level transmission tower.svg).
Map Machine uses icons to visualize tags for nodes and areas. But unlike other renderers, Map Machine can use more than one icon to visualize an entity and can use colors to visualize colour value or other entity properties (like material or genus).
With --buildings isometric or --buildings isometric-no-parts (not set by default), buildings are drawn using isometric shapes for walls and shade in proportion to building:levels, building:min_level, height, and min_height values.
map-machine render -c -26.19049,28.05605 -s 600,400 --buildings isometric
To determine the road width Map Machine uses the width tag value or estimates it based on the lanes value. If lane value is specified, it also draws lane separators. This map style is highly inspired by Christoph Hormann's post Navigating the Maze.
map-machine render -c 47.61224,-122.33866 -s 600,400
Visualization of tree leaf types (broadleaved or needle-leaved) and genus or taxon by means of icon shapes and leaf cycles (deciduous or evergreen) by means of color.

direction tag values for tourism = viewpoint and camera:direction for man_made = surveillance are rendered with sectors displaying the direction and angle (15º if angle is not specified) or the whole circle for panorama view. Radial gradient is used for surveillance and inverted radial gradient is used for viewpoints.
map-machine render -c 52.50892,13.3244 -s 600,400 -z 18.5

Visualize design values used with power = tower and power = pole tags. design has more than 1 million usages in OpenStreetMap.
![]()

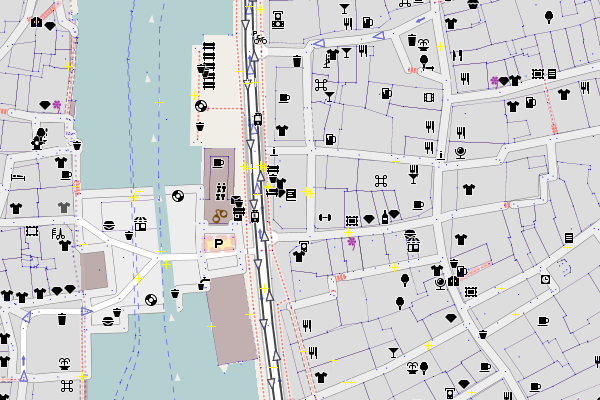
Map icons have colour tag value if it is present, otherwise, icons are displayed with dark grey color by default, purple color for shop nodes, red color for emergency features, and special colors for natural features. Map Machine also takes into account building:colour, roof:colour and other *:colour tags, and uses the colour tag value to paint subway lines.

![]()
Japanese maps usually use special symbols called chizukigou (地図記号) which are different from standard map symbols used in other countries. They can be enabled with --country jp option.
![]()
Draw indoor features specifying level with --level option. Possible values are numbers (e.g. 1, 0.5), lists of number separated by ; (e.g. 1;2;4;4.5), all, overground, and underground. The default value is not all, but overground, so underground objects are not shown on the map if --level option is not specified.
map-machine render -c 4.5978,-74.07507 -s 600,400 -z 19.5 --level 0
One of the key features of Map Machine is constructing icons from several shapes.
For man_made = mast distinguish types (communication, lighting, monitoring, and siren) and construction (freestanding or lattice, and using of guys) are rendered by combining 7 unique icon shapes.

For natural = volcano status (active, dormant, extinct, or unspecified) and type (stratovolcano, shield, or scoria) are rendered by combining 7 unique icon shapes.

Visualize element creation time with --mode time.

Every way and node displayed with the random color picked for each author with --mode author.

The render command is used to generate an SVG map from OpenStreetMap data. You can run it using:
map-machine render \ -b <min longitude>,<min latitude>,<max longitude>,<max latitude> \ -o <output file name> \ -z <OSM zoom level> \ <other arguments>map-machine render \ --boundary-box 2.284,48.860,2.290,48.865 \ --output out/esplanade_du_trocadéro.svgwill download OSM data to cache/2.284,48.860,2.290,48.865.osm and render an SVG map of the specified area to out/esplanade_du_trocadéro.svg.
-i,--input<path>-- input XML file name or names (if not specified, file will be downloaded using the OpenStreetMap API)-o,--output<path>-- output SVG file name, default value:out/map.svg-b,--boundary-box<lon1>,<lat1>,<lon2>,<lat2>-- geo boundary box--cache<path>-- path for temporary OSM files, default value:cache-z,--zoom<float>-- OSM zoom level, default value: 18.0-c,--coordinates<latitude>,<longitude>-- coordinates of any location inside the tile-s,--size<width>,<height>-- resulted image size
plus standard map configuration options.
Command tile is used to generate PNG tiles for slippy maps. To use them, run Map Machine's tile server.
-c,--coordinates<latitude>,<longitude>-- coordinates of any location inside the tile-t,--tile<zoom level>/<x>/<y>-- tile specification--cache<path>-- path for temporary OSM files, default value:cache-b,--boundary-box<lon1>,<lat1>,<lon2>,<lat2>-- construct the minimum amount of tiles that cover the requested boundary box-z,--zoom<range>-- OSM zoom levels; can be list of numbers or ranges, e.g.16-18,16,17,18, or16,18-20, default value:18-i,--input<path>-- input OSM XML file name (if not specified, the file will be downloaded using the OpenStreetMap API)
plus standard map configuration options.
Specify the tile coordinates:
map-machine tile --tile <OSM zoom level>/<x>/<y>or specify any geographical coordinates inside a tile:
map-machine tile \ --coordinates <latitude>,<longitude> \ --zoom <OSM zoom levels>The tile will be stored as an SVG file out/tiles/tile_<zoom level>_<x>_<y>.svg and a PNG file out/tiles/tile_<zoom level>_<x>_<y>.svg, where x and y are tile coordinates. The --zoom option will be ignored if it is used with the --tile option.
Example:
map-machine tile -c 55.7510637,37.6270761 -z 18will generate an SVG file out/tiles/tile_18_158471_81953.svg and a PNG file out/tiles/tile_18_158471_81953.png.
Specify the boundary box to get the minimal set of tiles that covers the area:
map-machine tile \ --boundary-box <min longitude>,<min latitude>,<max longitude>,<max latitude> \ --zoom <OSM zoom levels>The boundary box will be extended to the boundaries of the minimal tileset that covers the area, then it will be extended a bit more to avoid some artifacts on the edges rounded to 3 digits after the decimal point. The map with the new boundary box coordinates will be written to the cache directory as SVG and PNG files. All tiles will be stored as SVG files out/tiles/tile_<zoom level>_<x>_<y>.svg and PNG files out/tiles/tile_<zoom level>_<x>_<y>.svg, where x and y are tile coordinates.
Example:
map-machine tile -b 2.361,48.871,2.368,48.875will generate 36 PNG tiles at zoom level 18 from tile 18/132791/90164 all the way to 18/132796/90169 and two cached files cache/2.360,48.869,2.370,48.877_18.svg and cache/2.360,48.869,2.370,48.877_18.png.
The server command is used to run a tile server for slippy maps.
map-machine serverStop server interrupting the process with Ctrl + C.
--cache<path>-- path for temporary OSM files, default value:cache--port<integer>-- port number, default value: 8080
Create a minimal amount of tiles that cover specified boundary box for zoom levels 16, 17, 18, and 19:
map-machine tile -b 2.364,48.854,2.367,48.857 -z 16-19Run tile server on 127.0.0.1:8080:
map-machine serverUse JavaScript code for Leaflet:
var map = L.map('mapid').setView([48.8555, 2.3655], 18); L.tileLayer('http://127.0.0.1:8080/tiles/{z}/{x}/{y}', { maxZoom: 19, attribution: 'Map data © ' + '<a href="https://www.openstreetmap.org/copyright">OpenStreetMap</a> ' + 'contributors, imagery © ' + '<a href="https:/github.com/enzet/map-machine">Map Machine</a>', id: 'map_machine', tileSize: 256, zoomOffset: 0 }).addTo(map);HTML code:
<div id="mapid" style="width: 1000px; height: 600px;"></div>Map configuration options used by render and tile commands:
--scheme<id> or <path>-- scheme identifier (look for<id>.ymlfile) or path to a YAML scheme file, default value:default--buildings<mode>-- building drawing mode: no, flat, isometric, isometric-no-parts, default value:flat--mode<string>-- map drawing mode: normal, author, time, white, black, default value:normal--overlap<integer>-- how many pixels should be left around icons and text, default value: 12--labels<string>-- label drawing mode: no, main, all, address, default value:main--level-- display only this floor level, default value:overground--seed<string>-- seed for random--tooltips-- add tooltips with tags for icons in SVG files--country-- two-letter code (ISO 3166-1 alpha-2) of country, that should be used for location restrictions, default value:world--ignore-level-matching-- draw all map features ignoring the current level--roofs-- draw building roofs, set by default--building-colors-- paint walls (if isometric mode is enabled) and roofs with specified colors--show-overlapped-- show hidden nodes with a dot
The mapcss command can be used to generate a MapCSS scheme. map-machine mapcss will create an out/map_machine_mapcss directory with simple MapCSS 0.2 scheme adding icons from the Röntgen icon set to nodes and areas: .mapcss file and directory with icons.
To create a MapCSS style with Map Machine style also for ways and relations, run map-machine mapcss --ways.
--icons-- add icons for nodes and areas, set by default--ways-- add style for ways and relations--lifecycle-- add icons for lifecycle tags; be careful: this will increase the number of node and area selectors by 9 times, set by default
- Run
map-machine mapcss.- Open JOSM.
- Go to
Preferences→ Third tab on the left →Map Paint Styles.- Active styles: press
+.- URL / File: set path to
out/map_machine_mapcss/map_machine.mapcss.
To enable/disable the Map Machine map paint style go to View → Map Paint Styles → Map Machine.
Example of using Röntgen icons on top of the Mapnik style in JOSM. Map Paint Styles look like this:
- ✓ Mapnik (true)
- ✓ Map Machine
First install the cairo 2D graphic library, and the GEOS library.
map-machine can be installed from GitHub.
To install with pip:
$ python -m pip install git+https://github.com/potbanksoftware/map-machine