Chart.display() seems not working, and raw output of Chart.to_js_literal() is not an out-of-the-box feature. #42
Description
Describe the bug
My first attempt at dispay chart in jupyter notebook, but Chart.display() seems not working.
And encounter another issue when I turn to Chart.to_js_literal().
To Reproduce
Steps to reproduce the behavior:
-
Create a python 3.10 environment with conda.
-
Create a .ipynb file import all requirements needed (pandas, highcharts_core ...).
-
Create a sample dataframe with 3 columns(x: int,y: int, id: str).
-
Use Chart.from_pandas() to create my_chart variable.
-
Screen snapshot of output of my_chart.display().

-
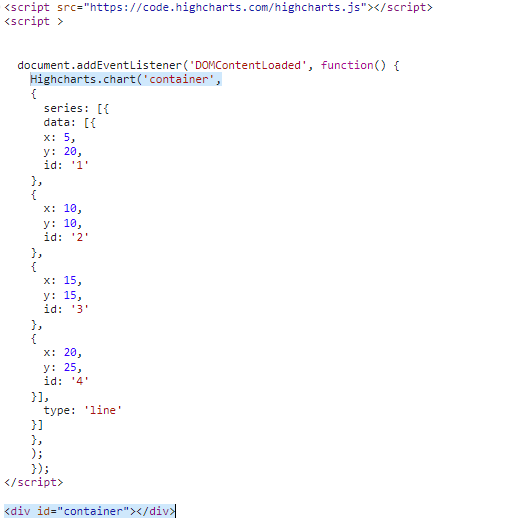
Chart.to_js_literal('app.js') export raw output to app.js, and import the app.js in index.html.

-
And I tried to remove "new" and specify the container fixed the issue.
Expected behavior
I expected to reproduce the basic-line demo, and display chart in jupyter notebook.
Your Environment:
- OS: Windows
- Python Version: 3.10
- Highcharts JavaScript Version: last