
Introducing JBChartView - Jawbone's iOS-based charting library for both line and bar graphs. It is easy to set-up, and highly customizable.
- Drop-in UIView subclass supported across all devices.
- Line and bar graph support.
- Simple to use protocols modeled after a UITableView.
- Highly customizable.
- Expand & collapse animation support.
Refer to the <a href="changelog">https://github.com/Jawbone/JBChartView/blob/master/CHANGELOG.md"">changelog for an overview of JBChartView's feature history.
- Requires iOS 7 or later
- Requires Automatic Reference Counting (ARC)
Build and run the JBChartViewDemo project in Xcode. The demo demonstrates the use of both the line and bar charts. It also outlines how a chart's appearance can be customized.
CocoaPods is the recommended method of installing JBChartView.
Simply add the following line to your Podfile:
pod 'JBChartView' Your Podfile should look something like:
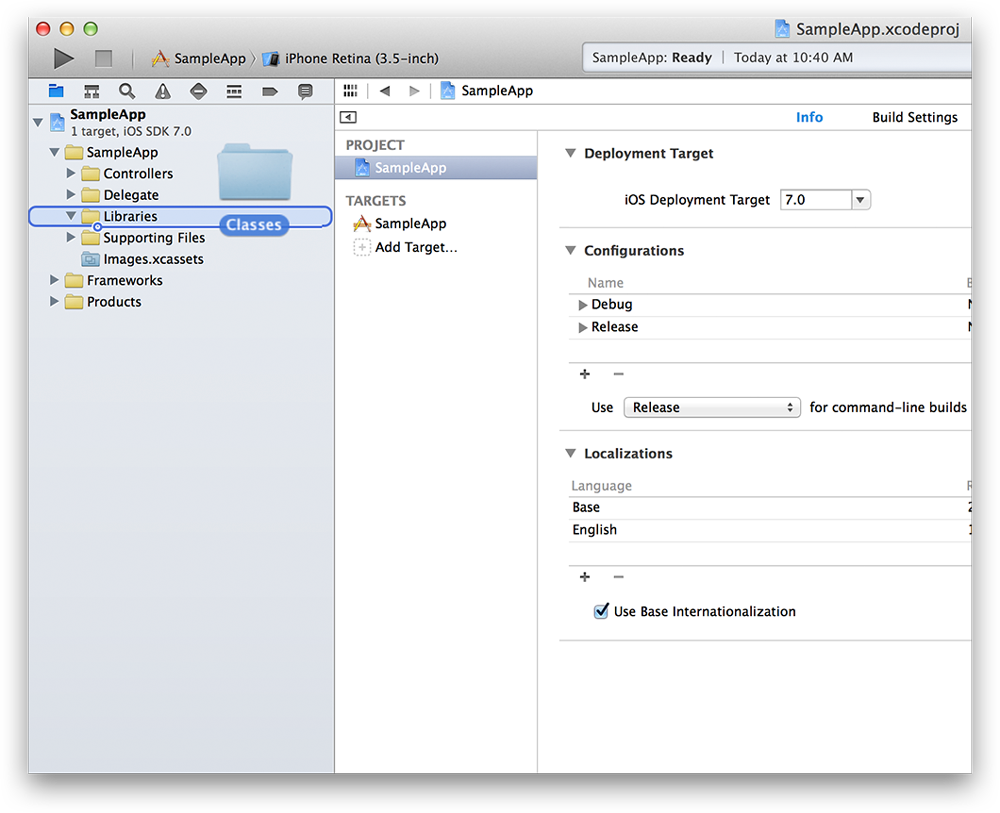
platform :ios, '7.0' pod 'JBChartView', '~> 2.4.2' The simpliest way to use JBChartView with your application is to drag and drop the /Classes folder into you're Xcode 5 project. It's also recommended you rename the /Classes folder to something more descriptive (ie. "Jawbone - JBChartView").
All JBChartView implementations have a similiar data source and delgate pattern to UITableView. If you're familiar with using a UITableView or UITableViewController, using a JBChartView subclass should be a breeze!
To initialize a JBBarChartView, you only need a few lines of code (see below). Bar charts can also be initialized via a nib or with a frame.
JBBarChartView *barChartView = [[JBBarChartView alloc] init]; barChartView.delegate = self; barChartView.dataSource = self; [self addSubview:barChartView]; At a minimum, you need to inform the data source how many bars are in the chart:
- (NSInteger)numberOfBarsInBarChartView:(JBBarChartView *)barChartView { return ...; // number of bars in chart } Secondly, you need to inform the delegate the height of each bar (automatically normalized across the entire chart):
- (CGFloat)barChartView:(JBBarChartView *)barChartView heightForBarViewAtAtIndex:(NSInteger)index { return ...; // height of bar at index } Lastly, ensure you have set the frame of your barChartView & call reloadData at least once:
barChartView.frame = CGRectMake( ... ); [barChartView reloadData]; Similiarily, to initialize a JBLineChartView, you only need a few lines of code (see below). Line charts can also be initialized via a nib or with a frame.
JBLineChartView *lineChartView = [[JBLineChartView alloc] init]; lineChartView.delegate = self; lineChartView.dataSource = self; [self addSubview:lineChartView]; At a minimum, you need to inform the data source how many lines and vertical data points (for each line) are in the chart:
- (NSUInteger)numberOfLinesInLineChartView:(JBLineChartView *)lineChartView { return ...; // number of lines in chart } - (NSUInteger)lineChartView:(JBLineChartView *)lineChartView numberOfVerticalValuesAtLineIndex:(NSUInteger)lineIndex { return ...; // number of values for a line } Secondly, you need to inform the delegate of the y-position of each point (automatically normalized across the entire chart) for each line in the chart:
- (CGFloat)lineChartView:(JBLineChartView *)lineChartView verticalValueForHorizontalIndex:(NSUInteger)horizontalIndex atLineIndex:(NSUInteger)lineIndex { return ...; // y-position (y-axis) of point at horizontalIndex (x-axis) } Lastly, ensure you have set the frame of your lineChartView & call reloadData at least once:
lineChartView.frame = CGRectMake( ... ); [lineChartView reloadData]; Both the line and bar charts support a robust set of customization options.
The background of a bar or line chart can be set just like any other view:
self.barChartView.backgroundColor = ...; // UIColor self.lineChartView.backgroundColor = ...; // UIColor Any JBChartView subclass supports the use of headers and footers (similiar to that of UITableView):
self.barChartView.footerView = ...; // UIView self.lineChartView.headerView = ...; // UIView Lastly, any JBChartView subclass can be collapsed or expanded programmatically via the state property. If you chose to animate state changes, a callback helper can be used to notify you when the animation has completed:
- (void)setState:(JBChartViewState)state animated:(BOOL)animated callback:(void (^)())callback; By default, a chart's bars will be black and flat. They can be customized by supplying a UIView subclass through the optional protocol:
- (UIView *)barChartView:(JBBarChartView *)barChartView barViewAtIndex:(NSUInteger)index { return ...; // color of line in chart } Furthermore, the color of the selection bar (on touch events) can be customized via the optional protocol:
- (UIColor *)barSelectionColorForBarChartView:(JBBarChartView *)barChartView { return ...; // color of selection view } Lastly, a bar chart's selection events are delegated back via:
- (void)barChartView:(JBBarChartView *)barChartView didSelectBarAtIndex:(NSUInteger)index touchPoint:(CGPoint)touchPoint { // Update view } - (void)didUnselectBarChartView:(JBBarChartView *)barChartView { // Update view } The touchPoint is especially important as it allows you to add custom elements to your chart during selection events. Refer to the demo project (JBarChartViewController) to see how a tooltip can be used to display additional information during selection events.
The color, width and style of each line in the chart can be customized via the optional protocol:
- (UIColor *)lineChartView:(JBLineChartView *)lineChartView colorForLineAtLineIndex:(NSUInteger)lineIndex { return ...; // color of line in chart } - (CGFloat)lineChartView:(JBLineChartView *)lineChartView widthForLineAtLineIndex:(NSUInteger)lineIndex { return ...; // width of line in chart } - (JBLineChartViewLineStyle)lineChartView:(JBLineChartView *)lineChartView lineStyleForLineAtLineIndex:(NSUInteger)lineIndex { return ...; // style of line in chart } Furthermore, the color and width of the selection view along with the color of the selected line can be customized via the optional protocols:
- (UIColor *)verticalSelectionColorForLineChartView:(JBLineChartView *)lineChartView { return ...; // color of selection view } - (CGFloat)verticalSelectionWidthForLineChartView:(JBLineChartView *)lineChartView { return ...; // width of selection view } - (UIColor *)lineChartView:(JBLineChartView *)lineChartView selectionColorForLineAtLineIndex:(NSUInteger)lineIndex { return ...; // color of selected line } By default, each line will not show dots for each point. To enable this on a per-line basis:
- (BOOL)lineChartView:(JBLineChartView *)lineChartView showsDotsForLineAtLineIndex:(NSUInteger)lineIndex; To customize the size of each dot (default 3x the line width), implement:
- (CGFloat)lineChartView:(JBLineChartView *)lineChartView dotRadiusForLineAtLineIndex:(NSUInteger)lineIndex; To customize the color of each dot during selection and non-selection events (default is white and black respectively), implement:
- (UIColor *)lineChartView:(JBLineChartView *)lineChartView colorForDotAtHorizontalIndex:(NSUInteger)horizontalIndex atLineIndex:(NSUInteger)lineIndex; - (UIColor *)lineChartView:(JBLineChartView *)lineChartView selectionColorForDotAtHorizontalIndex:(NSUInteger)horizontalIndex atLineIndex:(NSUInteger)lineIndex; As well, by default, each line will have squared off end caps and connection points. To enable rounded connections and end caps:
- (BOOL)lineChartView:(JBLineChartView *)lineChartView smoothLineAtLineIndex:(NSUInteger)lineIndex; Lastly, a line chart's selection events are delegated back via:
- (void)lineChartView:(JBLineChartView *)lineChartView didSelectLineAtIndex:(NSUInteger)lineIndex horizontalIndex:(NSUInteger)horizontalIndex touchPoint:(CGPoint)touchPoint { // Update view } - (void)didUnselectLineInLineChartView:(JBLineChartView *)lineChartView { // Update view } The touchPoint is especially important as it allows you to add custom elements to your chart during selection events. Refer to the demo project (JBLineChartViewController) to see how a tooltip can be used to display additional information during selection events.
Usage is provided under the Apache License (v2.0). See LICENSE for full details.