The Covid-19 pandemic has had negative impacts on both the physical health and financial well-being of many individuals. Many people lived in stress and isolation due to fear of contracting the virus and social distancing policies. Several important industries such as the airline and restaurant industries were forced to shut their services, and consequently many people became unemployed and faced increasing financial burdens. As existing studies have suggested, the various difficulties accompanying Covid-19 has led to deteriorating mental health across the US population. Data from the Center for Disease Control reveals a sharp rise in the percentage of US adults who reported major depressive disorder and general anxiety disorder immediately after the start of the pandemic. In light of the various negative repercussions Covid-19 has on people's livelihoods, this project aims to study the influence of Covid-19 on mental health. Specifically, we want to answer the following questions:
- Since the start of Covid-19, has there been an overall increase in the prevalence of mental health?
- What are some variables that can predict trends in national mental health?
- Which demographics have been worst influenced by mental health issues?
- Mental Health Data from the Household Pulse Survey Conducted by Center for Disease Control
- Economic Indicators Data from the Bureau of Economic Analysis
- Covid-19 Data from New York Times
Data are collected from multiple sources, cleaned up, and compiled into the following datasets.
| Variable Name | Description |
|---|---|
| State | The state's name |
| Date | The month when data was recorded |
| Grouping Method | How observations are grouped |
| Group | The group the data belongs to |
| Pct_Anxiety | Percentage of adults who reported symptoms of generalized anxiety disorder |
| Pct_Depression | Percentage of adults who reported symptoms of major depressive disorder |
| Pct_Anxiety_Or_Depression | Percentage of adults who reported symptoms of generalized anxiety disorder or major depressive disorder |
| Variable Name | Description |
|---|---|
| State | The state's name |
| Date | The month when data was recorded |
| Fips | Fips code of the state |
| Population | The population size of the state |
| Pct_Anxiety | Percentage of adults who reported symptoms of generalized anxiety disorder |
| Pct_Depression | Percentage of adults who reported symptoms of major depressive disorder |
| Pct_Anxiety_Or_Depression | Percentage of adults who reported symptoms of generalized anxiety disorder or major depressive disorder |
| New_Cases | Total number of new covid cases in the specified month |
| New_Deaths | Total number of new covid deaths in the specified month |
| Cum_Cases | Cumulative number of covid cases |
| Cum_Deaths | Cumulative number of covid deaths |
| Pct_Infection | Percent of the state's population |
| Gdp_Change | Percent change in gdp from the preceding period |
| Income_Change | Percent change in per-capita personal income from the preceding period |
| Adjusted_Income_Change | Percent change in seasonally adjusted per-capita personal income from the preceding period |
| Farm_Income_Change | Percent change in total income generated in farm sectors from the preceding period |
| Nonfarm_Income_Change | Percent change in total income generated in nonfarm sectors from the preceding period |
| Pct_Unemployed | Percent of the labor force unemployed |
| Variable Name | Description |
|---|---|
| State | The state's name |
| Date | The month when data was recorded |
| Policy | The covid-19 related policy introduced |
| Policy_Category | The type of policy introduced |
| Policy_Stage | Whether the policy starts or terminates |
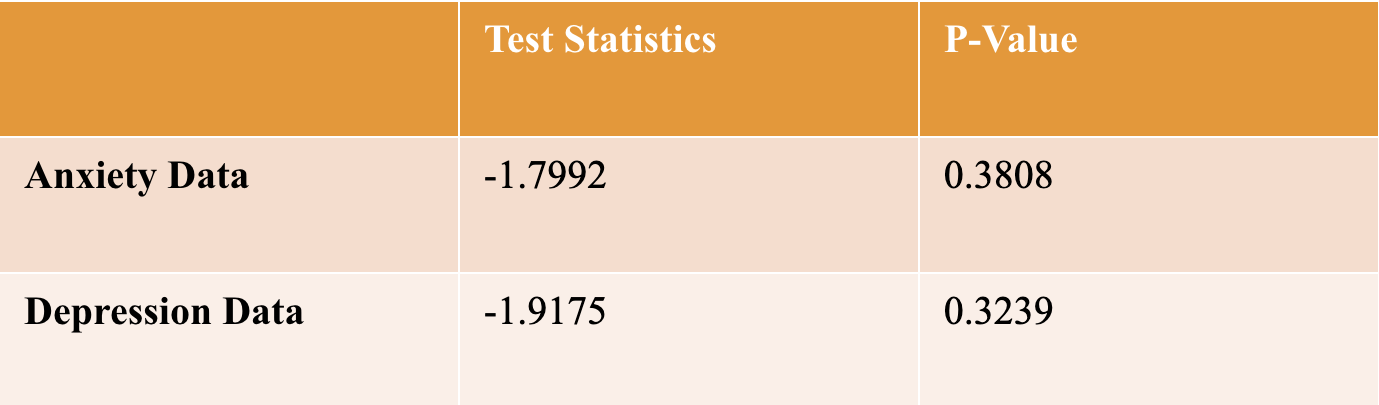
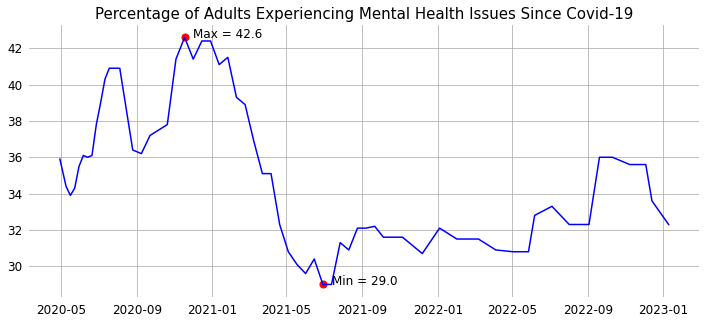
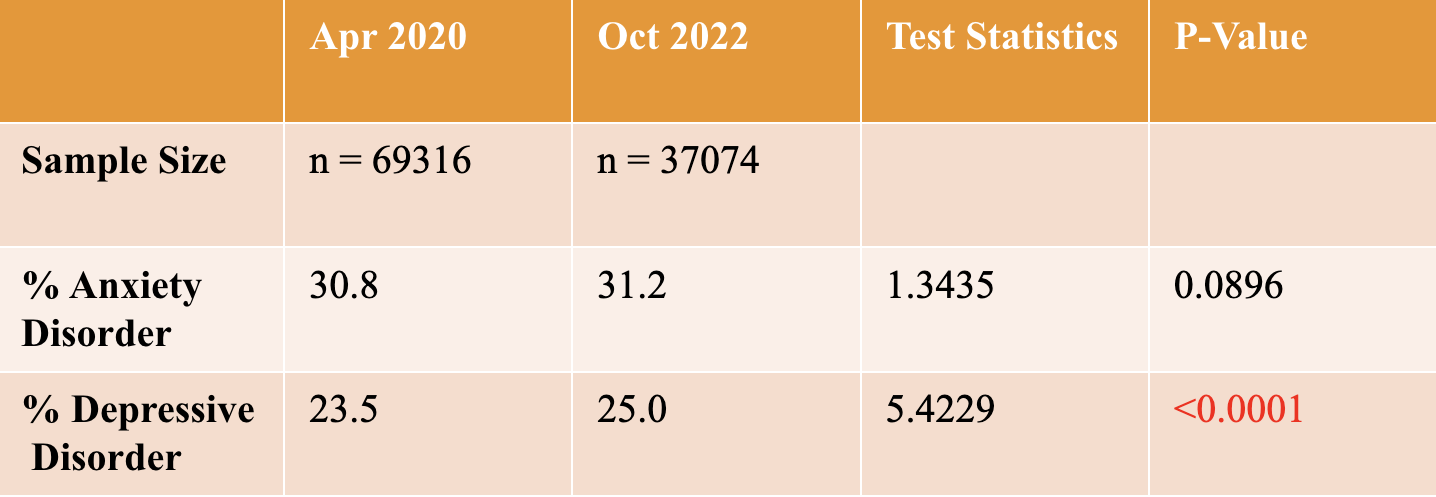
A line chart is created to model the trend in major depressive disorder and general anxiety disorder. While chart reveals significant fluctuations in national percentage of adults reporting mental symptoms, overall there does not appear to be a clear increase or decrease. This is further supported by the result from a two-sample z-test revealing no statistical significant difference in prevalence of mental health issues pre and post covid.
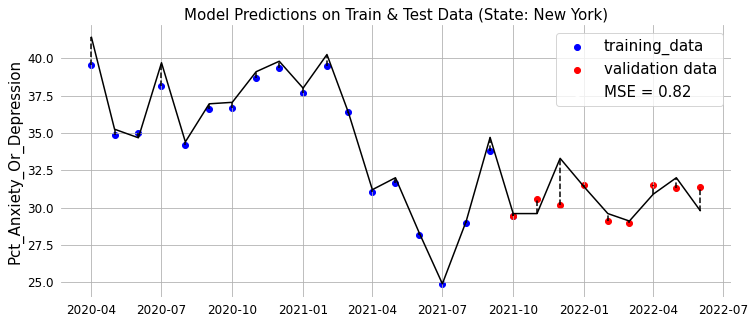
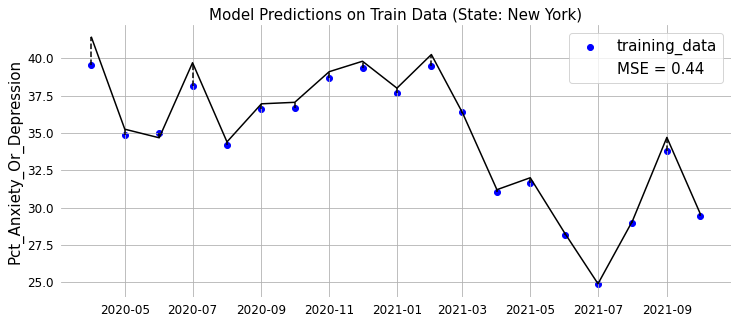
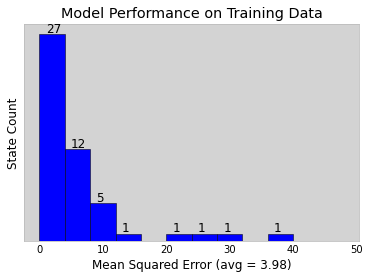
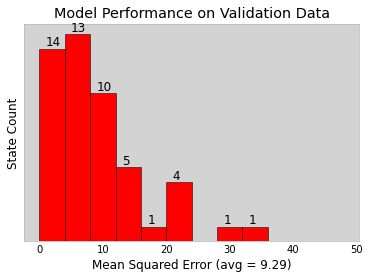
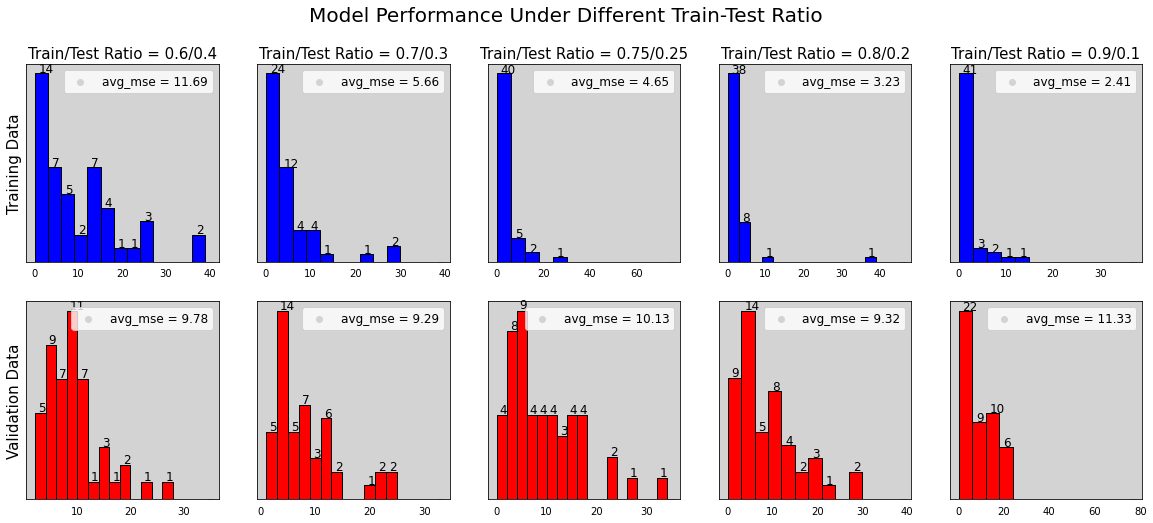
For the purpose of this question, a XGBoost model was created. XGBoost is a supervised learning algorithm well-suited for performing regression analysis on time-series data. The model is applied separate to each US state, with 75% of data used for training and 25% of data used for validation. The following plots are created using data from the state of New York.

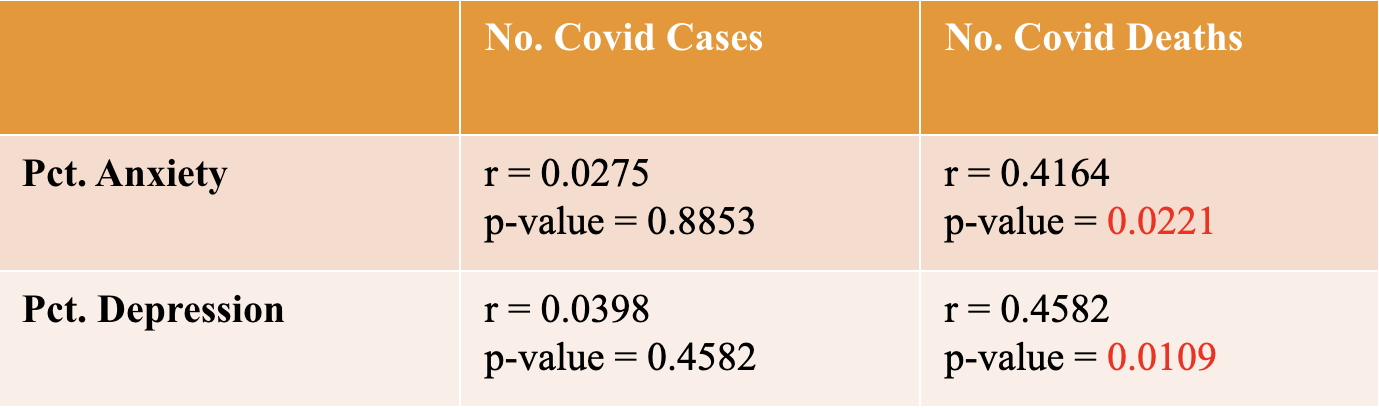
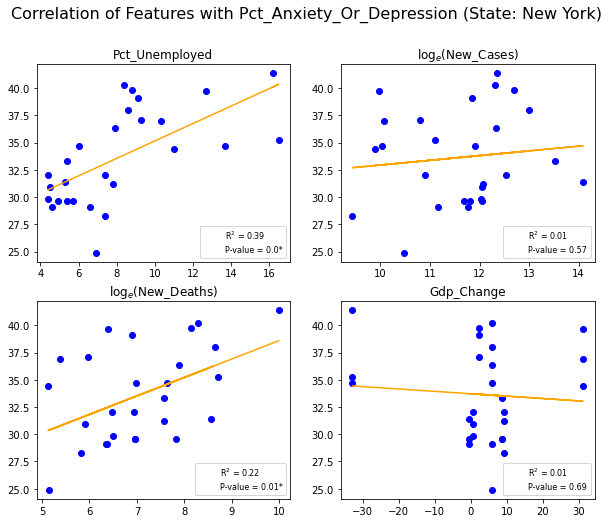
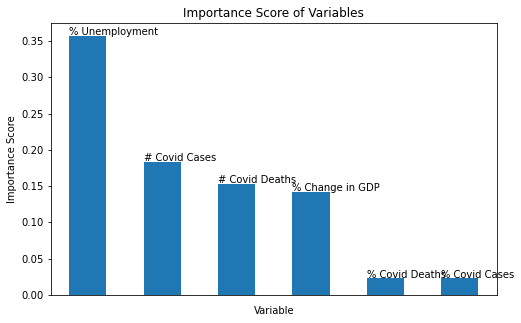
The top-4 relevant variables identified by the model are percent employment, number of daily new deaths, number of daily new cases, and quarterly gdp change. Scatter plots are created to better visualize the relationship between these variables and mental health, with the features on the x axis and the target variable on the y axis.

The model had been manually tuned to optimize performance. The plots below compares the actual data with the model's predictions. As revealed by the plot, while the model seems to perform reasonably well on the training data, its predictions on the test data are not as accurate. In fact, the mean-square error of predictions on the validation data is 1.17 greater than predictions on the training data.

2. What are the most important features, or the most relevant factors to predicting mental health trends?

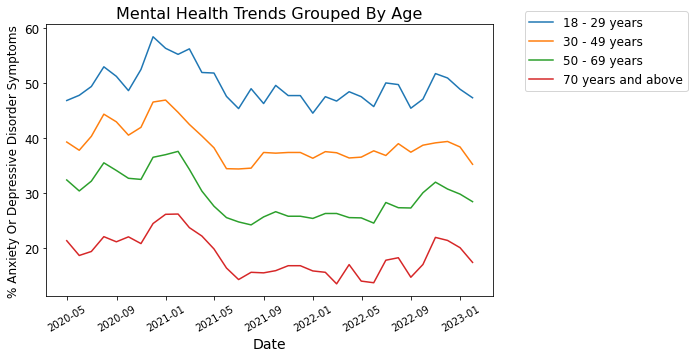
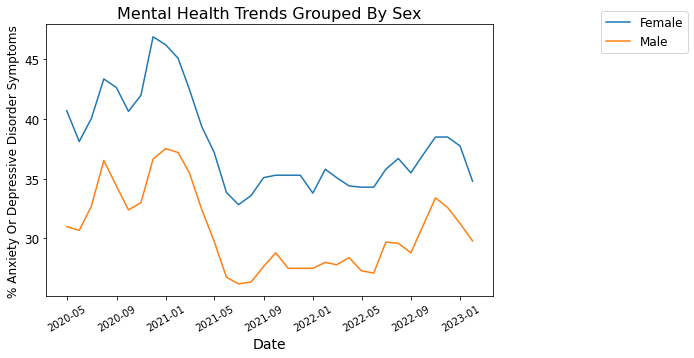
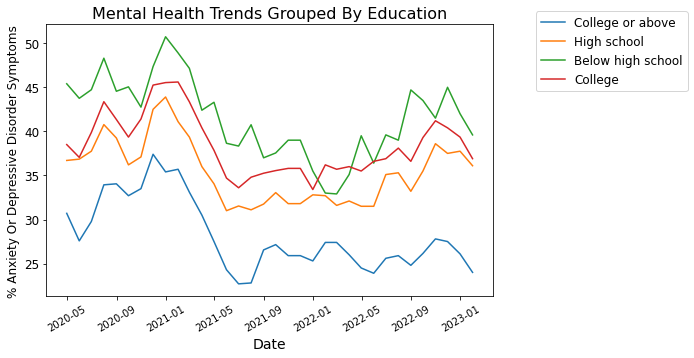
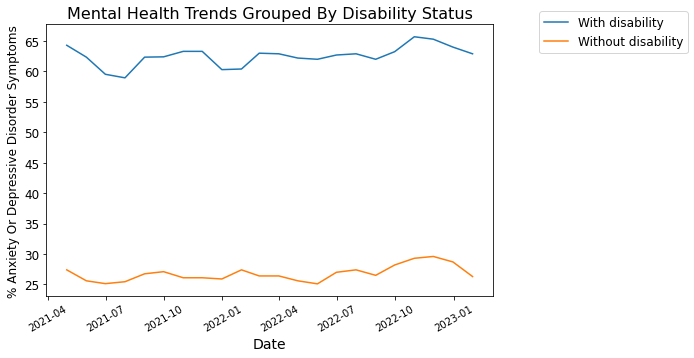
To answer this question, data is divided into categories based on the variables of interest (i.e. age, sex, education level, disability status). Line plots are created to visualize how mental health trends differ for different subgroups.
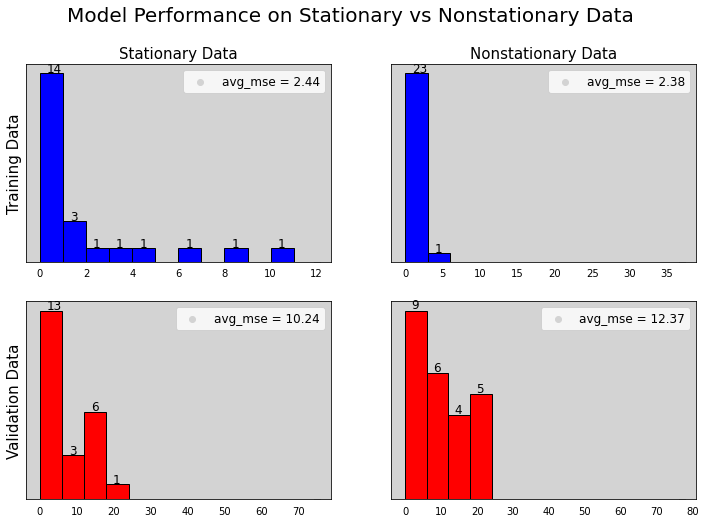
There are several limitations to this study that need to be acknowledged. First, the entirely analysis is based on data gathered from a rather short period of only two years. This largely reduces the reliability of our result. Moreover, the majority time-series data is highly nonstationary, meaning that the data fluctuate with no observable pattern. This could mean that there are some larger trends aside from Covid-19 that affect the prevalence of mental health issues that can only be identified through analysis on long spans of time, such as economic growth and social sentiment. Due to limited data, our analysis might not capture such trends.