OpenAM Monitoring Using Prometheus
OpenAM can expose SNMP metrics. To expose these metrics to Prometheus we will use snmp_exporter tool, provided by the Prometheus community.
To follow the current manual Docker and Docker Compose should be installed
Configuration files located in this project https://github.com/maximthomas/openam-prometheus
Just clone it and run with docker-compose:
git clone https://github.com/maximthomas/openam-prometheus.gitcd ./openam-prometheusdocker-compose upOpen OpenAM URL and create a basic configuration (see OpenAM Quick Start Gude)
Enable SNMP in OpenAM. Login into OpenAM console, goto Configure -> Global Services -> Monitoring
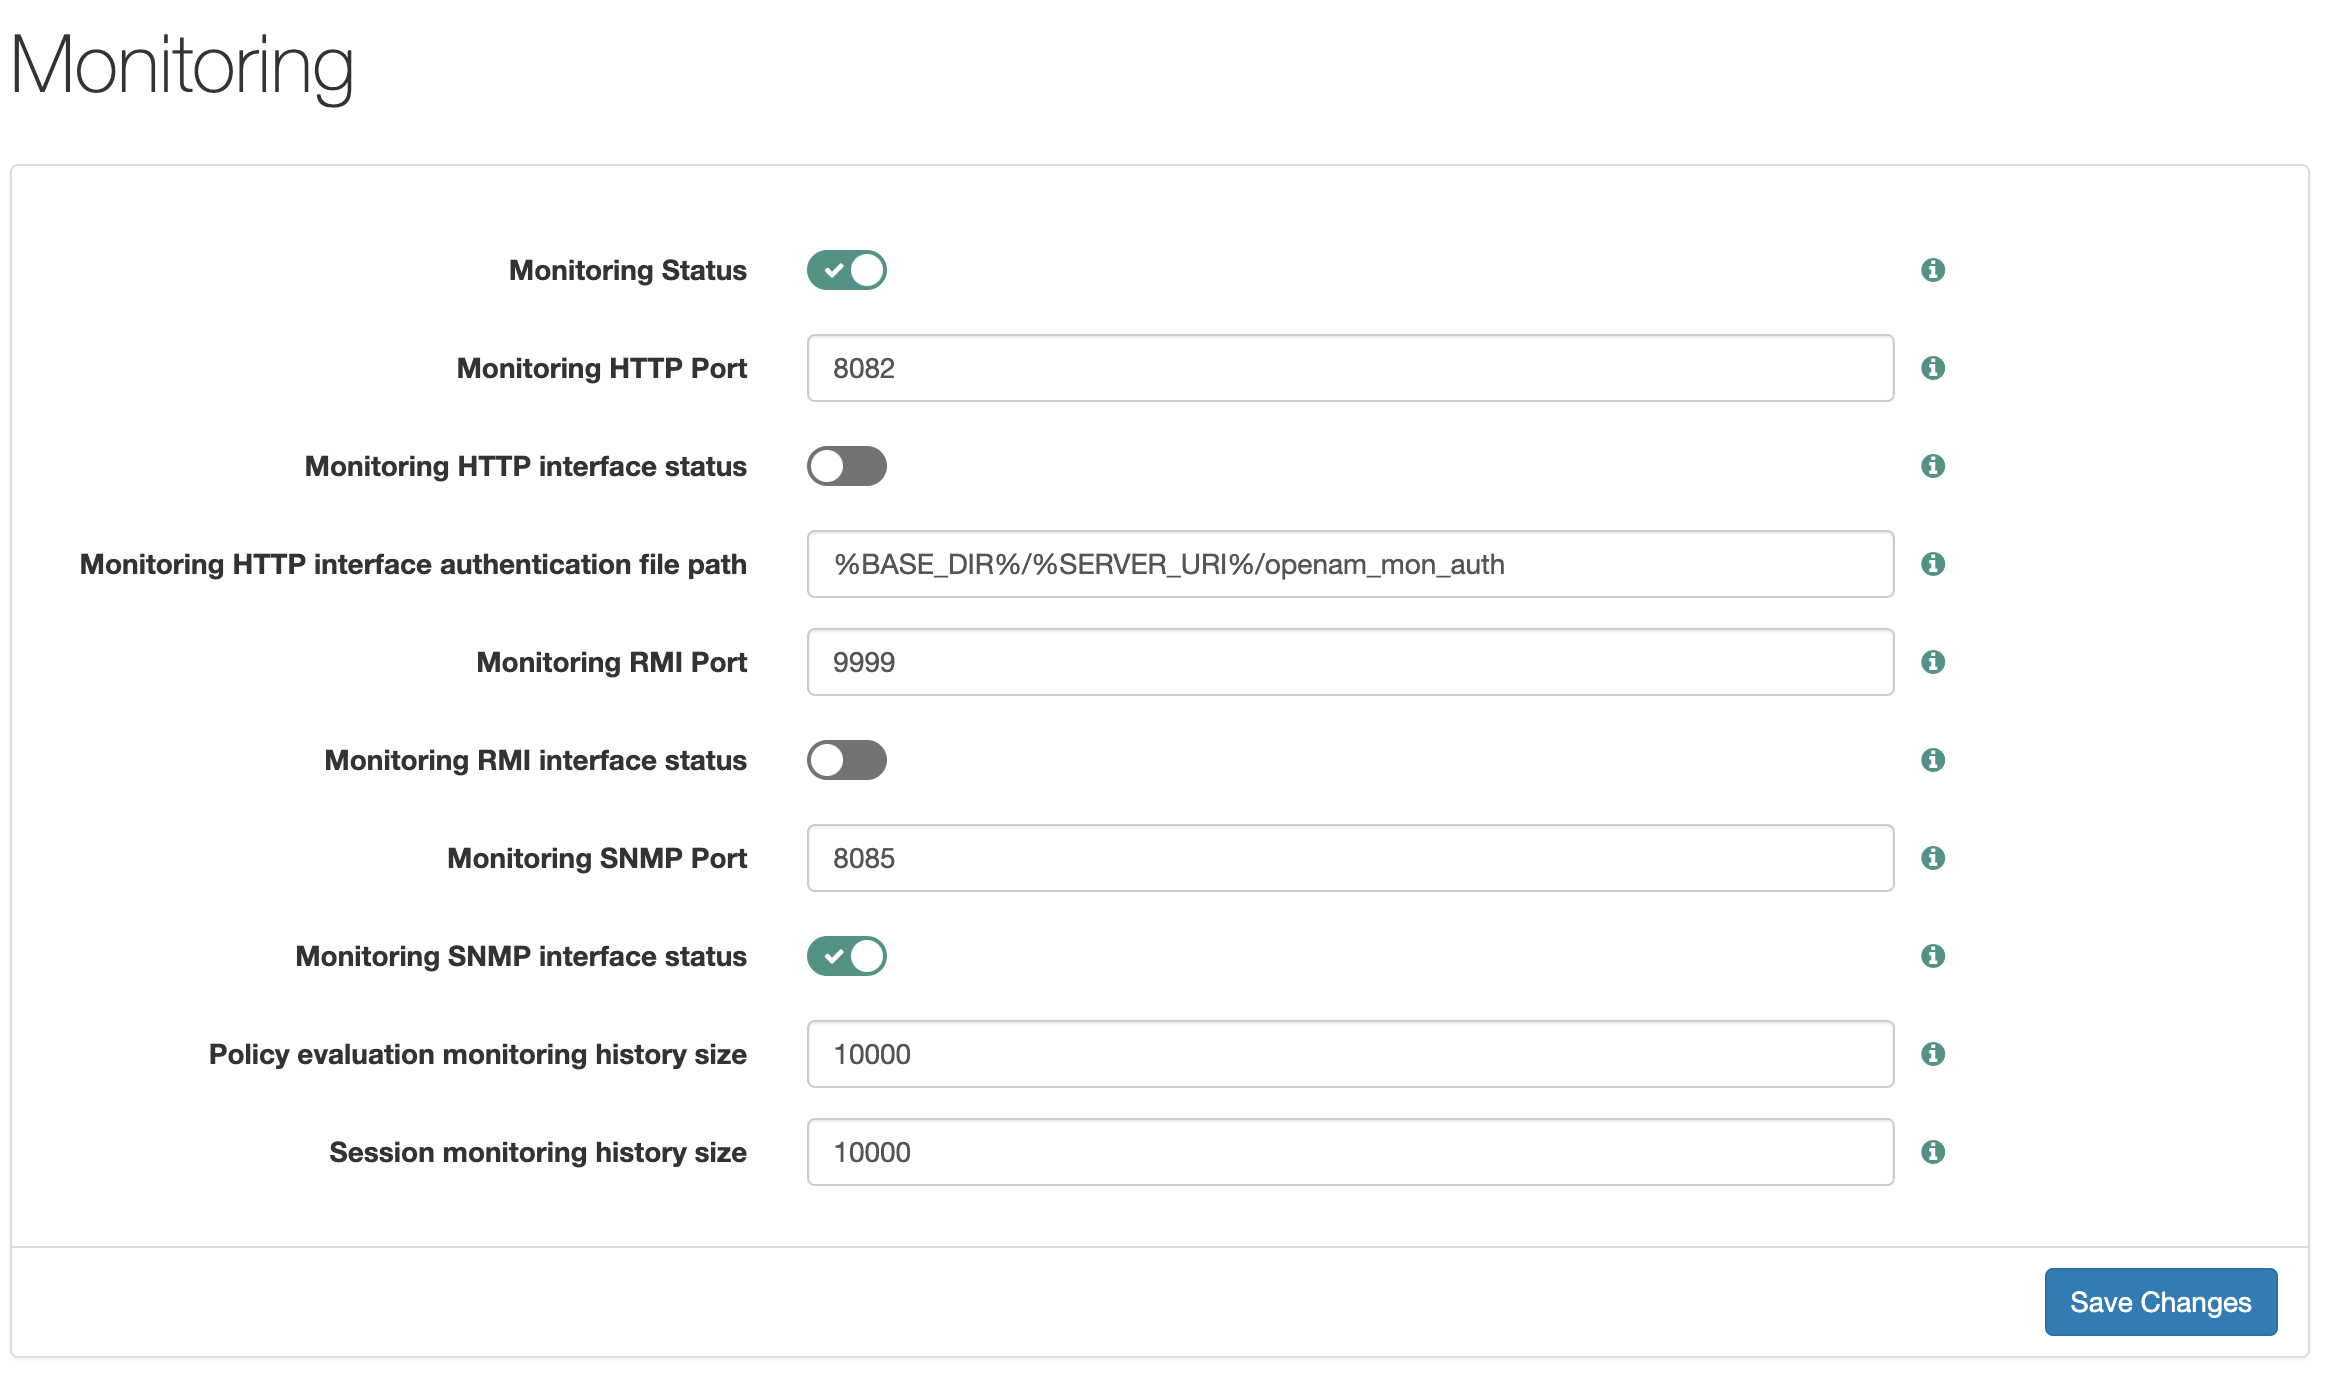
Enable checkboxes Monitoring Status and Monitoring SNMP interface status
Restart OpenAM instance
Open SNMP exporter URL
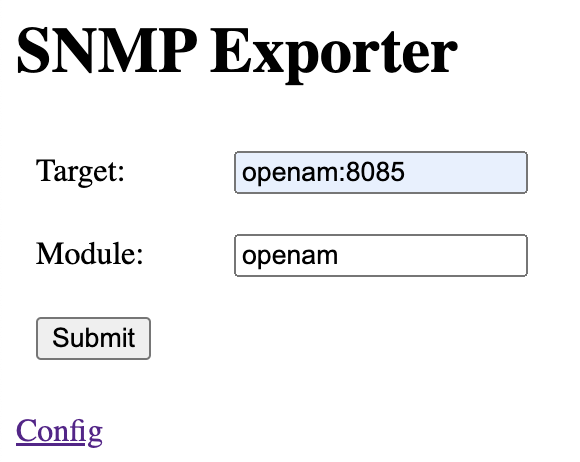
Fill the fields: Target: OpenAM hostname and port, for example openam:8085 Module: SNMP exporter module, for example openam
Press the Submit, then you should see something like this:
# HELP authenticationFailureCount Count of unsuccessful authentications - 1.3.6.1.4.1.42.2.230.3.1.1.2.1.10.2 # TYPE authenticationFailureCount counter authenticationFailureCount 0 # HELP authenticationFailureRate Current Auth failure rate / second based on a fixed preconfigured window. - 1.3.6.1.4.1.42.2.230.3.1.1.2.1.10.4 # TYPE authenticationFailureRate gauge authenticationFailureRate 0 # HELP authenticationSuccessCount Count of successful authentications - 1.3.6.1.4.1.42.2.230.3.1.1.2.1.10.1 # TYPE authenticationSuccessCount counter authenticationSuccessCount 0 # HELP authenticationSuccessRate Current Auth success rate / second based on a fixed preconfigured window. - 1.3.6.1.4.1.42.2.230.3.1.1.2.1.10.3 # TYPE authenticationSuccessRate gauge authenticationSuccessRate 0 # HELP averageDuration Average duration of tokens of the specified type in OpenAM in seconds - 1.3.6.1.4.1.36733.1.2.3.5.1.2 # TYPE averageDuration counter averageDuration{tokenTableIndex="1"} 1532 averageDuration{tokenTableIndex="10"} 0 averageDuration{tokenTableIndex="11"} 0 averageDuration{tokenTableIndex="12"} 0 averageDuration{tokenTableIndex="13"} 0 averageDuration{tokenTableIndex="14"} 0 averageDuration{tokenTableIndex="15"} 0 averageDuration{tokenTableIndex="16"} 340 ...... If you have an existing prometheus instance add to prometheus.yml job openam with a target to SNMP exporter host and port:
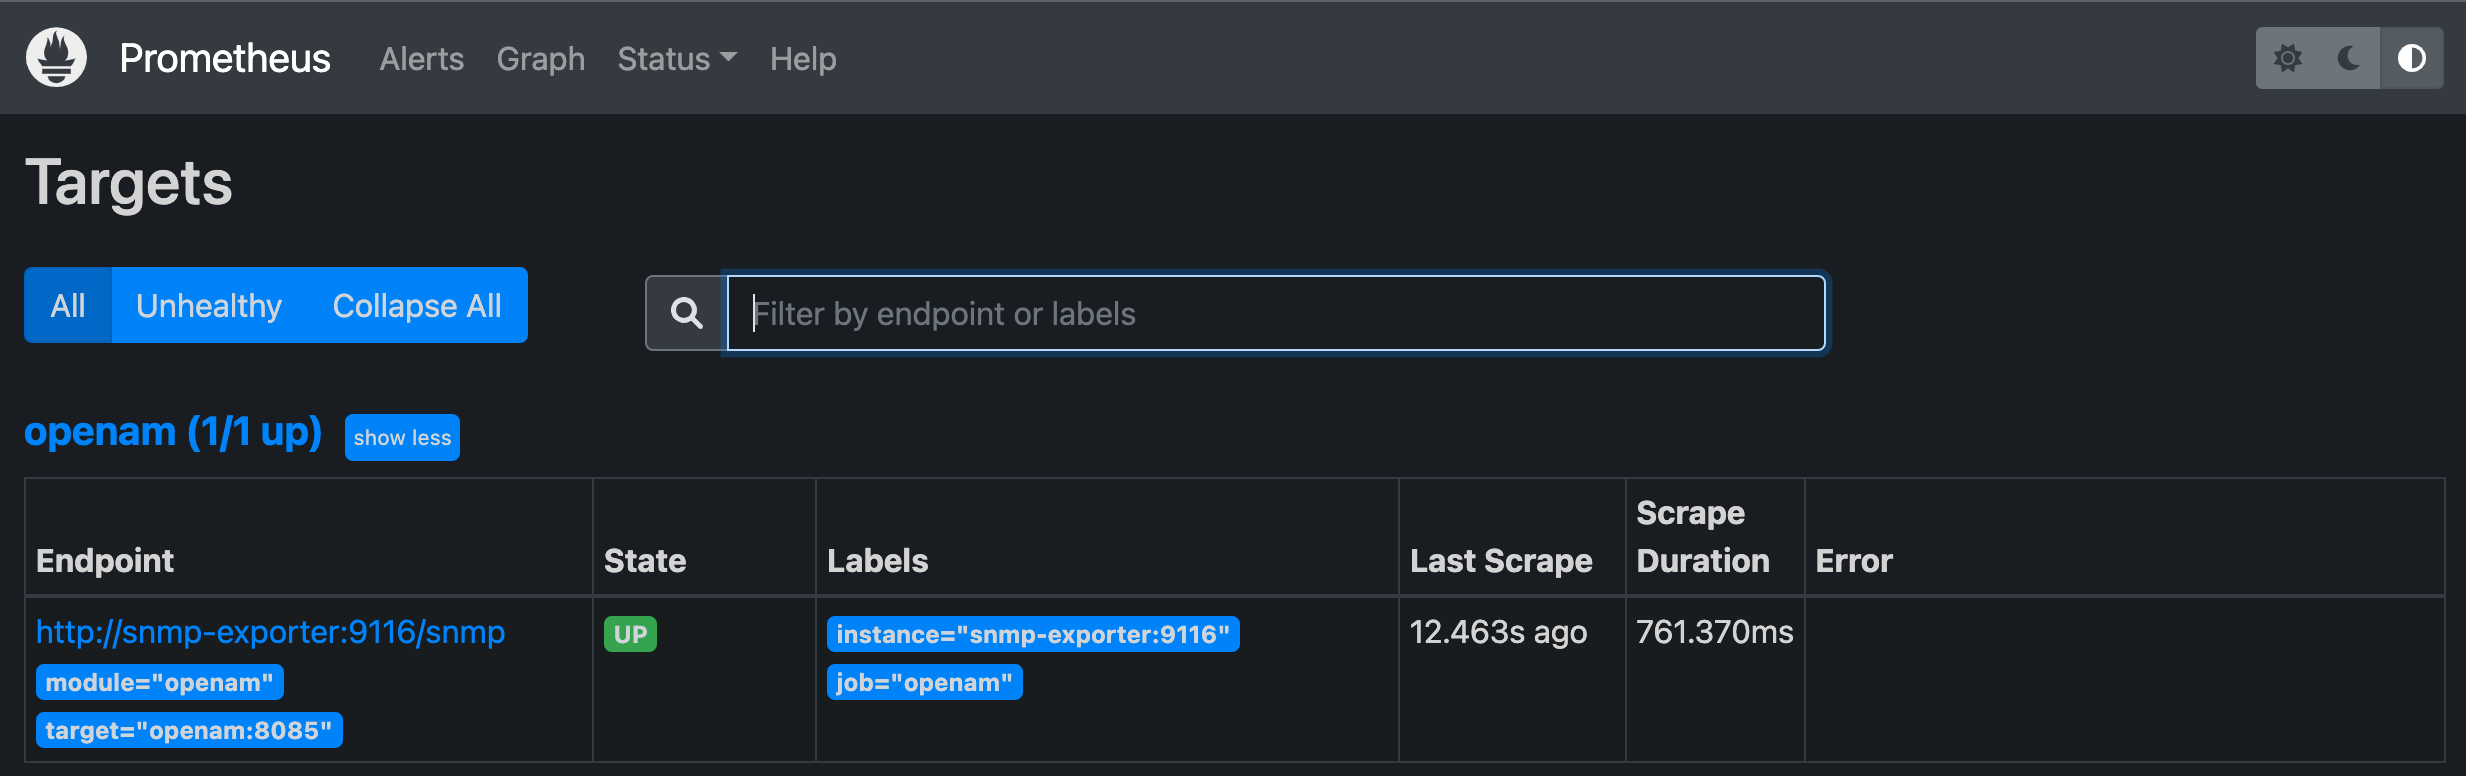
- job_name: "openam" params: target: ["openam:8085"] module: ["openam"] metrics_path: /snmp static_configs: - targets: ["snmp-exporter:9116"]Run Prometheus and check targets:
http://localhost:9090/targets You should see something like this:
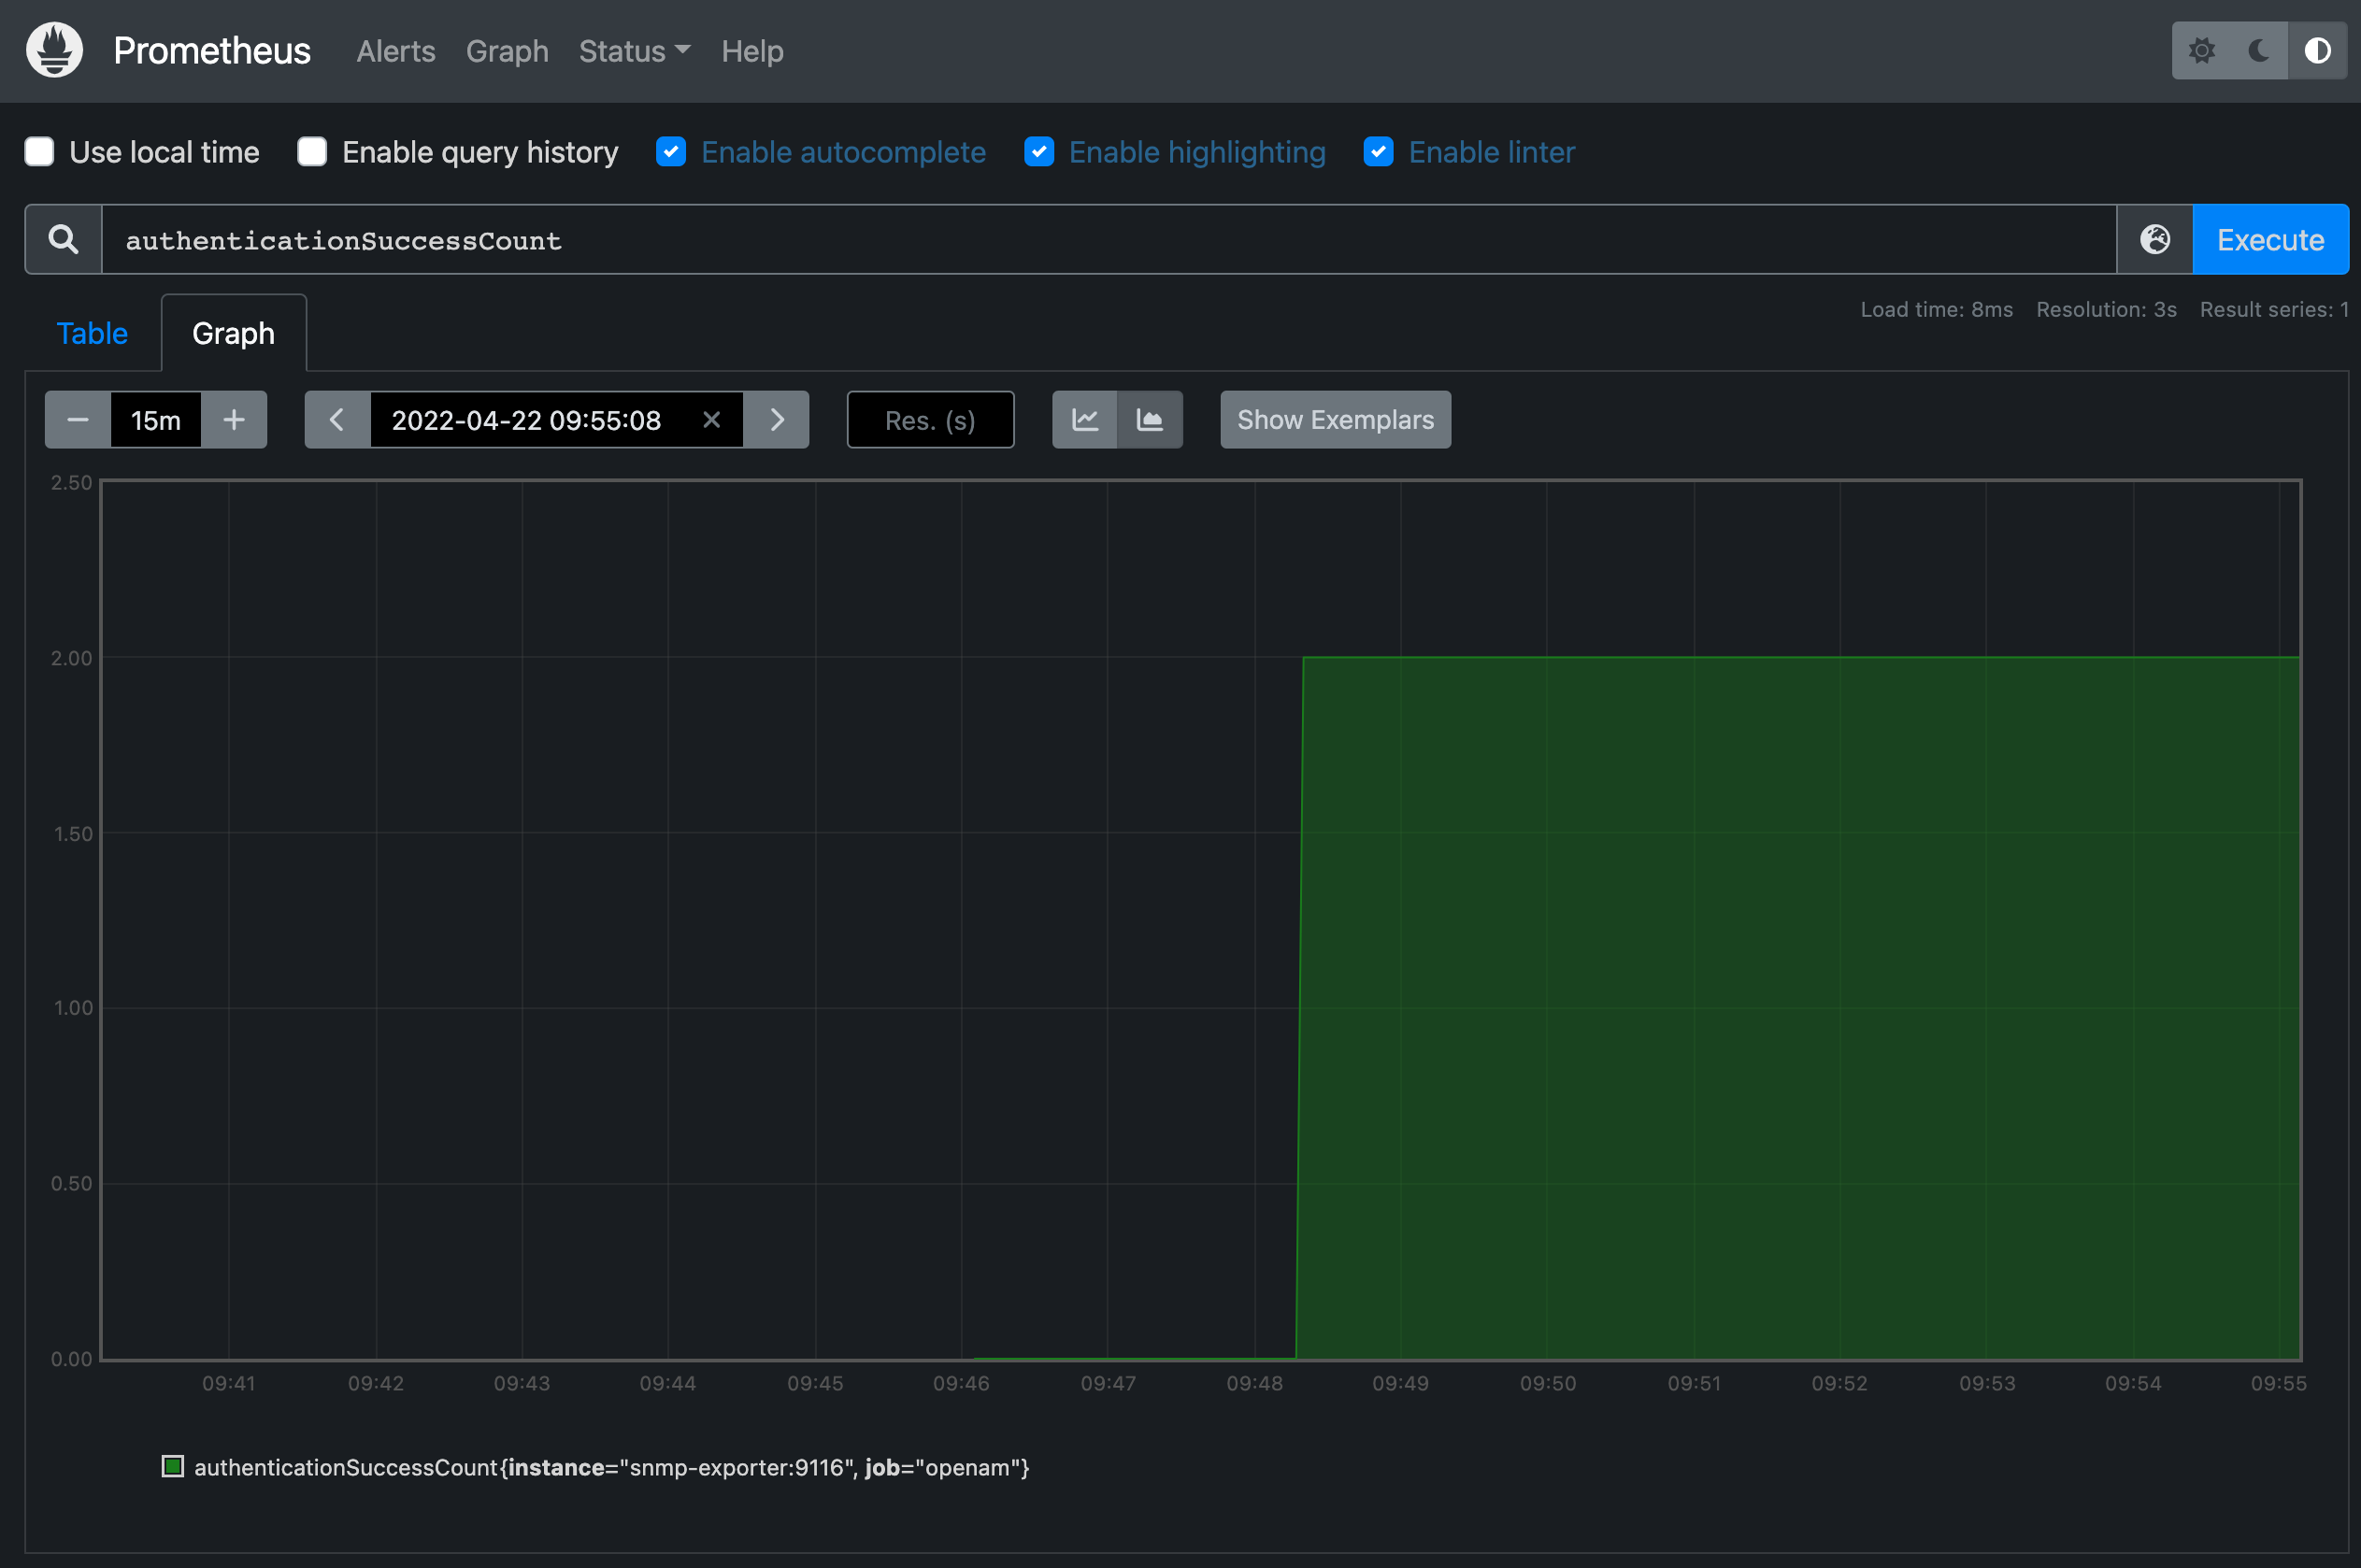
Then go to Graph and you will be able to add OpenAM metrics to monitor.
If you have any additional questions, feel free to ask us!