
![]()
![]()
firecast is an open-source Python tool for modeling Financial Independence to Retire Early (FIRE) scenarios using Monte Carlo simulations. It models a user's retirement plan, simulating investment growth, withdrawals, expenses, and market shocks over time to estimate the probability of financial success.
Plan your retirement, estimate success probabilities, and visualize wealth trajectories under realistic conditions.
- 🔥 Flexible configuration (TOML)
- 📈 Wealth, income, expenses, and asset allocation modeling
- 🎲 Correlated asset/inflation returns, market shocks, and portfolio rebalancing
- 📊 Automatic reporting and plotting
See GitHub Repository for source code, instructions, and documentation.
This tool aims to help users figure out the likelihood of a retirement plan succeeding under uncertainty, visualize possible outcomes, and make informed decisions about savings, spending, and asset allocation.
-
Configuration
User inputs are provided in TOML files (e.g.,configs/config.toml). These specify initial wealth, income, expenses, assets, assets allocation, economic assumptions (returns, inflation), assets and inflation correlation, simulation parameters, portfolio rebalances and market shocks.Where to find configuration examples
Investment assets are defined in the configuration. For each asset you specify the following;
mu, the sample mean of return rate andsigma, the sample standard deviation of return rate. You can find these data for a specific period on several online sources, such asYou can use the scripts data_metrics.py and portfolios.py to estimate these parameters from historical data. See Data metrics usage and Portfolios usagefor details.
Inflation, though not an asset, is defined in this section because it is correlated with assets through a correlation matrix, and the mechanism for generating random values from
muandsigmais the same for assets and inflation. The inflation asset is mandatory because it's used to track all the real values, wealth, expenses...
Example:
[assets.stocks] mu = 0.07 sigma = 0.15 withdrawal_priority = 2 [assets.bonds] mu = 0.03 sigma = 0.055 withdrawal_priority = 1 [assets.real_estate] mu = 0.025 sigma = 0.04 [assets.inflation] mu = 0.025 sigma = 0.025See Assets for details.
-
The core of firecast is an engine that models your financial life month by month, year by year. For each of the thousands of simulation runs, it projects a unique potential financial future based on your configuration and randomized market returns.
Each simulation evolves through a detailed monthly cycle:
- Processes Cash Flow: Handles all income, pensions, contributions, and both regular and planned extra expenses.
- Simulates Market Growth: Applies randomized monthly returns to your investment portfolio, growing (or shrinking) your assets according to the statistical model you defined. It also accounts for inflation.
- Manages Liquidity: Maintains your bank account within the bounds you define in your configuration (
bank_lower_bound,bank_upper_bound), automatically selling assets to cover shortfalls or investing excess cash. If it cannot cover expenses, the simulation is marked as failed. - Handles Events: Executes scheduled portfolio rebalances, applies market shocks if configured, and deducts recurring fund fees.
This entire lifecycle is repeated for the number of years specified in your configuration (
years_to_simulate). By aggregating the outcomes of all simulation runs (controlled bynum_simulationsin configuration), firecast calculates the probability of your plan's success and provides a statistical picture of your potential financial outcomes presented in reports and plots.Note:
The simulation assumes all assets, incomes, expenses, and flows are denominated in a single currency. There is no currency conversion or multi-currency support; all values must be provided and interpreted in the same currency throughout the simulation.
The simulation does not consider any fiscal aspects, therefore parameters such as income, pension, contributions, etc. are to be considered after taxes.
-
- Prints a summary to the console.
- Generates a report in markdown summarizing the simulation results, including links to generated plots.
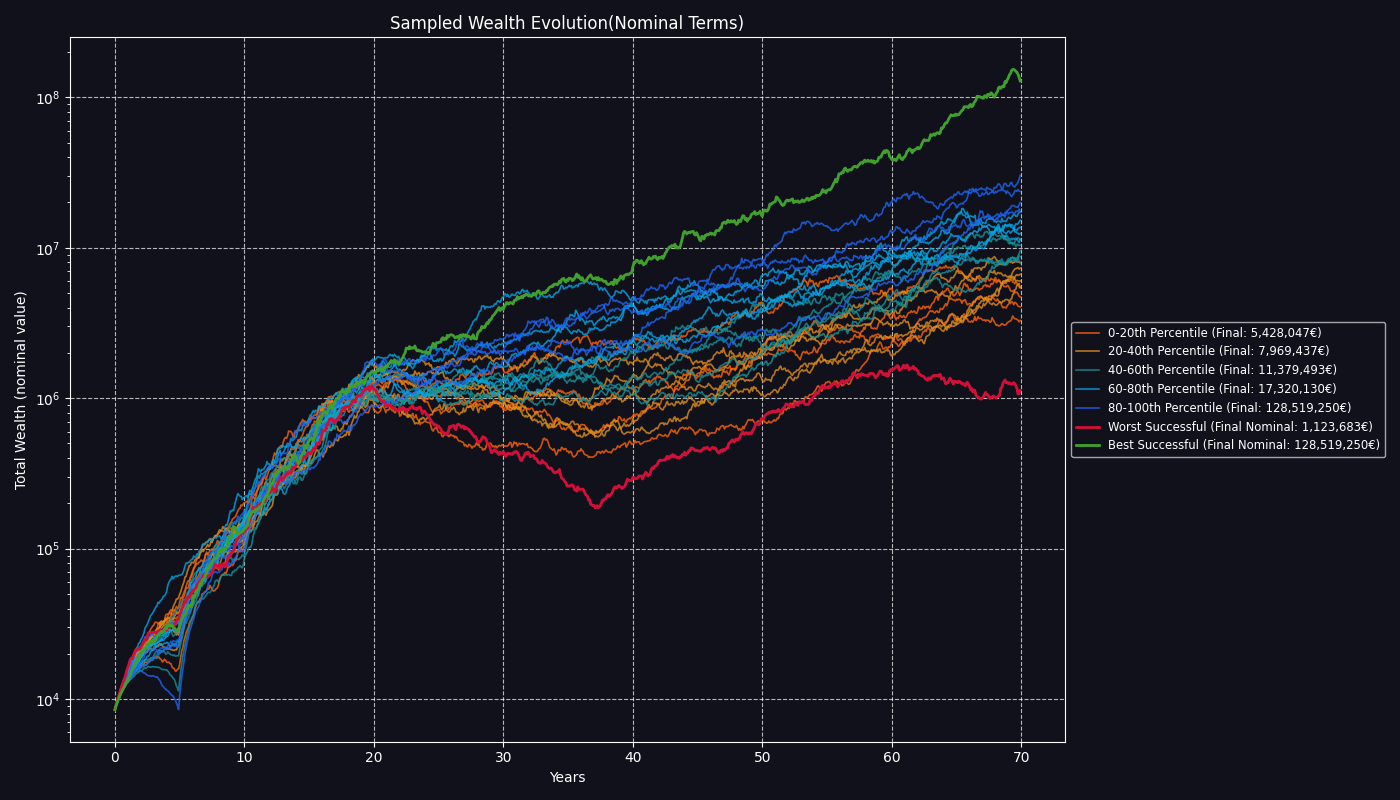
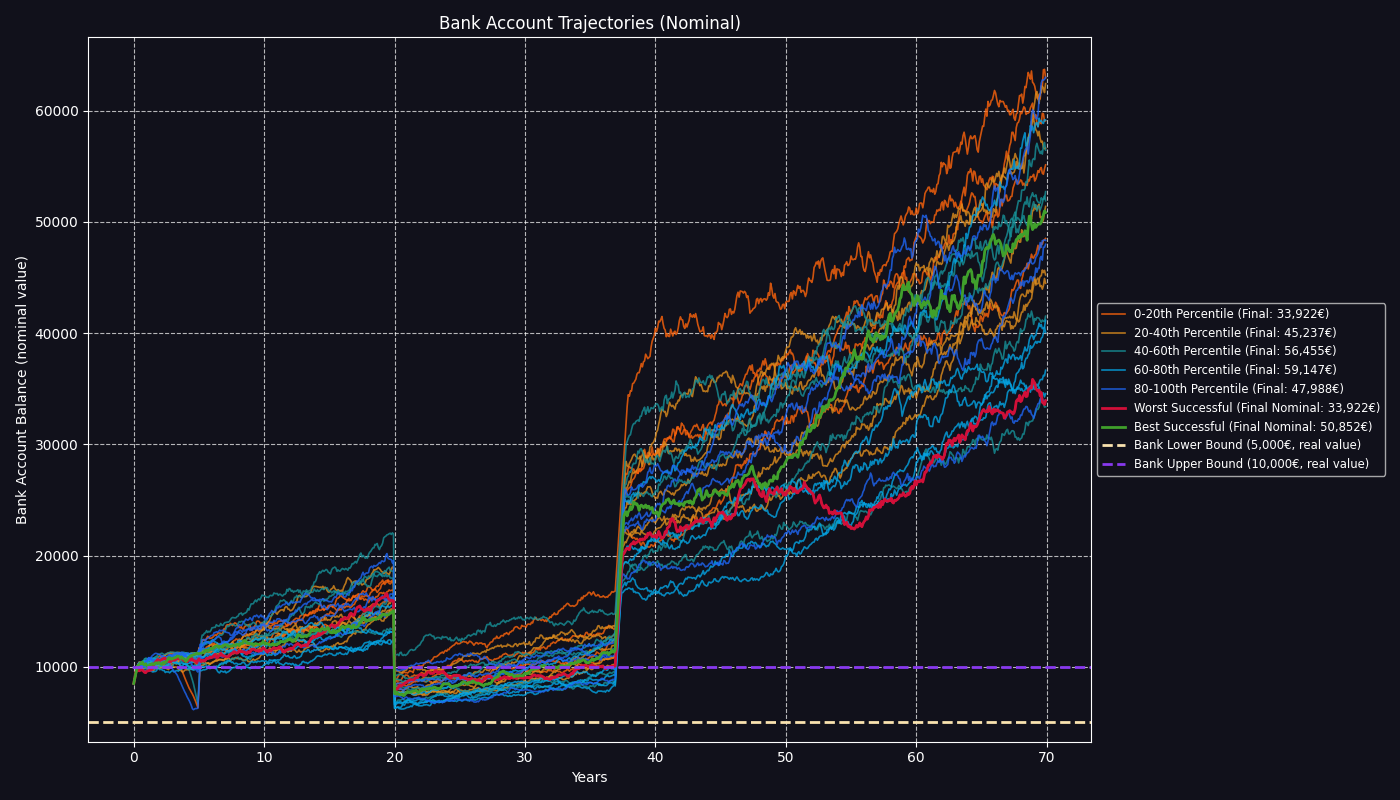
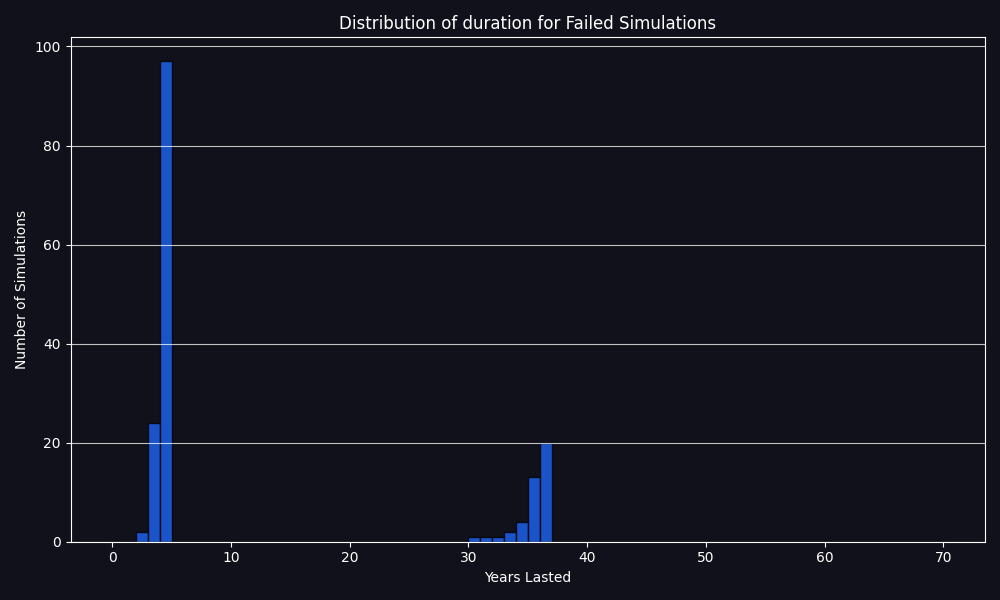
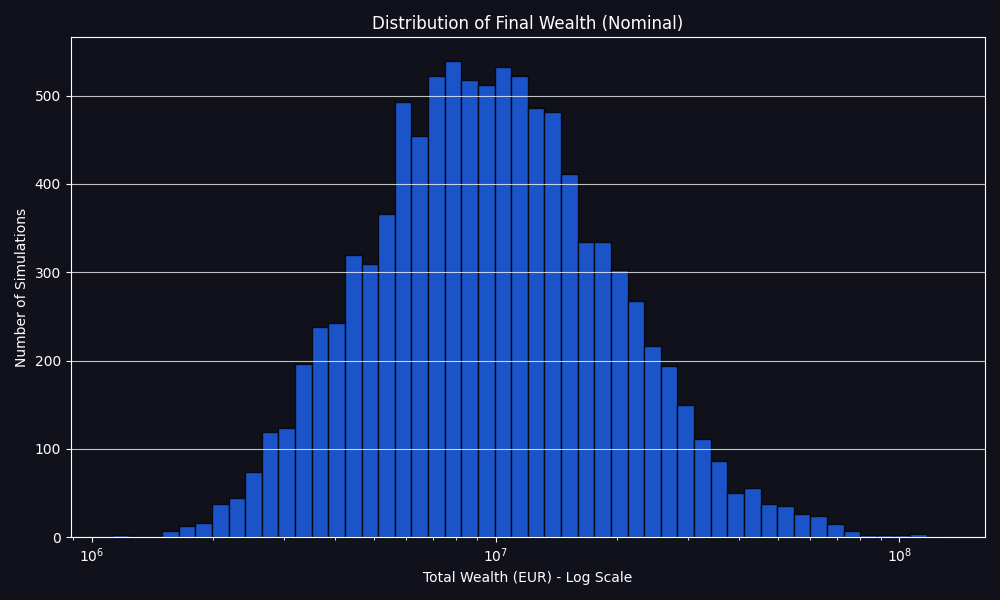
- Generates all plots for wealth evolution, bank account trajectories, and distributions of outcomes.
- Output directories for plots and reports are set via the config file and created automatically.
Plots include:
Wealth evolution over time
Bank account balance trajectories
Duration distribution of failed cases
Distribution of final wealth for successful outcomes
and all the corresponding plots in real terms and others.
-
Clone the repository:
git clone https://github.com/aimer63/fire.git cd fire -
(Optional but recommended) Create and activate a virtual environment:
python -m venv .venv source .venv/bin/activate # On Windows: .venv\Scripts\activate
-
Install the package in editable/development mode:
pip install -e . -
Verify the installation:
python -c "import firecast; print(firecast.__version__)" -
Configure your plan
Start with the config example provided in
configs/(e.g.,configs/config.toml). -
From the project root:
fire --config configs/config.toml
-
Review the results
You will see the interactive
matplotlibplots appearing once the simulation is finished. Once you closed all thematplotlibinteractive windows, the program will terminate and you can explore the results, i.e. saved plots and markdown report in the output directory.- Markdown report: Generated in
output/reports/in your working directory, summarizing success rate, failed simulations, best/worst/average cases and links to plots. - Plots: Generated in
output/plots/in your working directory, visualizing wealth evolution, bank account trajectories and distributions.
- Markdown report: Generated in
[simulation_parameters] num_simulations = 10_000 # random_seed = 42 [paths] output_root = "output/" [deterministic_inputs] initial_bank_balance = 8000.0 # To set your initial portfolio, use a planned contribution at year 0 and specify the # allocation with a rebalance at year 0. planned_contributions = [{ year = 0, amount = 130000.0 }] initial_bank_balance = 8000.0 bank_lower_bound = 5000.0 bank_upper_bound = 10000.0 years_to_simulate = 40 # ... (other parameters) ... [assets.stocks] mu = 0.07 sigma = 0.15 withdrawal_priority = 2 [assets.bonds] mu = 0.03 sigma = 0.055 withdrawal_priority = 1 # Asset inflation must exist. [assets.inflation] mu = 0.025 sigma = 0.025 [correlation_matrix] assets_order = ["stocks", "bonds", "inflation"] # Identity matrix. Independent variables, no correlation. matrix = [ # stk, bnd, pi [1.0, 0.0, 0.0], # stocks [0.0, 1.0, 0.0], # bonds [0.0, 0.0, 1.0], # inflation ] [[shocks]] year = 10 description = "October 1929" impact = { stocks = -0.35, bonds = 0.02, inflation = -0.023 } # There must always be a rebalance event for year 0 even if a planned contribution # at year 0 is not specified, the weights are used to allocate all subsequent investments # until the next rebalance. # The `period` field allows for periodic rebalancing: if `period > 0`, the rebalance is # applied every `period` years until the next rebalance event; if `period == 0`, it is # applied only once at the specified year. [[portfolio_rebalances]] year = 0 period = 1 description = "Initial allocation" weights = { stocks = 0.80, bonds = 0.20 } [[portfolio_rebalances]] year = 20 period = 2 description = "Retirement" weights = { stocks = 0.60, bonds = 0.40 }- Reports: Markdown files in
<output_root>/reports/with simulation summary and plot links. - Plots: PNG images in
<output_root>/plots/for all major simulation results. - All output paths are relative to the project root and configurable via
[paths] output_rootin your TOML config. - See Output for details on the generated files.
- Python 3.10+
- See
pyproject.tomlfor dependencies:
For mathematical background, advanced usage, and additional guides, see the docs/ folder.
- Installation Guide: Step-by-step instructions for installing firecast.
- Configuration Example: Configuration example with all parameters.
- Configuration Reference: Detailed explanation of all configuration parameters.
- Usage Guide: How to install, configure, and run the simulation.
- Results: Detailed explanation of all outputs of the simulation.
- Monte Carlo Theory: Mathematical background and simulation theory.
For more details, see the docstrings in each module.
Feel free to open issues or submit pull requests if you have suggestions or improvements.
-
Books:
- A Random Walk Down Wall Street by Burton G. Malkiel: A classic book explaining the basics of investing, efficient markets, index funds, and long-term wealth building.
- The Bogleheads’ Guide to Investing by Taylor Larimore, Mel Lindauer, and Michael LeBoeuf: A practical guide to low-cost investing and financial independence, covering asset allocation and risk management.
- Quantitative Finance for Dummies by Steve Bell: An accessible introduction to financial modeling, including Monte Carlo simulations and volatility.
- The Millionaire Next Door by Thomas J. Stanley and William D. Danko: insights into wealth-building habits and strategies for financial independence.
-
Online Resources:
- Early Retirement Now: A detailed blog on FIRE strategies.
- Bogleheads Wiki: A comprehensive resource on investing, retirement planning and portfolio management, with a focus on low-cost, passive strategies.
- Investopedia: Monte Carlo Simulation: A clear explanation of Monte Carlo methods in financial planning and risk analysis.
-
Academic/Technical:
- Monte Carlo Methods in Financial Engineering by Paul Glasserman: A rigorous text on Monte Carlo techniques for financial modeling, including asset return simulations.
- Options, Futures, and Other Derivatives by John C. Hull: A foundational text on derivatives pricing, ideal for understanding asset return dynamics.
- Investopedia: Asset Return Volatility: Explains volatility as the standard deviation of returns, key for configuring your
muandsigmaparameters.
-
Communities:
- r/financialindependence: A Reddit community discussing FIRE strategies, with real-world insights and case studies.
These resources provide a mix of practical, theoretical, and data-driven content to Finance your use of this tool and FIRE planning knowledge.