Environment
- Hardware: Jetson Thor (32 GB) ×2
- OS / JetPack: <e.g., JP 7.0.x SBSA>
- CUDA / cuDNN / Driver: 13.0
- Container image:
thor_vllm_container:25.08-py3-base - Model: Qwen3-32B (also observed with larger models)
Problem
When running vLLM in Docker on Jetson Thor:
- The model starts fine the first time.
- After pressing Ctrl + C to stop the server, available host memory keeps decreasing.
- Even after the container is completely removed (
docker rm -f), memory is not freed. - Re-running the same container eventually fails with “out of memory” or the system hangs.
- Only manually running
sudo sync && sudo sysctl -w vm.drop_caches=3
frees enough memory to start again.
6. After several iterations, the whole system may freeze (SSH and UI become unresponsive).
It seems host memory or pinned pages are not being released after Ctrl +C or container shutdown.
This looks like host page cache / anon memory not reclaimed after the container exits (weights are mmapped). GPU memory isn’t the blocker.
Repro (minimal)
sudo docker run -d --rm \ --name vllm-server \ --runtime nvidia \ --gpus all \ --ulimit memlock=-1 \ --ulimit stack=67108864 \ -v /workspace:/workspace \ -p 6678:6678 \ thor_vllm_container:25.08-py3-base
and run:
python -m vllm.entrypoints.openai.api_server \ --host 0.0.0.0 \ --port 6678 \ --model /workspace/models/Qwen3-30B-A3B-Thinking-2507-AWQ \ --tensor-parallel-size 1 \ --use-v2-block-manager \ --gpu-memory-utilization 0.4 \ --max-model-len 32k \ --cuda-graph-sizes 4 \ --max_num_seqs 4 \ --served-model-name Qwen3-30B-A3B-Thinking-2507-AWQ
Observations
- After the first run exits,
free -h shows high buff/cache and low MemAvailable. slabtop shows growing file/SLAB caches.
Questions
- Is this a system/kernel configuration issue on Jetson Thor, or a known problem with the test image
thor_vllm_container:25.08-py3-base / the vLLM build inside it?
1 Like
#1 Use the newer vllm container:
-
docker pull nvcr.io/nvidia/vllm:25.09-py3
#2 Use pkill vllm to kill the server process
#3 Free the cache with sudo sync && sudo sysctl -w vm.drop_caches=3
Some models fail during the “Capturing CUDA Graphs” stage and you just have to try again and again until they run (using steps 2 & 3 before each retry)
I’ve generally had good luck starting vllm with the vllm serve command.
Hope some of this is useful.
Thanks for the reply!
I don’t actually have issues starting the container or with the CUDA Graphs capture — those parts are fine on my side.
The main problem is that the cache (or some kind of host memory) is not released automatically after stopping or reloading the model.
When I reload a large model (e.g., 72B or 235B for two), I have to manually free the cache right after the weights finish loading;
otherwise, my KV-cache space goes negative by around -20 GB, and the process becomes unstable or hangs.
It feels quite ungraceful to have to “race” the memory pressure manually every time, and I’m worried this might indicate a deeper memory-management issue (possibly in vLLM’s mmap/unmap behavior or the container memory accounting).
Has anyone seen similar host memory retention or delayed reclaim on Jetson Thor with the 25.08 / 25.09 containers?
Hi,
Thanks a lot for reporting this.
We will try to reproduce this issue and update with more information.
In the meantime, could you help disable the huge page to see if it helps?
echo 0 | sudo tee /proc/sys/vm/nr_hugepages
Thanks.
Hi,
Thanks for the follow-up!
I tried disabling huge pages with
echo 0 | sudo tee /proc/sys/vm/nr_hugepages
Unfortunately, it didn’t make a difference — I still get a negative KV-cache value during Qwen3 235b model load.
If I manually free the cache in the middle of loading (right after weight initialization), the issue doesn’t occur.
Hi,
Thanks for the testing.
Is this the model you used?
Thanks.
memory management docs
https://docs.vllm.ai/en/latest/configuration/conserving_memory.html?h=memory https://docs.vllm.ai/en/latest/features/sleep_mode.html?h= "Sleep Mode allows you to temporarily release most GPU memory used by a model, including model weights and KV cache, without stopping the server or unloading the Docker container." Some vllm config arguments --kv-cache-memory-bytes, --swap-space --kv-cache-dtype are documented here https://docs.vllm.ai/en/latest/cli/serve.html?h=kv+cache+memory#cacheconfig
Hi,
Thanks for checking.
We’re currently testing with Qwen3-235B, deployed across two Jetson Thor boards connected directly (back-to-back).
Because the model is very large, the memory retention issue appears almost every time we restart.
Using the smaller Qwen3-30B-A3B-Thinking-2507-AWQ model can also reproduce it,
but it usually takes multiple restarts before failure, since the AWQ quantized weights are small enough to run even without cache being released.
Thanks a lot for sharing these links!
I hadn’t seen the sleep mode and memory configuration docs before — that’s very useful information.
In my case though, the problem seems to be more on the host side (page cache / system memory) rather than vLLM’s KV cache.
The GPU memory usage looks fine; it’s the host cache memory that keeps growing and isn’t released after stopping or reloading the model.
Still, this is really helpful context — I’ll read through those docs carefully. Thanks again!
edit. just looked at image and it is only amd64, so won’t work.
I’ve not used this image but wonder if it might work for your use case.
“NVIDIA Dynamo with the vLLM backend for high-performance, distributed large language model (LLM) inference.”
Hi,
Test the quantized model several but fails to reproduce this issue in our environment yesterday.
Will try the bigger model to see if we can observe the same issue and update more info with you.
Thanks.
Hi,
Thanks for the update!
May I ask if you’ve tried stopping and restarting the vLLM service multiple times?
With the 30B Q4 model, the issue usually appears after a few cycles rather than the first run — probably because the service itself is small and the host cache accumulates gradually.
Thanks again for testing this out!
Hi,
We repeat the steps below 10 times, but fail to reproduce the issue:
launch container - run service - stop service - terminate container
Below is the memory status each time the application is ready, which looks stable.
#1 total used free shared buff/cache available Mem: 122Gi 52Gi 14Gi 55Mi 56Gi 69Gi Swap: 0B 0B 0B #2 total used free shared buff/cache available Mem: 122Gi 69Gi 4.1Gi 55Mi 50Gi 53Gi Swap: 0B 0B 0B #3 Mem: 122Gi 70Gi 3.3Gi 55Mi 50Gi 52Gi Swap: 0B 0B 0B #4 total used free shared buff/cache available Mem: 122Gi 70Gi 3.6Gi 55Mi 49Gi 52Gi Swap: 0B 0B 0B #5 total used free shared buff/cache available Mem: 122Gi 70Gi 3.8Gi 55Mi 49Gi 51Gi Swap: 0B 0B 0B #6 total used free shared buff/cache available Mem: 122Gi 71Gi 4.0Gi 55Mi 48Gi 51Gi Swap: 0B 0B 0B #7 total used free shared buff/cache available Mem: 122Gi 71Gi 4.2Gi 55Mi 48Gi 51Gi Swap: 0B 0B 0B #8 total used free shared buff/cache available Mem: 122Gi 71Gi 4.0Gi 55Mi 48Gi 51Gi Swap: 0B 0B 0B #9 total used free shared buff/cache available Mem: 122Gi 70Gi 5.7Gi 55Mi 48Gi 52Gi Swap: 0B 0B 0B #10 total used free shared buff/cache available Mem: 122Gi 71Gi 4.9Gi 55Mi 48Gi 51Gi Swap: 0B 0B 0B
In our setting, we disable the hugepage but don’t drop the cache manually or periodically.
$ echo 0 | tee /proc/sys/vm/nr_hugepages
Could you test this again in the same setting?
Thanks
It doesn’t appear to be just the vLLM containers that cause this issue either. I have a self contained Dockerfile based on the Pytorch container and SAM2 that reproduces this behavior on my Thor. I have attached the Dockerfile I was using as a reference. It is a simple python script that generates a set of output images when the container runs, then it exits. I was able to observe this memory freeing issue on L4T 38.2.2 with, and without hugepages enabled (using echo 0 | sudo tee /proc/sys/vm/nr_hugepages to disable them).
Dockerfile.txt (3.2 KB)
I was running the container with the following command: docker run -it --rm --network host --gpus all --ipc=host -–runtime nvidia -v ./seg_out:/segmentation_results test_img:latest where test_img was the name for the Dockerfile I had built locally.
Here is the output of top sorted by resident set size, and the output of free after running the container and letting it exit a few times (somewhere around 5-8 times). At this point no container is running, but for some reason about 9GB haven’t been freed back to the system.
After taking this screenshot, then I ran sudo sync && sudo sysctl -w vm.drop_caches=3 This is what top and free look like after forcing the system to free it. This finally recovers the 9GB back to the “free” state.
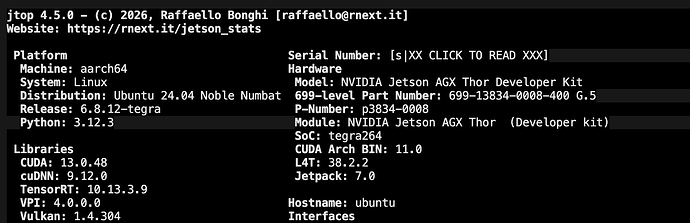
Here is the version information for the Thor taken from jtop:
Hi,
Thanks for sharing the status of your system.
Do you meet an error (ex., illegal memory access) or a system freeze when running the container?
If not, you don’t need to drop the cache manually since it might trigger other issues if the cache is owned by a running app.
Thanks.
Hi,
Thanks for the detailed test results!
We’ve re-flashed the system and re-tested, but the issue still persists on our side.
Could it be that we’re using a different internal build or configuration of the container?
Just to confirm, we’re currently using:
thor_vllm_container:25.08-py3-base
and
Thanks again for checking this so carefully!
Hi,
As @whitesscott mentioned, we use the nvcr.io/nvidia/vllm:25.09-py3 container.
Could you try if the issue exists on that container?
Thanks.
Hi,
Eventually, after running the container several times, the system will run out of available memory and lock up. It becomes unable to start new processes, or kill anything currently running. It also generally boots my SSH access. Is there a log or something related that would be helpful for the NVIDIA team?
Thanks.
Yes, I’m seeing very similar behavior on my side as well.
After enough start/stop cycles, the system eventually reaches a state where even dropping caches no longer helps, and at that point the only option is to reboot.