I’m trying to debug large memory spikes in our production environment. I tried to see if I could create something similar with as minimal application as I could. I’m using newest Erlang and Elixir, but saw the same behaviour with OTP 21 and Elixir 1.10.
So I created a new app with mix new, installed Jason and opened up iex.
I wanted to create a fairly large JSON, so I decided to quickly create a map that I would use as a values for a bigger map. So here’s the value
iex(1)> value = %{"foo" => ["a", "b", "c"], "bar" => [1, 2, 3]} I wanted to see what the memory allocation looks like before I create the bigger map, so I opened up Observer and saw something like this in Memory allocators tab
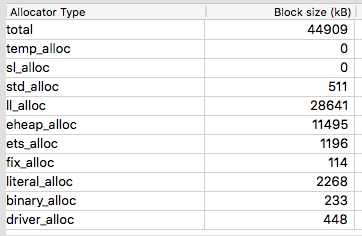
Total, eheap_alloc and binary_alloc are the most interesting ones.
Then I created the bigger map
iex(3)> map = 1..50_000 |> Enum.reduce(%{}, fn idx, acc -> key = "key#{idx}"; Map.put(acc, key, value) end) It’s a bit hard to read, but it basically creates a map with 50 000 keys where the value is always taken from the value variable created before.
So now the memory allocations look as follows
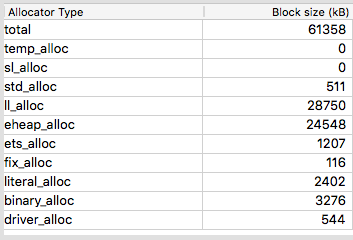
So eheap_alloc went up ~13 MB and binary alloc about 2 MB. This kind of makes sense as :erts_debug.flat_size(map) * 8 (64-bit system) would give about 23 MB and some of that map is probably shared in memory.
What I don’t understand, however, is the memory allocation of the next one
iex(4)> json = Jason.encode!(map) 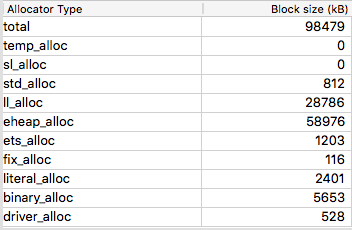
eheap_alloc goes up almost 35 MB while binary_alloc goes up about 2.4 megs, which is pretty much the size of the binary
iex(4)> byte_size(json) 2338895 I’ve learned that binaries larger than 64 kB are stored outside of the process in a special binary heap, which I would assume is represented by the binary_alloc as it nicely matches to the size of the binary.
But where does that 35 MB of (process?) heap allocation come from?
I also tried making the json an iolist with Jason.encode_to_iodata! and it allocates even more heap.
Thanks for any insights!

