Create a failed docs rule
Serverless Stack
The Editor role or higher is required to create a failed docs rule using custom threshold rule. To learn more, refer to Assign user roles and privileges.
Create a failed docs rule using the custom threshold rule to alert when the number of failed documents in your data stream reaches or exceeds a given value.

When creating a failed docs rule, the process depends on your deployment type and your space's solution view. You can check your solution view by selecting the Spaces icon.
Select the appropriate tab for your setup, then follow the instructions to create a failed docs rule:
- From the main menu, open the Data Set Quality page from Management → Stack Management, or use the global search field.
- Find the data set you want to create a rule for in the table, and select Open from the Actions column.
- Select Alerts → Create custom threshold rule.
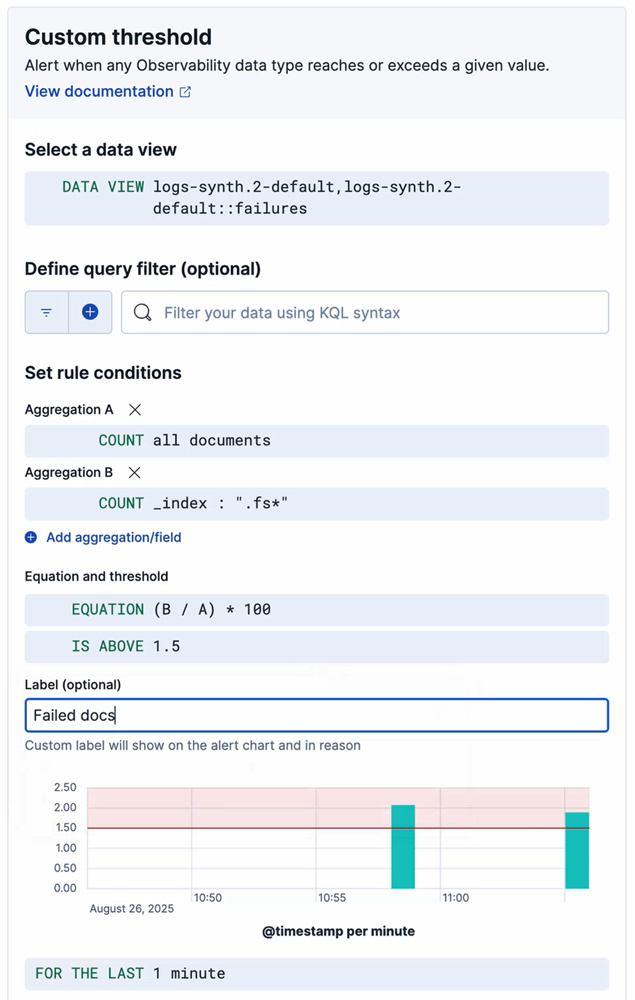
- Select Add aggregation/field.
- For your new aggregation, set Aggregation type to Count and KQL Filter to
_index : ".fs*". - Select Equation, and set the equation to
(B / A) * 100. - Set Is above to the desired threshold. For example,
1.5. - Set the Label to
Failed docs. - Select Next to go to the Details step.
- Set the Rule name to
Data set qualityand addfailed_docsto the Tags. - Select Create rule.
- Select Manage rules and connectors.
- Select Create rule, then Custom threshold.
- Select Data view, then Create a data view.
- Find your data stream under All sources.
- Name your data view.
- Add your index pattern with
::failuresappended. For example,logs-synth.2-default::data,logs-synth.2-default::failures. - Select Save data view to Kibana.
- Select Add aggregation/field.
- For your new aggregation, set Aggregation type to Count and KQL Filter to
_index : ".fs*". - Select Equation, and set the equation to
(B / A) * 100. - Set Is above to the desired threshold. For example,
1.5. - Set the Label to
Failed docs. - Select Next to go to the Details menu.
- Set the Rule name to
Data set qualityand addfailed_docsto the Tags. - Select Create rule.
You can extend your rules with actions that interact with third-party systems, write to logs or indices, or send user notifications. You can add an action to a rule at any time. You can create rules without adding actions, and you can also define multiple actions for a single rule.
To add actions to rules, you must first create a connector for that service (for example, an email or external incident management system), which you can then use for different rules, each with their own action frequency.
Connector types
Connectors provide a central place to store connection information for services and integrations with third party systems. The following connectors are available when defining actions for alerting rules:
- Cases
- D3 Security
- IBM Resilient
- Index
- Jira
- Microsoft Teams
- Observability AI Assistant
- Opsgenie
- PagerDuty
- Server log
- ServiceNow ITOM
- ServiceNow ITSM
- ServiceNow SecOps
- Slack
- Swimlane
- Torq
- Webhook
- xMatters
Some connector types are paid commercial features, while others are free. For a comparison of the Elastic subscription levels, go to the subscription page.
For more information on creating connectors, refer to Connectors.
Action frequency
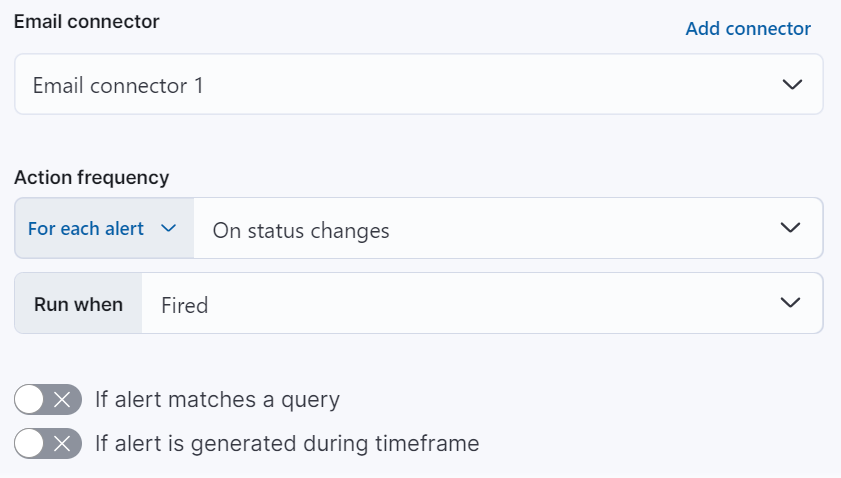
After you select a connector, you must set the action frequency. You can choose to create a summary of alerts on each check interval or on a custom interval. Alternatively, you can set the action frequency such that you choose how often the action runs (for example, at each check interval, only when the alert status changes, or at a custom action interval). In this case, you must also select the specific threshold condition that affects when actions run: Alert, No Data, or Recovered.

You can also further refine the conditions under which actions run by specifying that actions only run when they match a KQL query or when an alert occurs within a specific time frame:
- If alert matches query: Enter a KQL query that defines field-value pairs or query conditions that must be met for notifications to send. The query only searches alert documents in the indices specified for the rule.
- If alert is generated during timeframe: Set timeframe details. Notifications are only sent if alerts are generated within the timeframe you define.

Action variables
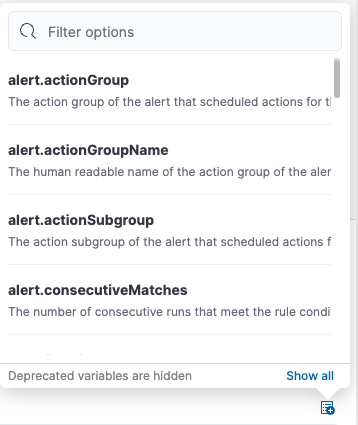
Use the default notification message or customize it. You can add more context to the message by clicking the Add variable icon 

The following variables are specific to this rule type. You can also specify variables common to all rules.
context.alertDetailsUrl- Link to the alert troubleshooting view for further context and details. This will be an empty string if the
server.publicBaseUrlis not configured. context.cloud- The cloud object defined by ECS if available in the source.
context.container- The container object defined by ECS if available in the source.
context.group- The array of objects containing groups that are reporting data.
context.groupingStack- The object containing groups that are reporting data.
context.host- The host object defined by ECS if available in the source.
context.labels- List of labels associated with the entity where this alert triggered.
context.orchestrator- The orchestrator object defined by ECS if available in the source.
context.reason- A concise description of the reason for the alert.
context.tags- List of tags associated with the entity where this alert triggered.
context.timestamp- A timestamp of when the alert was detected.
context.value- List of the condition values.
context.viewInAppUrl-
Link to the alert source.