Grid Integration
Pretty often, you may need to integrate grid with chart, i.e. show grid's data and their changes on chart.
And this article we'll devote to grid-chart integration.
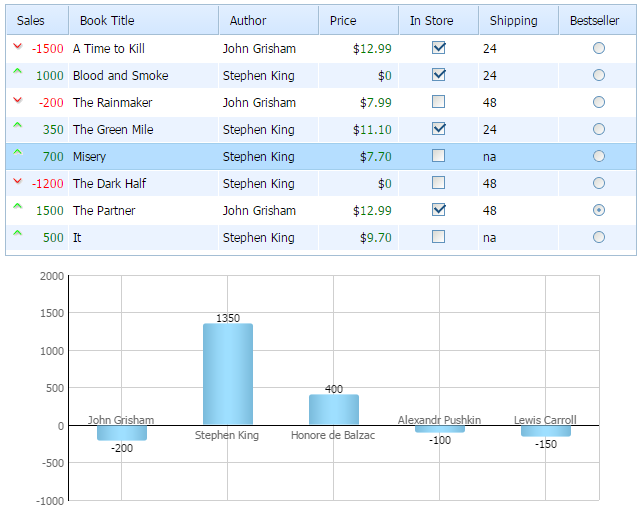
Related sample: Integration with grid
In short, the integration is implemented through the only code line:
myChart.parse(mygrid,"dhtmlxgrid");
In detail, to perform the integration you should make the following steps:
- Create dhtmlxChart object;
- Create dhtmlxGrid object;
- Load data to the grid;
- Load data from the grid to the chart;
- Additionally, implement chart refreshing when data in the grid is changed;
- And put everything into window.onload function to ensure that our code will be performed as soon as the page finishes loading.
Step 1. Create dhtmlxChart object
var myChart = new dhtmlXChart({ view:"bar",//sets chart's type. In our case it's vertical bar color:"#66ccff", //sets color of bars container:"chart_container",// an html container that will contain our chart // sets data that chart will present. #data0# refers to the first column of the grid value:"#data0#", label:"#data0#", // specifies chart labels width:30, // sets the width of bars origin:0, //represents positive and negative values yAxis:{ //sets vertical axis start:-1000, step: 500, end:2000 }, xAxis:{ template:function(){ return "" } //horizontal axis without labels } });
Step 2. Create dhtmlxGrid object
var mygrid = new dhtmlXGridObject('gridbox');// creates dhtmlxGrid instance mygrid.setSkin("dhx_skyblue")// sets skin of our grid
Step 3. Load data to the grid.
// loads data to the grid from the external file gridData.xml mygrid.load("xml/gridData.xml");
Step 4. Load data from the grid to the chart
myChart.parse(mygrid,"dhtmlxgrid")// loads grid's data to the chart
Step 5. Implement chart refreshing when data in the grid is changed
// the function is called every time data in the grid is changed function refresh_chart(){ myChart.clearAll();// clears chart dataset myChart.parse(mygrid,"dhtmlxgrid"); //loads new grid data to the chart }; mygrid.attachEvent("onEditCell",function(stage){// fires after the editor is closed // specifies stage of editing. "2" means that event will fire when the editor closes if (stage == 2) refresh_chart();// calls the function defined before return true; });
Step 6.Put everything into window.onload() function
//the function ensures that our code will be performed when the page's loading ends window.onload = function(){ ...//the code stated above }