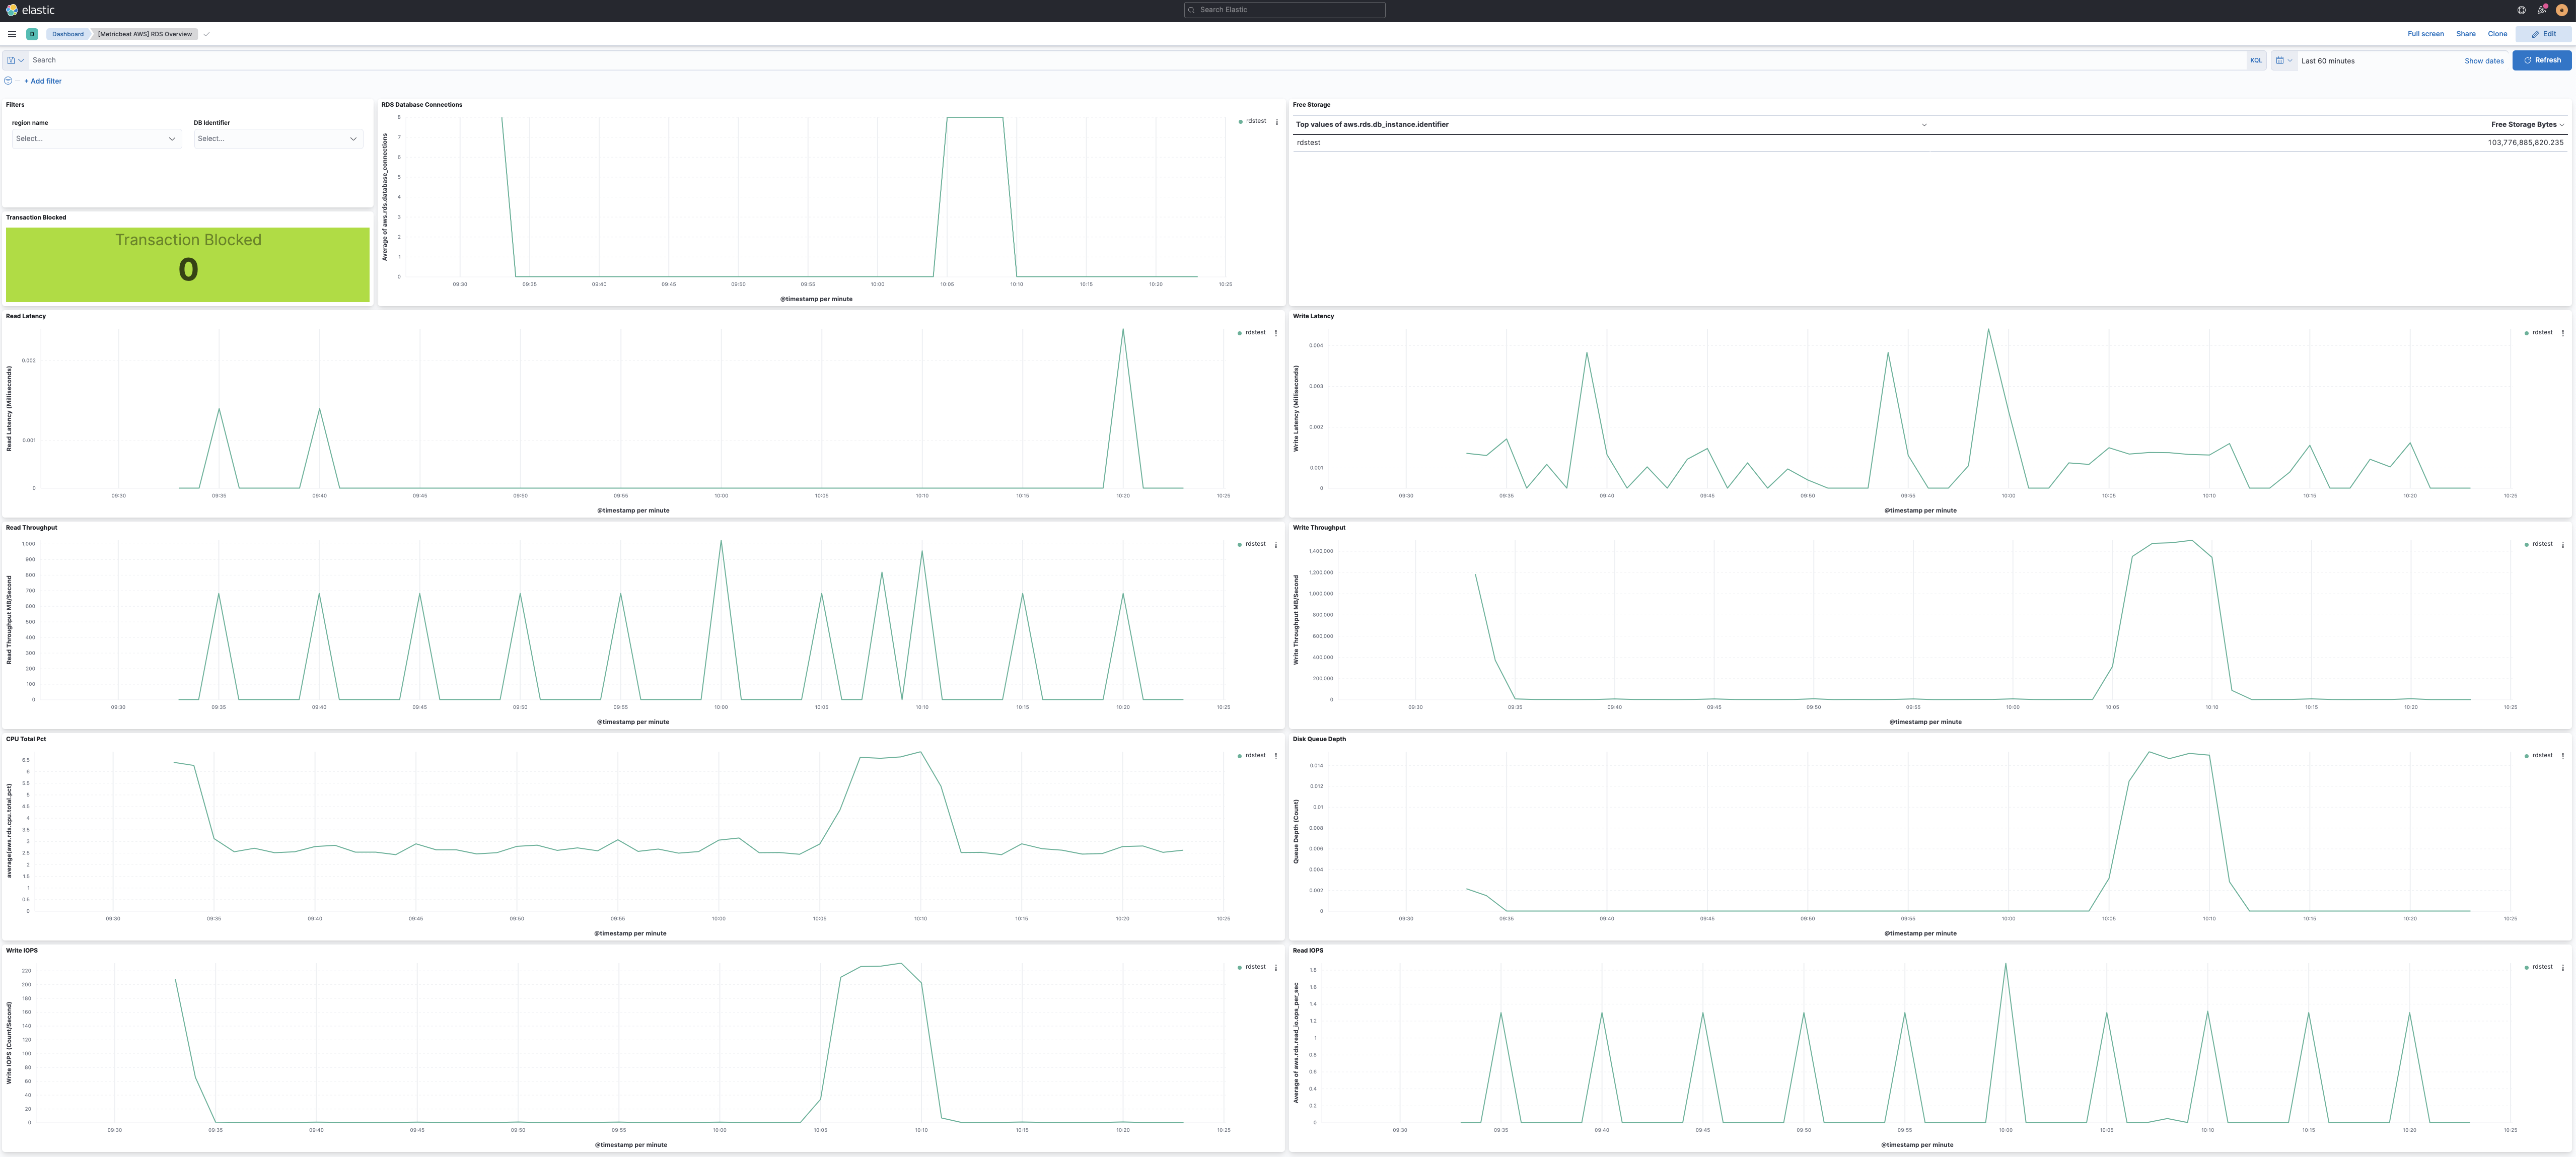
AWS rds metricset
Stack
The rds metricset of aws module allows you to monitor your AWS RDS service. rds metricset fetches a set of metrics from Amazon RDS and Amazon Aurora DB. with Amazon RDS, users can monitor network throughput, I/O for read, write, and/or metadata operations, client connections, and burst credit balances for their DB instances. Amazon RDS sends metrics and dimensions to Amazon CloudWatch every minute. Amazon Aurora provides a variety of Amazon CloudWatch metrics that users can use to monitor health and performance of their Aurora DB cluster. This metricset by default collects all tags from AWS RDS.
Some specific AWS permissions are required for IAM user to collect AWS RDS metrics.
cloudwatch:GetMetricData ec2:DescribeRegions rds:DescribeDBInstances rds:ListTagsForResource sts:GetCallerIdentity iam:ListAccountAliases The aws rds metricset comes with a predefined dashboard.

- module: aws period: 60s metricsets: - rds access_key_id: '<access_key_id>' secret_access_key: '<secret_access_key>' session_token: '<session_token>' This is a default metricset. If the host module is unconfigured, this metricset is enabled by default.
For a description of each field in the metricset, see the exported fields section.
Here is an example document generated by this metricset:
{ "@timestamp": "2017-10-12T08:05:34.853Z", "aws": { "cloudwatch": { "namespace": "AWS/RDS" }, "dimensions": { "DatabaseClass": "db.r5.large" }, "rds": { "aurora_bin_log_replica_lag": 0, "aurora_replica": { "lag": { "ms": 19.9485 }, "lag_max": { "ms": 21.318500518798828 }, "lag_min": { "ms": 21.318500518798828 } }, "aurora_volume_left_total": { "bytes": 70007366615040 }, "cache_hit_ratio": { "buffer": 100, "result_set": 0 }, "cpu": { "total": { "pct": 0.06552109062928828 } }, "database_connections": 0, "deadlocks": 0, "engine_uptime": { "sec": 33121208 }, "free_local_storage": { "bytes": 27275925504 }, "freeable_memory": { "bytes": 4604928000 }, "latency": { "commit": 3.2349916666666667, "ddl": 0, "delete": 0, "dml": 0.09888333333333334, "insert": 0.09888333333333334, "read": 0, "select": 0.2432811228126595, "update": 0, "write": 0.0005787267919438727 }, "login_failures": 0, "queries": 7.862475898034027, "throughput": { "commit": 0.24950762724254, "ddl": 0, "delete": 0, "dml": 0.24950762724254, "insert": 0.24950762724254, "network": 1.3985171580449323, "network_receive": 0.6992585790224661, "network_transmit": 0.6992585790224661, "select": 2.9299395125804084, "update": 0 }, "transactions": { "active": 0, "blocked": 0 } } }, "cloud": { "account": { "id": "428152502467", "name": "elastic-beats" }, "provider": "aws", "region": "eu-west-1" }, "event": { "dataset": "aws.rds", "duration": 115000, "module": "aws" }, "metricset": { "name": "rds", "period": 10000 }, "service": { "type": "aws" } }