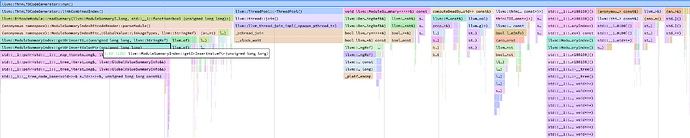
During recent investigations into the slow thin-linking step observed in one of our largest applications, I identified that poor hash quality in ValueInfo was a significant contributor to the performance bottleneck (PR #132917). After landing the aforementioned patch, profiling revealed that ModuleSummaryIndexBitcodeReader::parseModule() became the primary hotspot. Strangely, the sampling profile does not clearly indicate which underlying operations are most time-consuming, even with a high sampling frequency. Additionally, I observed that ~ModuleSummaryIndex() accounts for a substantial portion of the runtime, seemingly due to the release of an std::map—specifically, GlobalValueSummaryMapTy.
Given these observations, I guessed that the large number of entries in the tree map might be contributing to the performance issue. I considered replacing std::map with a hash map to improve efficiency. A quick review of the source code indicates that std::map is used intentionally to ensure stable entry addresses. To address the requirement, I experimented with wrapping the values in std::unique_ptr and substituting std::map with llvm::DenseMap. The results were promising: ~ModuleSummaryIndex() no longer appears as a significant hotspot in the flame graph, and the previously unexplained time spent in ModuleSummaryIndexBitcodeReader::parseModule() has been eliminated. Overall, the total runtime of ThinLTOCodeGenerator::run() was reduced by approximately 50%, as shown in the profiling results.
However, after running make check-llvm with the proposed changes, I discovered that several test cases rely on the ordering of GlobalValueSummaryMapTy. Specifically, 23 tests failed:
Before proceeding to address the affected tests, I would like to solicit feedback on this proposed change, particularly from @teresajohnson. Is the trade-off between performance and ordering requirements acceptable, or are there alternative approaches that might better balance these concerns? Any insights or suggestions would be greatly appreciated.
Separately, I identified another instance of std::map usage (OidGuidMap) that could also be replaced with llvm::DenseMap without side effects. While the runtime impact is less significant, I am pleased to note that this optimization has already been implemented (PR #107725) by @kazutakahirata. Also CC @mingmingl-llvm for better visibility of the RFC as you are one of the reviewers of the patch.
If the map is being iterated on in something other than pretty printers/debug asserts, then at least using MapVector would be better to avoid one source of non-determinism.
Although not noted in the header, we do care about iteration order, which is not going to be deterministic and consistent across runs. E.g. for distributed ThinLTO we serialize summary entries to bitcode, and that will presumably be affected negatively. I can probably add a comment since I don’t see one noting that.
As @danilaml noted, a MapVector would avoid that issue. However, my other big concern about the thin link is the peak memory, and MapVector stores values twice.
Did you measure peak memory with your change? The comment in the header notes that it might have issues due to repeated inserts and resizing.
I note you are using the legacy LTO interface - are you using ld64? Also, given that you saw OidGuidMap which as you noted was addressed in a PR that is about a year old, I’m wondering if you have measured with a more recent version of LLVM. I believe there have been a few improvements in overhead, although I don’t know that there is any that address the one you measured here.
When I get a chance I will look at one of our large targets - I hadn’t noticed the destructor overhead before but I’m now curious to see if that is hitting us as well. It would be good to address that if it is a large overhead, but as mentioned above we do need the ordering consistency and need to be mindful of peak memory.
I realized that my approach essentially mimics a MapVector. However, this does not fully address the ordering constraint observed in some of the tests. While MapVector provides insertion order, some of the failing tests seem to expect keys to be in ascending order. It’s not entirely clear to me if strict key ordering is fundamentally necessary, or if the tests are relying on this as an implementation detail.
Regarding your concern about memory usage: from my understanding, MapVector does not store values twice. Instead, it maintains a vector of values and a map of indices. Based on my measurements, the increase in memory usage is relatively modest.
ld64 total memory usage after parseModule() returns
std::map
llvm::MapVector
Downstream libLTO
24.21G resident + 12.28G dirty
25.06G resident + 12.13G dirty
Trunk libLTO
27.53G resident + 12.29G dirty
28.38G resident + 12.1G dirty
The difference is approximately 800MB at peak, which seems reasonable given the performance gains.
Performance
std::map
llvm::MapVector
Downstream libLTO
~ModuleSummaryIndex(): 18.86 s, parseModule(): 1.76 min
~ModuleSummaryIndex(): 1.71 s, parseModule(): 32.15 s
Trunk libLTO
~ModuleSummaryIndex(): 19.84 s, parseModule(): 1.76 min
~ModuleSummaryIndex(): 1.51 s, parseModule(): 30.37 s
Yes, we are using ld64, as the target is a binary within an iOS app. The libLTO.dylib I used is based on a slightly modified swiftlang/llvm-project:swift-6.0-RELEASE, so it is not too outdated. I have also re-run the tests on the mainline LLVM, and observed no significant differences in performance or memory usage compared to our downstream version, as shown above.
I hope these measurements help clarify the tradeoffs. Please let me know if you need any additional data or if there are other scenarios you’d like me to investigate. Thanks again for your guidance!
I realized that my approach essentially mimics a MapVector. However, this does not fully address the ordering constraint observed in some of the tests. While MapVector provides insertion order, some of the failing tests seem to expect keys to be in ascending order. It’s not entirely clear to me if strict key ordering is fundamentally necessary, or if the tests are relying on this as an implementation detail.
The key ordering is due to the std::map behavior, but isn’t required for correctness or stability. One approach to deal with test changes might be to sort on keys before serializing out to LLVM disassembly.
teresajohnson:
As @danilaml noted, a MapVector would avoid that issue. However, my other big concern about the thin link is the peak memory, and MapVector stores values twice.
Did you measure peak memory with your change? The comment in the header notes that it might have issues due to repeated inserts and resizing.
Regarding your concern about memory usage: from my understanding, MapVector does not store values twice. Instead, it maintains a vector of values and a map of indices. Based on my measurements, the increase in memory usage is relatively modest.
Sorry, I got that wrong - it stores keys twice, not the values.
ld64 total memory usage after parseModule() returns | std::map | llvm::MapVector |
The difference is approximately 800MB at peak, which seems reasonable given the performance gains.
Wow, that’s a monster thin link! I thought our applications were massive but they typically max out at 12G or a bit more in a few extra big cases.
Performance | std::map | llvm::MapVector |
| - | - | Downstream libLTO | ~ModuleSummaryIndex(): 18.86 s, parseModule(): 1.76 min | ~ModuleSummaryIndex(): 1.71 s, parseModule(): 32.15 s | Trunk libLTO | ~ModuleSummaryIndex(): 19.84 s, parseModule(): 1.76 min | ~ModuleSummaryIndex(): 1.51 s, parseModule(): 30.37 s |
Let me try your PR if you have one handy. These reductions in time are nice but I am somewhat concerned about the memory increase as we historically have had bigger issues keeping that within our build system default limits.
I’ll also try to do some profiling to see where our thin link is spending most of its time for a large application.
Looking back at your original flame graphs, I assume the parseModule time was spent down in ModuleSummaryIndex::getOrInsertValuePtr() which inserts into the map. Are you building your linker with -gmlt? With enough debug info in theory you should get the inline stacks too. I wonder if some kind of reserve() would help there too, if we could figure out how many entries will be inserted ahead of time.
I built lld with debug info and ran one of our most massive thin links (~5m just for the thin link and a huge memory footprint) and weirdly do not see any time in the resulting cycle profile attributed to the ModuleSummaryIndex destructor. I do see some in parseModule, but not nearly as dominant as in your case.
I don’t know if the difference comes from bad luck with GUID keys, or differences in the way lld and the new LTO API build/use the index (compared to ld64 and the old LTI API), or differences in the memory allocator (we use tcmalloc).
Also, I realized that MapVector alone doesn’t work out of the box, as it doesn’t have iterator and pointer stability. We save and pass around pointers obtained from the iterator returned during insertion.
I rebuilt the baseline libLTO.dylib with -g and repeated the sampling profile. You were correct: most of the time is spent in getOrInsertValuePtr(), with the underlying operations dominated by tree map manipulation.
I expected similar behavior in this scenario regarding differences between the old and new LTO APIs. However, since lld isn’t compatible with my current target, I couldn’t directly compare its performance. I did experiment with injecting tcmalloc into ld64 and observed a modest improvement: the runtime for ~ModuleSummaryIndex dropped to 11 seconds.
To address iterator/pointer stability, I moved GlobalValueMap to the heap and stored both the map pointer and the offset of GlobalValueSummaryInfo within ValueInfo. This allows dereferencing much like array access.
Thanks for the PR. I applied it and do see a decent speedup, albeit with a memory cost. For the large LTO link I was looking at, the thin link time decreased by around 14%, but the peak memory increased by 4-5%. I didn’t collect another profile, but since the destructor didn’t show up to start with, the speedup presumably came from reducing the time in getOrInsertValuePtr().
That is a nice speedup! I wish it didn’t come at the cost of additional memory. It’s unfortunate that the pointer to the map needs to be stored in every single ValueInfo. I wonder how difficult it would be to just keep the offset in the ValueInfo and pass in a pointer to the map each time we need to dereference. The comparators and DenseMapInfo handling would have to change to compare offsets instead of GUIDs for equality (and the tombstone and empty keys could presumably change to max uint type vals).
I’ll see if I can come up with any other ideas to avoid the memory increase…