Overview
Google Charts can be printed directly from your browser, or from JavaScript via the print() function. If you want to provide access to a PNG image of a chart, you can use the getImageURI() method. This currently works for core charts and geocharts.
If your chart (of type ChartType, such as ColumnChart or PieChart) is called my_chart and the div displaying it is my_div, here's how you access the chart as a PNG:
var my_div = document.getElementById('chart_div'); var my_chart = new google.visualization.ChartType(chart_div); google.visualization.events.addListener(my_chart, 'ready', function () { my_div.innerHTML = '<img src="' + my_chart.getImageURI() + '">'; }); my_chart.draw(data); Note: You should wait for the ready event, as shown in the examples on this page, to ensure that the chart has finished rendering.
Note: This will only work in browsers that support the HTML5 <canvas> element, and so won't work on Internet Explorer 9 or earlier.
Here's a complete example:
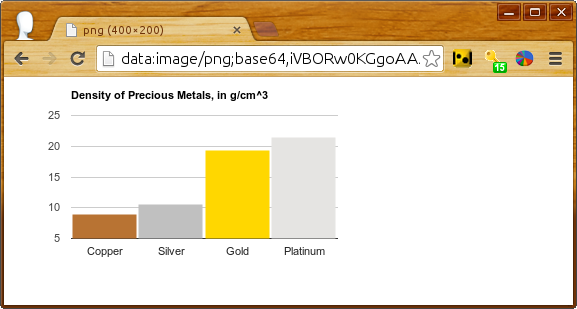
<html> <head> <script type="text/javascript" src="https://www.gstatic.com/charts/loader.js"></script> <script type="text/javascript"> google.charts.load("current", {packages:['corechart']}); google.charts.setOnLoadCallback(drawChart); function drawChart() { var data = google.visualization.arrayToDataTable([ ['Element', 'Density', { role: 'style' }], ['Copper', 8.94, '#b87333', ], ['Silver', 10.49, 'silver'], ['Gold', 19.30, 'gold'], ['Platinum', 21.45, 'color: #e5e4e2' ] ]); var options = { title: "Density of Precious Metals, in g/cm^3", bar: {groupWidth: '95%'}, legend: 'none', }; var chart_div = document.getElementById('chart_div'); var chart = new google.visualization.ColumnChart(chart_div); // Wait for the chart to finish drawing before calling the getImageURI() method. google.visualization.events.addListener(chart, 'ready', function () { chart_div.innerHTML = '<img src="' + chart.getImageURI() + '">'; console.log(chart_div.innerHTML); }); chart.draw(data, options); } </script> <div id='chart_div'></div>When this program runs, chart_div.innerHTML will be set to this PNG encoding of the chart and displayed in the JavaScript console:
data:image/png;base64,iVBORw0KGgoAAAANSUhEUgAAAZAAAADICAYAAADGFbfiA...
When that URI is placed directly into a browser address bar, modern browsers will render the image:
You can include a link to the printable version with the following line of JavaScript:
document.getElementById('png').outerHTML = '<a href="' + chart.getImageURI() + '">Printable version</a>'; followed by this line in your HTML:
<div id='png'></div>
Snapshotting Selections
As a chart creator, you can do most anything to your charts programmatically that users can do in their browsers. So if you want to create a static image of the chart with a tooltip showing or with crosshairs at a particular point, you can do that by calling setSelection() prior to getImageURI(), as shown below.
Here's a scatter chart with 100 random points, one of them with tooltip and crosshairs pre-selected:
Reload and you'll see a different point selected. The code, with key lines in bold:
<script type="text/javascript"> google.charts.load("current", {packages:['corechart']}); google.charts.setOnLoadCallback(drawChart); function drawChart() { var data = new google.visualization.DataTable(); data.addColumn('number'); data.addColumn('number'); for (var i = 0; i < 100; i++) data.addRow([Math.floor(Math.random() * 100), Math.floor(Math.random() * 100)]); var options = { legend: 'none', crosshair: { trigger: 'both' }, // Display crosshairs. tooltip: { trigger: 'selection' } // Display tooltips on selection. }; var chart = new google.visualization.ScatterChart(document.getElementById('scatter_setselection')); google.visualization.events.addListener(chart, 'ready', function () { chart.setSelection([{row:99, column:1}]); // Select one of the points. png = '<a href="' + chart.getImageURI() + '">Printable version</a>'; console.log(png); }); chart.draw(data, options); }