Figure widget update #1035
Figure widget update #1035
Conversation
…instead of code with %%html
| @michaelbabyn gonna have a look now |
Overview
You should combine this two code blocks and put the i.e. As a general rule, it is better to combine more code together, unless you specifically want to print multiple things in each code cell. An example of this is further down in the this doc:
|
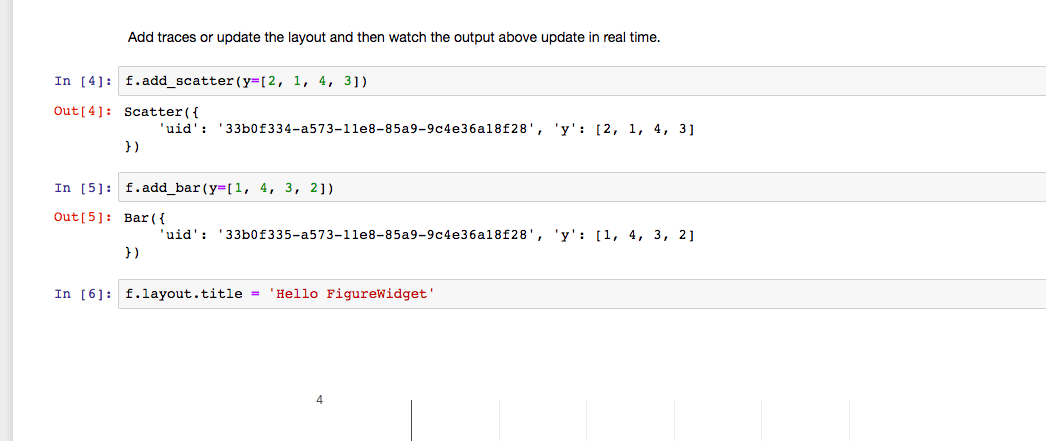
| @Kully , I'll go back through these and see what I can merge and I'll get rid of that superfluous output from updating the figureWidget but I think it makes sense to keep the updates separated to help demonstrate that each code block will instantly update the graph. See below for what I mean.
|

no, you're absolutely right. I was a little unclear in my first comment. The second picture was demonstrating a Good use of small code chunks to show the functionality of adding different trace types. |
… Jons notebooks as case studies to reflect that they are layed out differently
|
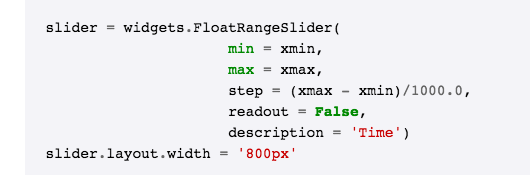
there should not be this much white space between the param and arg: |
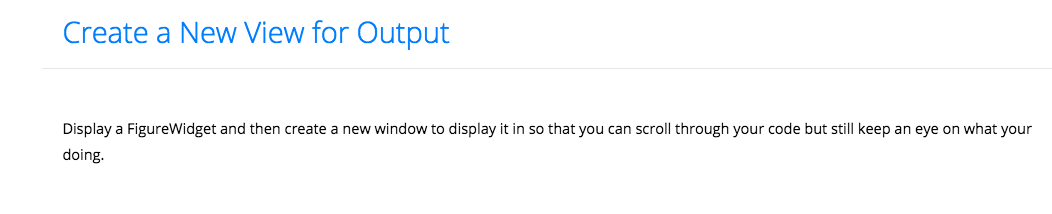
Jupyter Lab with FigureWidget
|
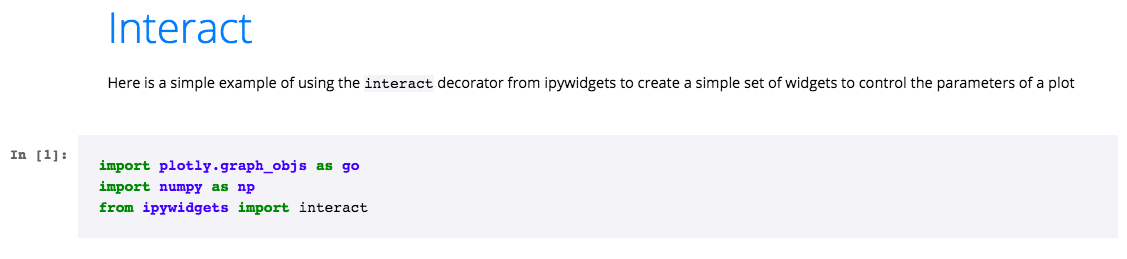
Interact Decorator
put a period at the end of this sentence
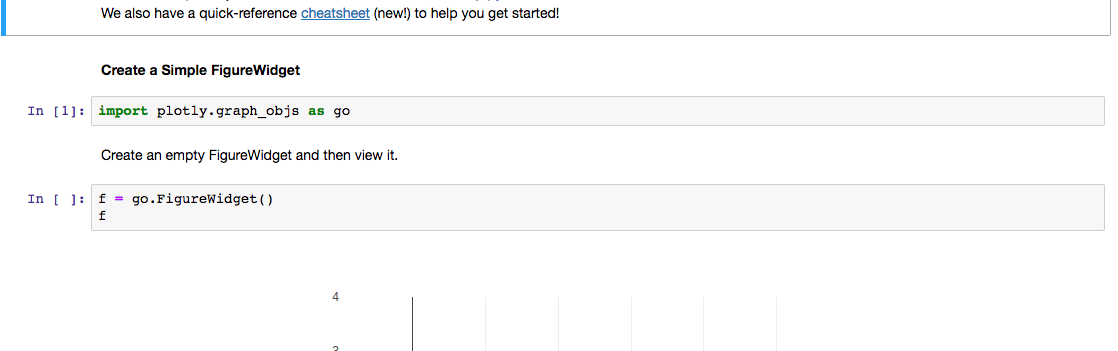
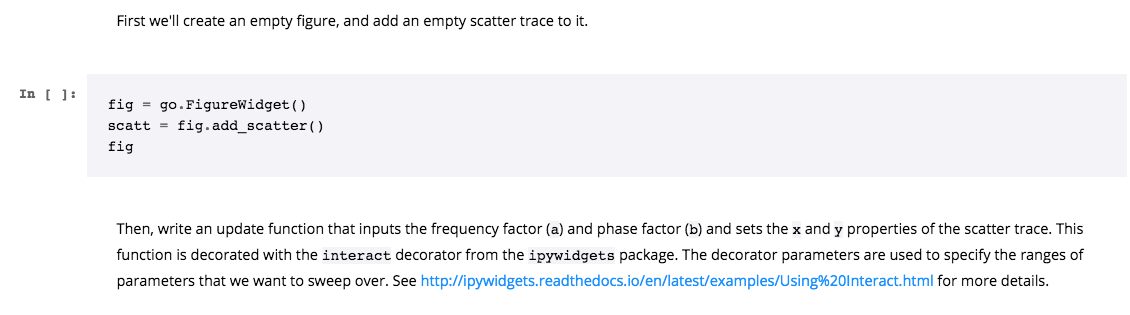
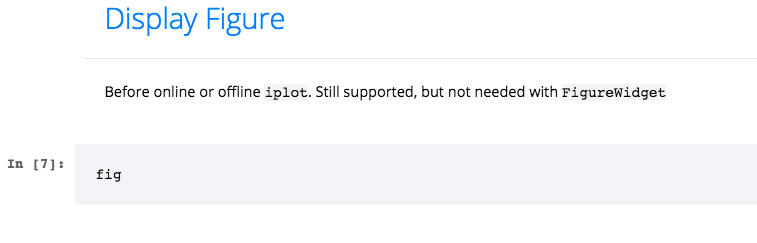
You should put an empty chart in here |
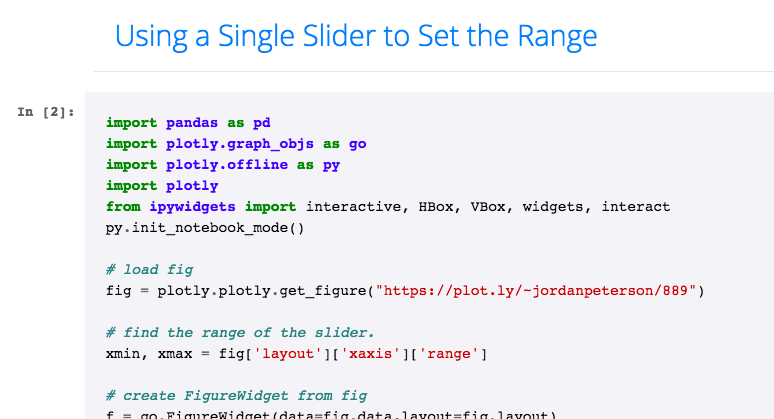
Slider WidgetImportant note for all docs. The structure of our imports are like this: See the scatter plot doc for an example of this.
PEP-8 - same comment from previous section: Same comments for the rest of this doc. |
DashShader Case Studyperiod at the end of sentence:
Combine these 3 cells together
same here:
|
Click Eventsseparate the imports as explained above *Short and Sweet - very good 👍 |
Selection Events
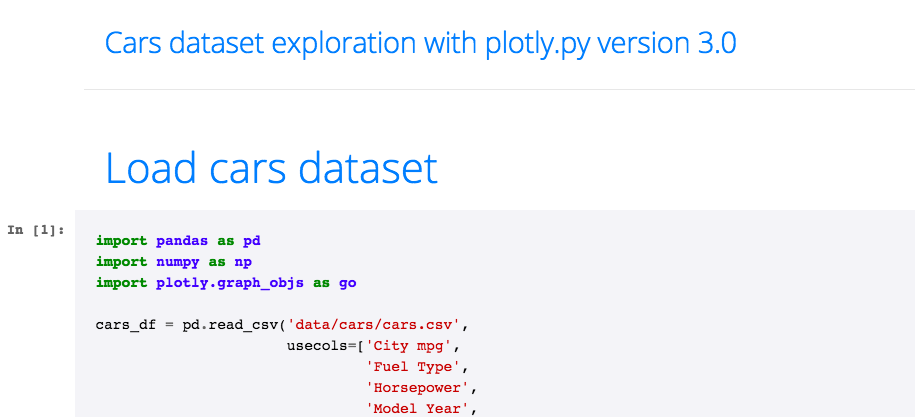
Car ExplorationThe
and
this cell needs to be run. the image is not showing up in the doc
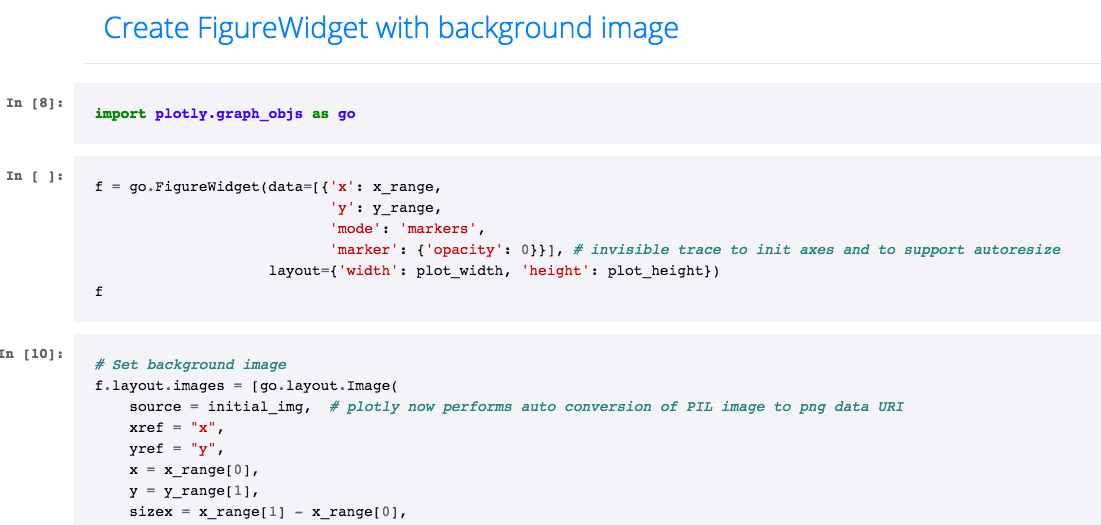
same comment about collecting import lines togetherthere is no output under
Again,
All headers should be h4s eg.
|

| @Kully , I made the changes you mentioned in all but the "case study" docs (since those are just Jon's with GIFs to show off the widget and I think it makes sense to leave them as they are). So I think this should be good to merge. What do you think? |
| @michaelbabyn It looks like you did at least some of the grammar edits, but my comments about the headers in Send me a message if you are confused about what I am asking and I can clarify. |
| @michaelbabyn @cldougl People are still sharing the old |
| I think they can be merged ASAP, @Kully wasn't sure if we should keep one of Jon's docs in there as is since it is quite different stylistically from the rest of the docs but that's all that's blocking. |
Yeah, we shouldn't let that hold this up. Please merge & deploy today with either Jon's doc or a modified version that is more stylistically similar. |
| @jackparmer I told michael to wait until this could be reviewed before merging. @michaelbabyn feel free to merge now and we can deal with the styling later |
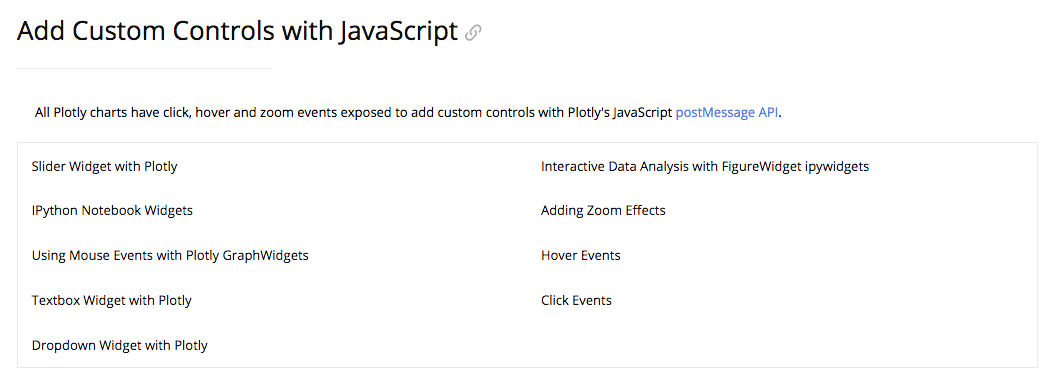
| Has this been deployed yet? I'm still seeing the old GraphWidget stuff in the "Custom Controls with JavaScript" section.
Thanks for all your work on this @michaelbabyn! |
This is the PR for updating the graphwidget documentation to plotly.py version 3's FigureWidget for this issue.