
Database Migration Service collects and displays migration job metrics that represent the health and progress of your data migration process. This page describes the following areas associated with migration job metrics:
Metrics available on the migration job details page covers the observability information you can view directly in Database Migration Service on the migration job details page.
Metrics available in Cloud Monitoring describes all metrics related to migration job performance, including the metrics surfaced from the Cloud SQL for SQL Server destination instance.
Metrics available on the migration job details page
The migration job details page shows several diagrams that can help you understand the current state and progress of your migration job. You can filter the information in these diagrams for each database included in your migration job.
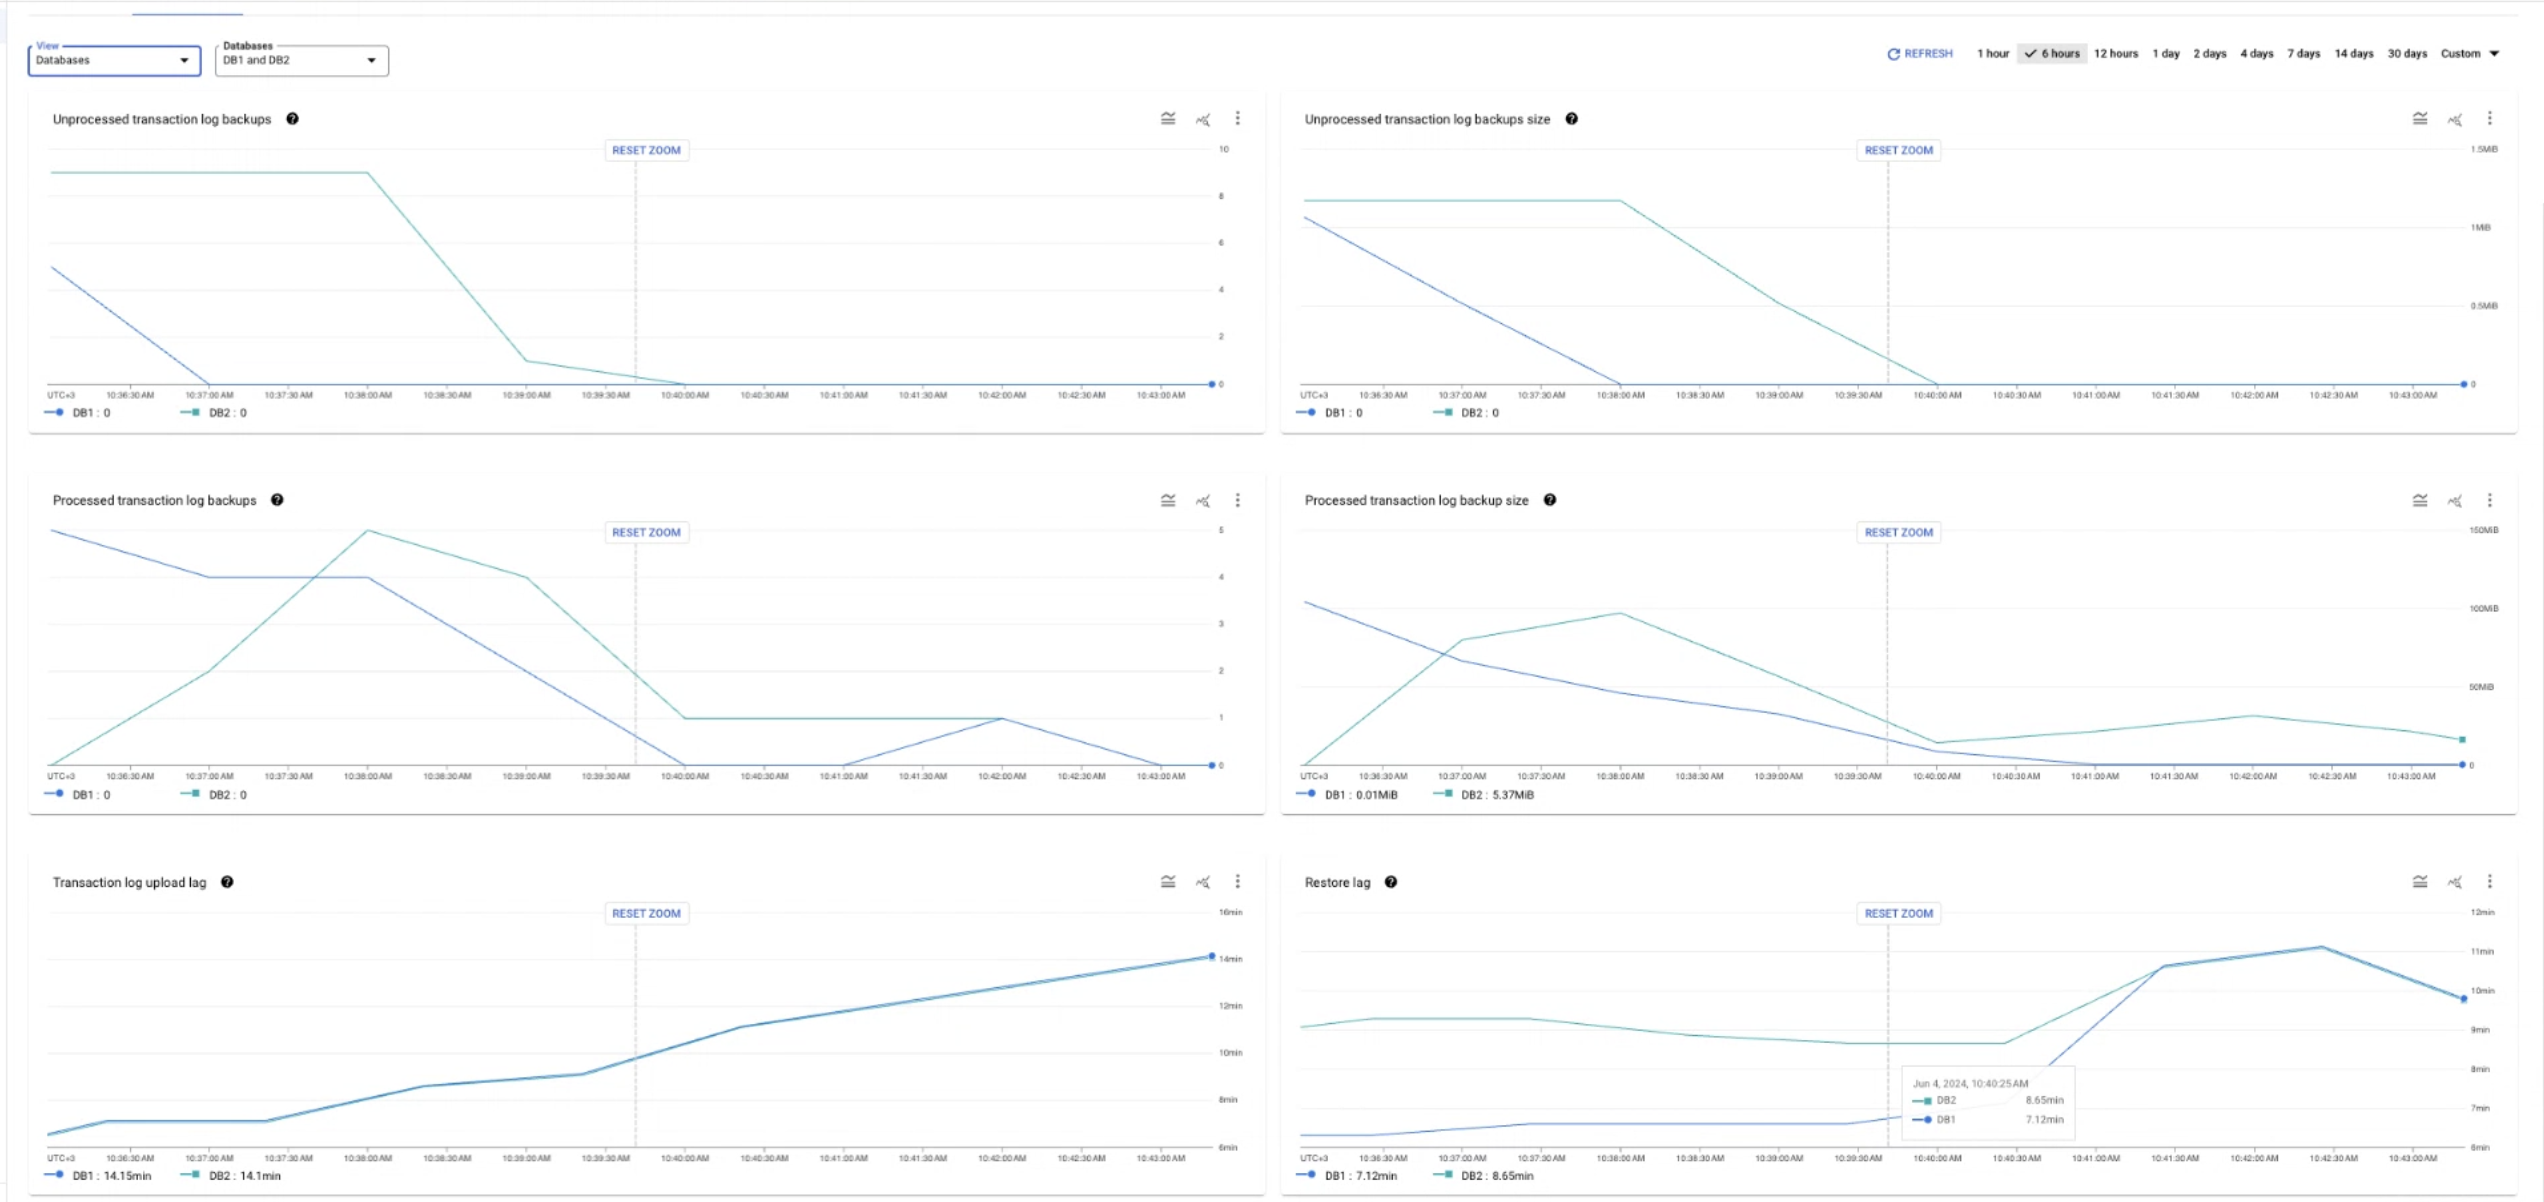
Expand the following sections to learn more about each diagram and its associated metric.
Restore lag
The Restore lag diagram uses the migration_job/max_replica_sec_lag metric to represent the time difference between the backup file epoch (derived from the file name), and the moment when that file is fully restored in your Cloud SQL destination instance. This metric monitors all types of backup and transaction log files that you use for a migration job (that is, a full backup, a differential backup, or a transaction log file). You can use this information to estimate your average data replication speed, or to troubleshoot possible issues with continuous data replication.
This metric is available for each database included in your migration job, and in the aggregated view where it shows restore lag across all databases included in your migration job.
Transaction log backup upload lag
The Transaction log backup upload lag diagram uses the migration_job/sqlserver/transaction_log_upload_sec_lag metric to show how much time (in seconds) has passed between now and the timestamp of the last transaction log file you uploaded to Cloud Storage. You can use this metric to monitor possible issues with automated uploads of transaction log files: a big time difference could indicate that your transaction log files aren't being uploaded to the Cloud Storage bucket.
This metric is available for each database included in your migration job, and in the aggregated view where it shows the highest lag across all databases included in your migration job.
Processed transaction log backups
The Processed transaction log backups diagram uses the migration_job/sqlserver/processed_file_count metric to represent how many transaction log backup files Database Migration Service has processed and imported to Cloud SQL. This information updates after a transaction log is fully processed, so the line displayed on the diagram moves in bigger jumps rather than gradual decreases.
You can monitor this metric to track the progress of the incremental load phase. A value greater than 0 indicates that your migration job finished the initial load phase and is now in the incremental load phase.
This metric is available for each database included in your migration job, and in the aggregated view where it shows a summary for all databases included in your migration job.
Processed transaction log backups size
The Processed transaction log backups size diagram uses the migration_job/sqlserver/processed_file_bytes_count metric to show how much transaction log data (in bytes) Database Migration Service has replicated to your Cloud SQL destination instance. This information updates after a transaction log is fully processed, so the line displayed on the diagram moves in bigger jumps rather than gradual decreases.
This metric is available for each database included in your migration job, and in the aggregated view where it shows a summary for all databases included in your migration job.
Unprocessed transaction log backups
The Unprocessed transaction log backups diagram uses the migration_job/sqlserver/unprocessed_files metric to represent how many transaction log backup files Database Migration Service has detected in your source Cloud Storage bucket but has not yet replicated to your Cloud SQL destination instance. This information updates after a transaction log is fully processed, so the line displayed on the diagram moves in bigger jumps rather than gradual decreases.
You can watch this metric when you want to determine when to finalize your migration job. A good time to promote the migration job would be when the value of Unprocessed transaction log backups reaches zero and you don't have more transaction log files to upload to Cloud Storage.
This metric is available for each database included in your migration job, and in the aggregated view where it shows a summary for all databases included in your migration job.
Unprocessed transaction log backups size
The Unprocessed transaction log backups size diagram uses the migration_job/sqlserver/unprocessed_file_bytes metric to show how much data (in bytes) Database Migration Service has detected in your source Cloud Storage bucket but has not yet replicated to your Cloud SQL destination instance. This information updates after a transaction log is fully processed, so the line displayed on the diagram moves in bigger jumps rather than gradual decreases.
You can watch this metric when you want to determine when to finalize your migration job. A good time to promote the migration job would be when the value of Unprocessed transaction log backups size reaches zero and you don't have more transaction log files to upload to Cloud Storage.
This metric is available for each database included in your migration job, and in the aggregated view where it shows a summary for all databases included in your migration job.
Total destination storage usage
The Total destination storage usage diagram uses the Cloud SQL database/disk/bytes_used metric to show how much data (in bytes) is stored in all the databases in your destination Cloud SQL instance. You can use this information to estimate the progress of your migration job.
This metric is only available in the aggregated view. You can't filter the total disk usage per database.
Replication delay
The Replication delay diagram uses the Cloud SQL per_database/postgresql/external_sync/replication_byte_lag metric to show the difference (in bytes) between the time an operation was executed on the source and when it was applied to the destination instance.
You can use this information to ensure data consistency between the source and the destination instance.
This metric is available for each database included in your migration job, and in the aggregated view where it shows a summary for all databases included in your migration job.
View metrics on the migration job details page
To view metric diagrams on the migration job details page, perform the following steps:
- In the Google Cloud console, go to the Migration jobs page.
- In the Jobs tab, click the display name of your migration job.
The migration job details page opens.
- In the Databases section, you can view Restore lag and Unprocessed transaction log backups size numerical data for each database included in your migration job.
- Click the Monitoring tab to see the metrics diagrams.
- You can use the View menu to show aggregated data for all databases included in your migration job, or filter the information for specific databases.
- You can also view each diagram directly in Cloud Monitoring. Click More chart options > View in Metrics Explorer.
Metrics available in Cloud Monitoring
The following table describes all migration job metrics you can use to create charts in Metrics Explorer for SQL Server migrations. The complete metrics Database Migration Service metrics reference lists several additional metrics, but they are not available for SQL Server migrations.
You can also use the Cloud SQL cloudsql/database/disk/bytes_used metric and compare it with the total size of your source databases to estimate the migration job progress.
| Metric type Launch stage Display name | |
|---|---|
| Kind, Type, Unit Monitored resources | Description Labels |
migration_ BETA Max lag bytes of the migration job data. | |
GAUGE, INT64, By datamigration.googleapis.com/MigrationJob | Current replication lag, aggregated across all of the migration job's data. Sampled every 60 seconds. After sampling, data is not visible for up to 180 seconds. database: Database name. |
migration_ BETA Max lag in seconds of the migration job data | |
GAUGE, INT64, s datamigration.googleapis.com/MigrationJob | Current replication lag, aggregated across all of the migration job's data. Sampled every 60 seconds. After sampling, data is not visible for up to 180 seconds. database: Database name. |
migration_ BETA Processed Files Bytes Count | |
DELTA, INT64, By datamigration.googleapis.com/MigrationJob | Number of bytes uploaded to the destination. Sampled every 60 seconds. After sampling, data is not visible for up to 180 seconds. database: Database name. |
migration_ BETA Processed Files Count | |
DELTA, INT64, 1 datamigration.googleapis.com/MigrationJob | Number of files uploaded to the destination. Sampled every 60 seconds. After sampling, data is not visible for up to 180 seconds. database: Database name. |
migration_ BETA Transaction Log Upload Sec Lag | |
GAUGE, INT64, s datamigration.googleapis.com/MigrationJob | The lag in seconds since the last uploaded transaction log. Sampled every 60 seconds. After sampling, data is not visible for up to 180 seconds. database: Database name. |
migration_ BETA Unprocessed File Bytes | |
GAUGE, INT64, By datamigration.googleapis.com/MigrationJob | Unprocessed file bytes waiting to be uploaded to Cloud SQL. Sampled every 60 seconds. After sampling, data is not visible for up to 180 seconds. database: Database name. |
migration_ BETA Unprocessed Files | |
GAUGE, INT64, 1 datamigration.googleapis.com/MigrationJob | Unprocessed files waiting to be uploaded to Cloud SQL. Sampled every 60 seconds. After sampling, data is not visible for up to 180 seconds. database: Database name. |